Underwater Acoustic Communication Market Size, Share & Growth

Underwater Acoustic Communication Market Size, Share, Statistics and Industry Growth Analysis Report By Interface Platform (Sensor Interface, Acoustic Modem), Application (Environmental Monitoring, Pollution Monitoring, Hydrography, Oceanography), Communication Depth, End User and Region - Global Forecast to 2028

Report Code: SE 5910 Dec, 2022, by marketsandmarkets.com

Updated on : October 22, 2024

The underwater acoustic communication market is witnessing significant growth due to rising demand for reliable communication solutions in marine environments. Industries such as oil and gas, maritime defense, and marine research are increasingly relying on efficient underwater communication systems, driven by the expansion of underwater robotics and autonomous underwater vehicles (AUVs). Key trends include advancements in signal processing and the development of sophisticated acoustic modems that enhance data transmission rates. Looking ahead, the market is set for further growth as investments in research and development focus on improving communication range and capabilities, driven by the need for resource exploration and environmental monitoring.

Underwater Acoustic Communication Market Size

[199 Pages Report] Global Underwater acoustic communication market size is valued at USD 2.1 billion in 2023 and is anticipated to be USD 3.5 billion by 2028; growing at a CAGR of 11.0% from 2023 to 2028. Factors such as increasing adoption of underwater acoustic modems in oil & gas industry and growing deployment of acoustic navigation for underwater positioning are fueiling the market growth for underwater acoustic communication industry.
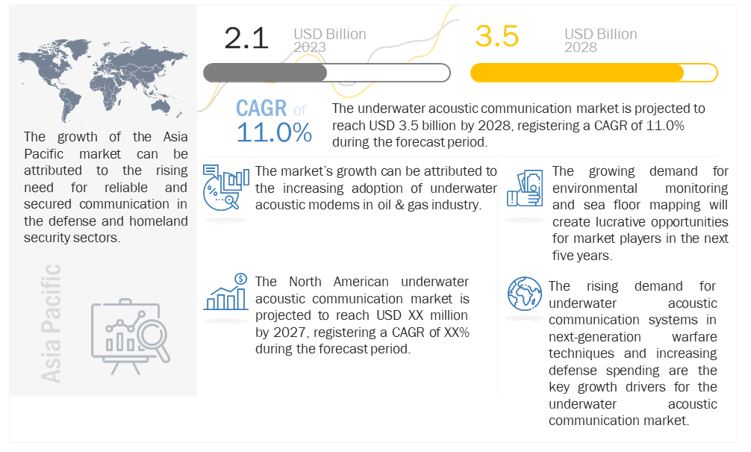
Underwater Acoustic Communication Market

Underwater Acoustic Communication Market Forecast to 2028

To know about the assumptions considered for the study, Request for Free Sample Report

Underwater Acoustic Communication Market Dynamics

Driver: Growing deployment of acoustic navigation for underwater positioning

Acoustic navigation is the most used way for underwater navigation and positioning. Based on deployment, it can be classified as long-baseline system (LBL), short baseline system (SBL), and ultra-short baseline system (USBL). The acoustic method determines the relative positions of underwater vehicles by using deployed baseline transponders as underwater reference points and calculating signals from them. Acoustic navigation for underwater positioning is heavily used in defense and navy. Currently, LBL and USBL are the most commercially used, such as Kongsberg’s HiPAP series of acoustic positioning devices which can be used as both LBL or USBL as desired. These HiPAP series acoustic positioning devices can switch modes while having both the high accuracy of LBL and the convenience of USBL. These devices are so advanced that HiPAP-602 can work at a depth of 7,000 m and has an accuracy of 0.02 m.  All these factors have increased the usage of underwater acoustic navigation and, hence, driving the market growth

Restraint: Delayed delivery rates in underwater communication

The propagation speed in underwater wireless sensor networks (UWSNs) is about 200,000 times slower than that in terrestrial wireless sensor networks (TWSNs). Specifically, the propagation speed of TWSN radio channels is 300,000,000 m/s, while the propagation speed of UWSN acoustic channels is only about 1500 m/s. Thus, guaranteeing bounded end-to-end delay would be challenging in underwater communication.

Opportunity: Usage of 5G network for underwater communication

Underwater wireless communication is intended to share information effectively among connected sensors, underwater vehicles, computing devices, surface stations, robotic equipment, etc. It helps to monitor real-world underwater assets, micro-organisms, human activities, sudden disasters, etc. 5G technology is pushing the boundaries of wireless communications, enabling use cases that rely on ultra-fast speeds, low latency, and high reliability. 5G supports all radio frequency, electromagnetic waves, optic signals, and acoustic signals for advanced underwater communication systems. 6G networks are combined with Space-Air-Ground-Sea Integrated Networks (SAGSIN) to attain universal coverage.

Challenge: Security threat in underwater communication

Underwater networks are usually left unattended for long durations, exposing them to diverse potential threats. Due to the wide data broadcasting range of these networks, their physical channel (both wired and wireless) is prone to eavesdropping. Secure communication is crucial in many internet of underwater things (IoUT) infrastructures such as harbor security, coastal defense, and many more, where unauthorized access can have serious consequences. The security threats in underwater communications can be divided into passive and active attacks, in accordance with the actions taken by the intruders.

Acoustic modem by interface platform to capture highest market share of underwater acoustic communication market during forecast period

The increasing adoption of underwater acoustic modems in naval defense to support communication systems is projected to drive the growth of the acoustic modem segment. These systems are used in applications such as submarine communication, diver communication, remote underwater monitoring, and command and control. Developed countries are focusing on their naval defense forces and actively using unmanned underwater vehicles for communication and navigation applications.

Medium water segment by communication depth to hold highest market share in underwater acoustic communication market during the forecast period.

Increasing environmental awareness among the public and industries to minimize environmental impact is creating new requirements for effective monitoring and safe process control systems Sonardyne’s Modem 6 Sub-Mini is a compact and transmission-suitable acoustic modem for transferring data from a wide range of sensors, including current profilers, temperatures, depth, and custom instrumentation. An acoustic modem named type 8377-1111 has a depth rating of 1,000 m and an omnidirectional transducer designed for horizontal and water communication in medium water depth.

Environmental monitoring applications expected to hold the largest share in underwater acoustic communication market during the forecast period

The US Environmental Protection Agency (EPA) Environmental Monitoring and Assessment Program (EMAP) perform research on the undersea environment to study the aquatic ecosystems across the US. The risk of oil spills and leaks from offshore oil and gas production is a major challenge and threat to the environment. In underwater acoustics, environmental monitoring is one of the major applications allowing the transmission of information in a directivity controlled and efficient manner.

Scientific Research & Development segment by end user is expected to hold the largest market share of underwater acoustic communication market

Underwater acoustic communication is affected by the seawater environment and the complexity of underwater acoustic channels. Underwater acoustic communication is of great significance to the marine survey, thus, witnessing a continuous demand for scientific research & development. Various countries attach great importance to the development of underwater acoustic communication technology and continuously overcome the difficulties of underwater communication problems.

Underwater Wireless Communication Market

The underwater wireless communication market is poised for significant growth as the demand for efficient communication solutions in subsea environments continues to rise. With industries such as marine exploration, offshore oil and gas, aquaculture, and military defense seeking reliable communication networks for monitoring, data transfer, and operational efficiency, the need for advanced underwater communication technologies is crucial. Key trends driving the market include the development of acoustic communication systems, optical and electromagnetic technologies, and hybrid solutions that offer improved data transfer speeds and better signal range. As underwater operations become more complex and remote, the focus is shifting towards real-time monitoring, autonomous underwater vehicles (AUVs), and deep-sea research applications. Additionally, advancements in 5G and IoT integration are enhancing the capabilities of underwater networks, offering faster, more reliable communication in previously challenging conditions. The future of the market looks promising, with innovations aimed at improving signal stability, reducing latency, and enhancing energy efficiency to meet the growing demands of underwater communications across various industries.
 

Underwater Acoustic Communication Market in asia pacific to grow at highest CAGR during the forecast period
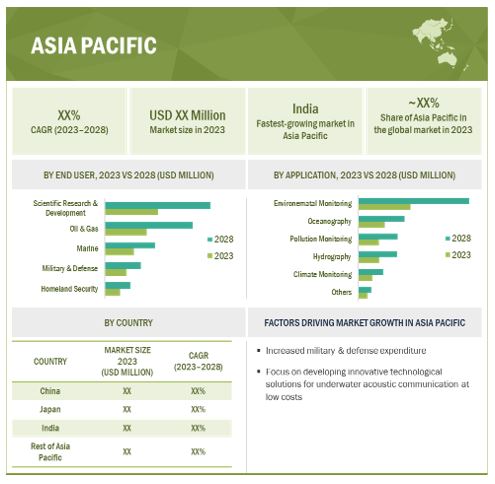
Underwater Acoustic Communication Market Size, and Share

Underwater Acoustic Communication Market by Region

To know about the assumptions considered for the study, download the pdf brochure

Key Market Players

The underwater acoustic communication companies such as Teledyne Technologies Incorporated (US), KONGSBERG (Norway), Thales (France), L3Harris (US), Ultra (UK), Sonardyne International (UK), EvoLogics GmbH (Germany), Moog, Inc. (US) and Nortek (Norway). These players have adopted product launches, contracts, collaborations, agreements, and acquisitions to grow in the market.

Underwater Acoustic Communication Market Report Scope :

Report Metric

Details

Estimated Market Size USD 2.1 billion in 2023
Projected Market Size USD 3.5 billion by 2028
Growth Rate CAGR of 11.0%

Market size available for years

2019–2023

Base year considered

2022

Forecast period

2023–2028

Forecast units

Value (USD Million/USD Billion)

Segments covered

By Interfcae Platform, By Communication Depth, By Application, By End User and By Region

Geographies covered

Asia Pacific, Europe, North America and Rest of World

Companies covered

The key players operating in the underwater acoustic communication market are L3Harris (US), Ultra (UK), KONGSBERG (Norway), Thales (France), Sonardyne International (UK), Teledyne Technologies Incorporated (US), EvoLogics GmbH (Germany), Moog, Inc. (US) and Nortek (Norway).

Underwater Acoustic Communication Market Highlights

The study categorizes the underwater acoustic communication market based on By Interface Platform, By Communication Depth, By Application, By End User and By Region

Aspect

Details

By Interface Platform:

  • Sensor Interface
  • Acoustic Modem
  • Others

By Communication Depth:

  • Shallow Water
  • Medium Water
  • Long Water
  • Full Ocean

By Application:

  • Environmental Monitoring
  • Pollution Monitoring
  • Climate Monitoring
  • Hydrography
  • Oceanography
  • Others

By End-User:

  • Oil & Gas
  • Military & Defense
  • Homeland Security
  • Scientific Research & Development
  • Marine

By Region:

  • North America
  • Europe
  • Asia Pacific
  • RoW

Recent Developments in Underwater Acoustic Communication Industry

  • In August 2022, KONGSBERG Marine has launched EcoAdvisor, which monitors the vessel operations and its environment, including power generation, propulsion, environmental forces, and control system dynamics. EcoAdvisor enables operators to reduce fuel, emissions, and maintenance costs without compromising vessel redundancy margins or operational efficiency.
  • In July 2022, Teledyne Technologies acquired NL Acoustics (Finland), an advanced acoustics-based predictive maintenance solution provider. NL Acoustics specializes in advanced acoustic imaging instruments. The company’s easy-to-use acoustic cameras are designed and manufactured in Finland and used for predictive maintenance, such as locating faults, making production processes more efficient, and saving energy and costs.
  • In March 2022, Sonardyne launched Deck Topside, which can acoustically test, load, interrogate and activate the acoustic release transponders, as well as initiation transponder 6 (IT 6)

Frequently Asked Questions (FAQ):

To speak to our analyst for a discussion on the above findings, click Speak to Analyst

Exclusive indicates content/data unique to MarketsandMarkets and not available with any competitors.

TABLE OF CONTENTS
 
1 INTRODUCTION (Page No. - 27)
    1.1 STUDY OBJECTIVES 
    1.2 MARKET DEFINITION 
    1.3 STUDY SCOPE 
           1.3.1 MARKETS COVERED
                    FIGURE 1 UNDERWATER ACOUSTIC COMMUNICATION MARKET: SEGMENTATION
           1.3.2 REGIONAL ANALYSIS
           1.3.3 YEARS CONSIDERED
           1.3.4 INCLUSIONS AND EXCLUSIONS
    1.4 CURRENCY CONSIDERED 
    1.5 LIMITATIONS 
    1.6 STAKEHOLDERS 
    1.7 SUMMARY OF CHANGES 
 
2 RESEARCH METHODOLOGY (Page No. - 32)
    2.1 RESEARCH DATA 
           FIGURE 2 RESEARCH DESIGN
           2.1.1 SECONDARY AND PRIMARY RESEARCH
           2.1.2 SECONDARY DATA
                    2.1.2.1 Secondary sources
           2.1.3 PRIMARY DATA
                    2.1.3.1 Key data from primary sources
                    2.1.3.2 Key industry insights
                    2.1.3.3 Breakdown of primaries
    2.2 MARKET SIZE ESTIMATION 
           FIGURE 3 PROCESS FLOW OF MARKET SIZE ESTIMATION
           2.2.1 BOTTOM-UP APPROACH
                    FIGURE 4 MARKET SIZE ESTIMATION: BOTTOM-UP APPROACH
           2.2.2 TOP-DOWN APPROACH
                    2.2.2.1 Approach to derive market size using supply-side analysis
                               FIGURE 5 MARKET SIZE ESTIMATION: TOP-DOWN APPROACH
    2.3 MARKET BREAKDOWN AND DATA TRIANGULATION 
           FIGURE 6 DATA TRIANGULATION
    2.4 RESEARCH ASSUMPTIONS 
           2.4.1 LIMITATIONS
 
3 EXECUTIVE SUMMARY (Page No. - 40)
    FIGURE 7 ACOUSTIC MODEM SEGMENT TO HOLD LARGEST SHARE OF UNDERWATER ACOUSTIC COMMUNICATION MARKET DURING FORECAST PERIOD
    FIGURE 8 MEDIUM WATER SEGMENT TO HOLD LARGEST SHARE OF MARKET DURING FORECAST PERIOD
    FIGURE 9 ENVIRONMENTAL MONITORING SEGMENT TO HOLD LARGEST SHARE OF MARKET IN 2023
    FIGURE 10 SCIENTIFIC RESEARCH & DEVELOPMENT SEGMENT TO HOLD LARGEST SHARE OF MARKET DURING FORECAST PERIOD
    FIGURE 11 ASIA PACIFIC MARKET TO REGISTER HIGHEST CAGR DURING FORECAST PERIOD
 
4 PREMIUM INSIGHTS (Page No. - 44)
    4.1 ATTRACTIVE OPPORTUNITIES FOR PLAYERS OPERATING IN UNDERWATER ACOUSTIC COMMUNICATION MARKET 
           FIGURE 12 GROWING NEED FOR ENVIRONMENTAL MONITORING AND SEA FLOOR MAPPING
    4.2 MARKET, BY INTERFACE PLATFORM 
           FIGURE 13 ACOUSTIC MODEM SEGMENT TO DOMINATE MARKET BETWEEN 2023 AND 2028
    4.3 MARKET, BY COMMUNICATION DEPTH 
           FIGURE 14 MEDIUM WATER SEGMENT TO DOMINATE MARKET BETWEEN 2023 AND 2028
    4.4 MARKET, BY APPLICATION 
           FIGURE 15 ENVIRONMENTAL MONITORING SEGMENT TO LEAD MARKET BETWEEN 2023 AND 2028
    4.5 ASIA PACIFIC MARKET, BY END USER AND COUNTRY 
           FIGURE 16 SCIENTIFIC RESEARCH & DEVELOPMENT SEGMENT AND CHINA TO HOLD LARGEST SHARES OF ASIA PACIFIC MARKET IN 2028
    4.6 MARKET, BY COUNTRY 
           FIGURE 17 INDIA TO REGISTER HIGHEST CAGR IN MARKET BETWEEN 2023 AND 2028
 
5 MARKET OVERVIEW (Page No. - 48)
    5.1 INTRODUCTION 
    5.2 MARKET DYNAMICS 
           FIGURE 18 UNDERWATER ACOUSTIC COMMUNICATION MARKET: DRIVERS, RESTRAINTS, OPPORTUNITIES, AND CHALLENGES
           5.2.1 DRIVERS
                    FIGURE 19 ANALYSIS OF IMPACT OF DRIVERS ON MARKET
                    5.2.1.1 Increasing adoption of underwater acoustic modems in oil & gas industry
                    5.2.1.2 Growing need for reliable and secure communication in defense and homeland security sectors
                    5.2.1.3 Rising deployment of acoustic navigation for underwater positioning
           5.2.2 RESTRAINTS
                    FIGURE 20 ANALYSIS OF IMPACT OF RESTRAINTS ON UNDERWATER ACOUSTIC COMMUNICATION MARKET
                    5.2.2.1 Limited speed of data transmission and delayed delivery rates in underwater communication
           5.2.3 OPPORTUNITIES
                    FIGURE 21 ANALYSIS OF IMPACT OF OPPORTUNITIES ON MARKET
                    5.2.3.1 Use of 5G network for underwater communication
                    5.2.3.2 Growing demand for environmental monitoring and seafloor mapping
           5.2.4 CHALLENGES
                    FIGURE 22 ANALYSIS OF IMPACT OF CHALLENGES ON MARKET
                    5.2.4.1 Bandwidth limitation associated with underwater acoustic communication
                    5.2.4.2 Security threat in underwater communication
    5.3 SUPPLY CHAIN ANALYSIS 
           FIGURE 23 SUPPLY CHAIN ANALYSIS: MAJOR VALUE ADDED BY ORIGINAL EQUIPMENT MANUFACTURERS
    5.4 ECOSYSTEM ANALYSIS 
           FIGURE 24 MARKET: ECOSYSTEM ANALYSIS
    5.5 YC-YCC SHIFT: MARKET 
           FIGURE 25 YC-YCC SHIFT: MARKET
    5.6 AVERAGE SELLING PRICE OF UNDERWATER ACOUSTIC COMMUNICATION PRODUCTS OFFERED BY KEY PLAYERS 
           FIGURE 26 AVERAGE SELLING PRICE OF UNDERWATER ACOUSTIC COMMUNICATION PRODUCTS OFFERED BY KEY PLAYERS
           5.6.1 AVERAGE SELLING PRICE TREND ANALYSIS
                    TABLE 1 AVERAGE SELLING PRICE OF UNDERWATER ACOUSTIC COMMUNICATION PRODUCTS, BY INTERFACE PLATFORM, 2019–2022 (USD)
    5.7 TECHNOLOGY ANALYSIS 
           5.7.1 INTERNET OF UNDERWATER THINGS (IOUT)
    5.8 PORTER’S FIVE FORCES ANALYSIS 
           TABLE 2 UNDERWATER ACOUSTIC COMMUNICATION MARKET: PORTER’S FIVE FORCES ANALYSIS
           5.8.1 INTENSITY OF COMPETITIVE RIVALRY
           5.8.2 THREAT OF SUBSTITUTES
           5.8.3 BARGAINING POWER OF BUYERS
           5.8.4 BARGAINING POWER OF SUPPLIERS
           5.8.5 THREAT OF NEW ENTRANTS
    5.9 KEY STAKEHOLDERS AND BUYING CRITERIA 
           5.9.1 KEY STAKEHOLDERS IN BUYING PROCESS
                    FIGURE 27 INFLUENCE OF STAKEHOLDERS ON BUYING PROCESS FOR TOP THREE APPLICATIONS
                    TABLE 3 INFLUENCE OF STAKEHOLDERS ON BUYING PROCESS FOR TOP THREE APPLICATIONS (%)
           5.9.2 BUYING CRITERIA
                    FIGURE 28 KEY BUYING CRITERIA FOR TOP THREE APPLICATIONS
                    TABLE 4 KEY BUYING CRITERIA FOR TOP THREE APPLICATIONS
    5.10 CASE STUDY ANALYSIS 
           TABLE 5 ACOUSTIC DOPPLER CURRENT PROFILER (ADCP)-BASED MONITORING SYSTEMS AID OPERATIONS IN DARWIN HARBOUR
           TABLE 6 INNOVASEA’S VR2W SOLUTIONS FACILITATE COST-EFFICIENT FISH TRACKING
    5.11 TRADE ANALYSIS 
           TABLE 7 IMPORT DATA OF BASE STATIONS OF APPARATUS FOR TRANSMISSION OR RECEPTION OF VOICE, IMAGES, OR OTHER DATA, BY COUNTRY, 2017–2021 (USD MILLION)
           TABLE 8 EXPORT DATA OF BASE STATIONS OF APPARATUS FOR TRANSMISSION OR RECEPTION OF VOICE, IMAGES, OR OTHER DATA, BY COUNTRY, 2017–2021 (USD MILLION)
    5.12 PATENT ANALYSIS 
           FIGURE 29 TOP 10 COMPANIES WITH HIGHEST NUMBER OF PATENT APPLICATIONS IN LAST 10 YEARS
           TABLE 9 NUMBER OF PATENTS REGISTERED RELATED TO UNDERWATER ACOUSTIC COMMUNICATION MARKET IN LAST 10 YEARS
           FIGURE 30 NUMBER OF PATENTS GRANTED PER YEAR, 2011–2021
           TABLE 10 NOTABLE PATENTS RELATED TO MARKET
    5.13 KEY CONFERENCES AND EVENTS, 2023–2024 
           TABLE 11 MARKET: DETAILED LIST OF CONFERENCES AND EVENTS
    5.14 TARIFF ANALYSIS 
           TABLE 12 TARIFF FOR HS CODE 851761 EXPORTED BY CHINA (2021)
           5.14.1 STANDARDS AND REGULATORY LANDSCAPE
                    5.14.1.1 Regulatory bodies, government agencies, and other organizations
                                TABLE 13 NORTH AMERICA: LIST OF REGULATORY BODIES, GOVERNMENT AGENCIES, AND OTHER ORGANIZATIONS
                                TABLE 14 EUROPE: LIST OF REGULATORY BODIES, GOVERNMENT AGENCIES, AND OTHER ORGANIZATIONS
           5.14.2 REGULATORY ANALYSIS
 
6 UNDERWATER ACOUSTIC COMMUNICATION MARKET, BY INTERFACE PLATFORM (Page No. - 75)
    6.1 INTRODUCTION 
           FIGURE 31 ACOUSTIC MODEM SEGMENT TO HOLD LARGEST MARKET SHARE DURING FORECAST PERIOD
           TABLE 15 MARKET, BY INTERFACE PLATFORM, 2019–2022 (USD MILLION)
           TABLE 16 MARKET, BY INTERFACE PLATFORM, 2023–2028 (USD MILLION)
           TABLE 17 MARKET, BY INTERFACE PLATFORM, 2019–2022 (THOUSAND UNITS)
           TABLE 18 MARKET, BY INTERFACE PLATFORM, 2023–2028 (THOUSAND UNITS)
    6.2 SENSOR INTERFACE 
           6.2.1 INCREASING ADOPTION OF UNDERWATER SENSORS IN ENVIRONMENTAL MONITORING
                    TABLE 19 SENSOR INTERFACE: MARKET, BY COMMUNICATION DEPTH, 2019–2022 (USD MILLION)
                    TABLE 20 SENSOR INTERFACE: MARKET, BY COMMUNICATION DEPTH, 2023–2028 (USD MILLION)
    6.3 ACOUSTIC MODEM 
           6.3.1 RISING USE OF ACOUSTIC MODEMS TO TRANSFER INFORMATION COST-EFFECTIVELY
                    TABLE 21 ACOUSTIC MODEM: MARKET, BY COMMUNICATION DEPTH, 2019–2022 (USD MILLION)
                    TABLE 22 ACOUSTIC MODEM: MARKET, BY COMMUNICATION DEPTH, 2023–2028 (USD MILLION)
                    TABLE 23 ACOUSTIC MODEM: MARKET, BY OFFERING, 2019–2022 (USD MILLION)
                    TABLE 24 ACOUSTIC MODEM:  MARKET, BY OFFERING, 2023–2028 (USD MILLION)
           6.3.2 HARDWARE
                    6.3.2.1 Hardware acoustic modems have operating range of up to few kilometers
           6.3.3 SOFTWARE
                    6.3.3.1 Coupling software acoustic modems reduce per node cost of acoustic communication
    6.4 OTHERS 
           TABLE 25 OTHERS: MARKET, BY COMMUNICATION DEPTH, 2019–2022 (USD MILLION)
           TABLE 26 OTHERS:  MARKET, BY COMMUNICATION RANGE, 2023–2028 (USD MILLION)
 
7 UNDERWATER ACOUSTIC COMMUNICATION MARKET, BY COMMUNICATION DEPTH (Page No. - 83)
    7.1 INTRODUCTION 
           FIGURE 32 MEDIUM WATER SEGMENT TO REGISTER HIGHEST CAGR IN UNDERWATER ACOUSTIC COMMUNICATION DURING FORECAST PERIOD
           TABLE 27 MARKET, BY COMMUNICATION DEPTH, 2019–2022 (USD MILLION)
           TABLE 28 MARKET, BY COMMUNICATION DEPTH, 2023–2028 (USD MILLION)
    7.2 SHALLOW WATER 
           7.2.1 GROWING ENVIRONMENTAL MONITORING IN SHALLOW WATERS
                    TABLE 29 SHALLOW WATER: MARKET, BY APPLICATION, 2019–2022 (USD MILLION)
                    TABLE 30 SHALLOW WATER: UNDERWATER ACOUSTIC COMMUNICATION MARKET, BY APPLICATION, 2023–2028 (USD MILLION)
    7.3 MEDIUM WATER 
           7.3.1 GROWING USE OF ENVIRONMENTAL MONITORING SYSTEMS IN OIL & GAS INDUSTRY TO DETECT PIPE LEAKAGE IN MEDIUM WATER RANGE
                    TABLE 31 MEDIUM WATER:  MARKET, BY APPLICATION, 2019–2022 (USD MILLION)
                    TABLE 32 MEDIUM WATER: MARKET, BY APPLICATION, 2023–2028 (USD MILLION)
    7.4 LONG WATER 
           7.4.1 GROWING USE OF UNDERWATER ACOUSTIC COMMUNICATION TO CONDUCT TELEMETRY IN ICE-COVERED REGIONS
                    TABLE 33 LONG WATER: MARKET, BY APPLICATION, 2019–2022 (USD MILLION)
                    TABLE 34 LONG WATER: MARKET, BY APPLICATION, 2023–2028 (USD MILLION)
    7.5 FULL OCEAN 
           7.5.1 INCREASING USE OF ACOUSTIC SIGNALS FOR EXPLORATION OF NATURAL RESOURCES
                    TABLE 35 FULL OCEAN: MARKET, BY APPLICATION, 2019–2022 (USD MILLION)
                    TABLE 36 FULL OCEAN: MARKET, BY APPLICATION, 2023–2028 (USD MILLION)
 
8 UNDERWATER ACOUSTIC COMMUNICATION, BY OPERATING RANGE (Page No. - 90)
    8.1 INTRODUCTION 
    8.2 SHORT RANGE 
    8.3 MEDIUM RANGE 
    8.4 LONG RANGE 
           TABLE 37 LIST OF FEW COMPANIES WITH PRODUCT OFFERINGS, BY OPERATING RANGE
 
9 UNDERWATER ACOUSTIC COMMUNICATION MARKET, BY APPLICATION (Page No. - 92)
    9.1 INTRODUCTION 
           FIGURE 33 ENVIRONMENTAL MONITORING SEGMENT TO REGISTER HIGHEST CAGR BETWEEN 2023 AND 2028
           TABLE 38 MARKET, BY APPLICATION, 2019–2022 (USD MILLION)
           TABLE 39 MARKET, BY APPLICATION, 2023–2028 (USD MILLION)
    9.2 ENVIRONMENTAL MONITORING 
           9.2.1 UNDERWATER ACOUSTIC COMMUNICATION SYSTEMS HELP GOVERNMENTS IN ENVIRONMENTAL MONITORING
                    TABLE 40 ENVIRONMENTAL MONITORING: MARKET, BY END USER, 2019–2022 (USD MILLION)
                    TABLE 41 ENVIRONMENTAL MONITORING: MARKET, BY END USER, 2023–2028 (USD MILLION)
                    TABLE 42 ENVIRONMENTAL MONITORING: MARKET, BY COMMUNICATION DEPTH, 2019–2022 (USD MILLION)
                    TABLE 43 ENVIRONMENTAL MONITORING: UNDERWATER ACOUSTIC COMMUNICATION MARKET, BY COMMUNICATION DEPTH, 2023–2028 (USD MILLION)
                    TABLE 44 ENVIRONMENTAL MONITORING: MARKET, BY REGION, 2019–2022 (USD MILLION)
                    TABLE 45 ENVIRONMENTAL MONITORING: MARKET, BY REGION, 2023–2028 (USD MILLION)
    9.3 POLLUTION MONITORING 
           9.3.1 GROWING USE OF UNDERWATER ACOUSTIC COMMUNICATION SYSTEMS TO MONITOR POLLUTION CAUSED BY OIL SPILLS
                    TABLE 46 POLLUTION MONITORING: MARKET, BY END USER, 2019–2022 (USD MILLION)
                    TABLE 47 POLLUTION MONITORING: MARKET, BY END USER, 2023–2028 (USD MILLION)
                    TABLE 48 POLLUTION MONITORING:  MARKET, BY COMMUNICATION DEPTH, 2019–2022 (USD MILLION)
                    TABLE 49 POLLUTION MONITORING: MARKET, BY COMMUNICATION DEPTH, 2023–2028 (USD MILLION)
                    TABLE 50 POLLUTION MONITORING: MARKET, BY REGION, 2019–2022 (USD MILLION)
                    TABLE 51 POLLUTION MONITORING: MARKET, BY REGION, 2023–2028 (USD MILLION)
    9.4 CLIMATE MONITORING 
           9.4.1 GROWING NEED FOR CLIMATE MONITORING WITH RISE IN GLOBAL WARMING
                    TABLE 52 CLIMATE MONITORING: MARKET, BY END USER, 2019–2022 (USD MILLION)
                    TABLE 53 CLIMATE MONITORING: MARKET, BY END USER, 2023–2028 (USD MILLION)
                    TABLE 54 CLIMATE MONITORING: UNDERWATER ACOUSTIC COMMUNICATION MARKET, BY COMMUNICATION DEPTH, 2019–2022 (USD MILLION)
                    TABLE 55 CLIMATE MONITORING: MARKET, BY COMMUNICATION DEPTH, 2023–2028 (USD MILLION)
                    TABLE 56 CLIMATE MONITORING: MARKET, BY REGION, 2019–2022 (USD MILLION)
                    TABLE 57 CLIMATE MONITORING: MARKET, BY REGION, 2023–2028 (USD MILLION)
    9.5 HYDROGRAPHY 
           9.5.1 INCREASED RESEARCH RELATED TO OCEAN MAPPING AND SEABED NAVIGATION
                    TABLE 58 HYDROGRAPHY: MARKET, BY END USER, 2019–2022 (USD MILLION)
                    TABLE 59 HYDROGRAPHY: MARKET, BY END USER, 2023–2028 (USD MILLION)
                    TABLE 60 HYDROGRAPHY: MARKET, BY COMMUNICATION DEPTH, 2019–2022 (USD MILLION)
                    TABLE 61 HYDROGRAPHY:  MARKET, BY COMMUNICATION DEPTH, 2023–2028 (USD MILLION)
                    TABLE 62 HYDROGRAPHY: MARKET, BY REGION, 2019–2022 (USD MILLION)
                    TABLE 63 HYDROGRAPHY: UNDERWATER ACOUSTIC COMMUNICATION MARKET, BY REGION, 2023–2028 (USD MILLION)
    9.6 OCEANOGRAPHY 
           9.6.1 EXTENSIVE USE OF OCEANOGRAPHY FOR SCIENTIFIC RESEARCH AND DEVELOPMENT
                    TABLE 64 OCEANOGRAPHY: MARKET, BY END USER, 2019–2022 (USD MILLION)
                    TABLE 65 OCEANOGRAPHY: MARKET, BY END USER, 2023–2028 (USD MILLION)
                    TABLE 66 OCEANOGRAPHY: MARKET, BY COMMUNICATION DEPTH, 2019–2022 (USD MILLION)
                    TABLE 67 OCEANOGRAPHY: MARKET, BY COMMUNICATION DEPTH, 2023–2028 (USD MILLION)
                    TABLE 68 OCEANOGRAPHY: MARKET, BY REGION, 2019–2022 (USD MILLION)
                    TABLE 69 OCEANOGRAPHY: MARKET, BY REGION, 2023–2028 (USD MILLION)
    9.7 OTHERS 
           TABLE 70 OTHERS: MARKET, BY END USER, 2019–2022 (USD MILLION)
           TABLE 71 OTHERS: MARKET, BY END USER, 2023–2028 (USD MILLION)
           TABLE 72 OTHERS: MARKET, BY COMMUNICATION DEPTH, 2019–2022 (USD MILLION)
           TABLE 73 OTHERS: MARKET, BY COMMUNICATION DEPTH, 2023–2028 (USD MILLION)
           TABLE 74 OTHERS: MARKET, BY REGION, 2019–2022 (USD MILLION)
           TABLE 75 OTHERS: MARKET, BY REGION, 2023–2028 (USD MILLION)
 
10 UNDERWATER ACOUSTIC COMMUNICATION MARKET, BY END USER (Page No. - 109)
     10.1 INTRODUCTION 
             FIGURE 34 OIL & GAS SEGMENT TO REGISTER HIGHEST CAGR IN MARKET DURING FORECAST PERIOD
             TABLE 76 MARKET, BY END USER, 2019–2022 (USD MILLION)
             TABLE 77 UNDERWATER ACOUSTIC COMMUNICATION MARKET, BY END USER, 2023–2028 (USD MILLION)
     10.2 OIL & GAS 
             10.2.1 GROWING NEED FOR RELIABLE COMMUNICATION IN OIL & GAS INDUSTRY
                        TABLE 78 OIL & GAS: MARKET, BY APPLICATION, 2019–2022 (USD MILLION)
                        TABLE 79 OIL & GAS: MARKET, BY APPLICATION, 2023–2028 (USD MILLION)
                        TABLE 80 OIL & GAS: MARKET, BY REGION, 2019–2022 (USD MILLION)
                        TABLE 81 OIL & GAS: MARKET, BY REGION, 2023–2028 (USD MILLION)
     10.3 MILITARY & DEFENSE 
             10.3.1 INCREASED SPENDING ON DEFENSE SECTOR
                        TABLE 82 MILITARY & DEFENSE: MARKET, BY APPLICATION, 2019–2022 (USD MILLION)
                        TABLE 83 MILITARY & DEFENSE: MARKET, BY APPLICATION, 2023–2028 (USD MILLION)
                        TABLE 84 MILITARY & DEFENSE: MARKET, BY REGION, 2019–2022 (USD MILLION)
                        TABLE 85 MILITARY & DEFENSE: MARKET, BY REGION, 2023–2028 (USD MILLION)
     10.4 HOMELAND SECURITY 
             10.4.1 INCREASED DEPLOYMENT OF UNDERWATER ACOUSTIC SENSORS IN DEFENSE SYSTEMS OF CRITICAL INFRASTRUCTURES
                        TABLE 86 HOMELAND SECURITY: MARKET, BY APPLICATION, 2019–2022 (USD MILLION)
                        TABLE 87 HOMELAND SECURITY: MARKET, BY APPLICATION, 2023–2028 (USD MILLION)
                        FIGURE 35 ASIA PACIFIC TO REGISTER HIGHEST CAGR IN UNDERWATER ACOUSTIC COMMUNICATION MARKET FOR HOMELAND SECURITY SEGMENT DURING FORECAST PERIOD
                        TABLE 88 HOMELAND SECURITY: MARKET, BY REGION, 2019–2022 (USD MILLION)
                        TABLE 89 HOMELAND SECURITY: MARKET, BY REGION, 2023–2028 (USD MILLION)
     10.5 SCIENTIFIC RESEARCH & DEVELOPMENT 
             10.5.1 GROWING USE OF SEA EXPLORATION AND OCEAN MAPPING SYSTEMS IN SCIENTIFIC RESEARCH AND DEVELOPMENT FOR UNDERWATER ACOUSTIC COMMUNICATION
                        TABLE 90 SCIENTIFIC RESEARCH & DEVELOPMENT: MARKET, BY APPLICATION, 2019–2022 (USD MILLION)
                        TABLE 91 SCIENTIFIC RESEARCH & DEVELOPMENT: MARKET, BY APPLICATION, 2023–2028 (USD MILLION)
                        TABLE 92 SCIENTIFIC RESEARCH & DEVELOPMENT: MARKET, BY REGION, 2019–2022 (USD MILLION)
                        TABLE 93 SCIENTIFIC RESEARCH & DEVELOPMENT: MARKET, BY REGION, 2023–2028 (USD MILLION)
     10.6 MARINE 
             10.6.1 RISING NEED FOR UNDERWATER ACOUSTIC COMMUNICATION IN MARINE CONSERVATION
                        FIGURE 36 POLLUTION MONITORING SEGMENT TO REGISTER HIGHEST CAGR IN  MARKET FOR MARINE SEGMENT DURING FORECAST PERIOD
                        TABLE 94 MARINE: UNDERWATER ACOUSTIC COMMUNICATION MARKET, BY APPLICATION, 2019–2022 (USD MILLION)
                        TABLE 95 MARINE: MARKET, BY APPLICATION, 2023–2028 (USD MILLION)
                        TABLE 96 MARINE: MARKET, BY REGION, 2019–2022 (USD MILLION)
                        TABLE 97 MARINE:MARKET, BY REGION, 2023–2028 (USD MILLION)
 
11 UNDERWATER ACOUSTIC COMMUNICATION MARKET, BY REGION (Page No. - 123)
     11.1 INTRODUCTION 
             FIGURE 37 ASIA PACIFIC TO REGISTER HIGHEST CAGR IN MARKET DURING FORECAST PERIOD
             TABLE 98 MARKET, BY REGION, 2019–2022 (USD MILLION)
             TABLE 99 MARKET, BY REGION, 2023–2028 (USD MILLION)
     11.2 NORTH AMERICA 
             FIGURE 38 NORTH AMERICA: SNAPSHOT OF MARKET
             TABLE 100 NORTH AMERICA: MARKET, BY APPLICATION, 2019–2022 (USD MILLION)
             TABLE 101 NORTH AMERICA: MARKET, BY APPLICATION, 2023–2028 (USD MILLION)
             TABLE 102 NORTH AMERICA: UNDERWATER ACOUSTIC COMMUNICATION MARKET, BY END USER, 2019–2022 (USD MILLION)
             TABLE 103 NORTH AMERICA: MARKET, BY END USER, 2023–2028 (USD MILLION)
             TABLE 104 NORTH AMERICA: MARKET, BY COUNTRY, 2019–2022 (USD MILLION)
             TABLE 105 NORTH AMERICA:  MARKET, BY COUNTRY, 2023–2028 (USD MILLION)
             11.2.1 US
                        11.2.1.1 Increasing offshore activities and spending by US Navy
                                
                        11.2.2.1 Expanding oil & gas industry
             11.2.3 MEXICO
                        11.2.3.1 Growing adoption of autonomous underwater vehicles (AUVs)
     11.3 EUROPE 
             FIGURE 39 EUROPE: SNAPSHOT OF UNDERWATER ACOUSTIC COMMUNICATION MARKET
             TABLE 106 EUROPE: MARKET, BY APPLICATION, 2019–2022 (USD MILLION)
             TABLE 107 EUROPE: MARKET, BY APPLICATION, 2023–2028 (USD MILLION)
             TABLE 108 EUROPE: MARKET, BY END USER, 2019–2022 (USD MILLION)
             TABLE 109 EUROPE: MARKET, BY END USER, 2023–2028 (USD MILLION)
             TABLE 110 EUROPE: MARKET, BY COUNTRY, 2019–2022 (USD MILLION)
             TABLE 111 EUROPE: MARKET, BY COUNTRY, 2023–2028 (USD MILLION)
             11.3.1 GERMANY
                        11.3.1.1 Increasing use of ROVs in offshore drilling activities
             11.3.2 UK
                        11.3.2.1 Increasing use of UUVs in defense sector to combat maritime threats
             11.3.3 FRANCE
                        11.3.3.1 Increased investments by French Navy in deployment of UUVs
             11.3.4 ITALY
                        11.3.4.1 Rising R&D investments
             11.3.5 SPAIN
                        11.3.5.1 Growing adoption of UUVs to control and monitor sea traffic
             11.3.6 REST OF EUROPE
     11.4 ASIA PACIFIC 
             FIGURE 40 ASIA PACIFIC: SNAPSHOT OF UNDERWATER ACOUSTIC COMMUNICATION MARKET
             TABLE 112 ASIA PACIFIC: MARKET, BY APPLICATION, 2019–2022 (USD MILLION)
             TABLE 113 ASIA PACIFIC: MARKET, BY APPLICATION, 2023–2028 (USD MILLION)
             TABLE 114 ASIA PACIFIC: MARKET, BY END USER, 2019–2022 (USD MILLION)
             TABLE 115 ASIA PACIFIC: MARKET, BY END USER, 2023–2028 (USD MILLION)
             TABLE 116 ASIA PACIFIC: MARKET, BY COUNTRY, 2019–2022 (USD MILLION)
             TABLE 117 ASIA PACIFIC: MARKET, BY COUNTRY, 2023–2028 (USD MILLION)
             11.4.1 CHINA
                        11.4.1.1 Growing adoption of unmanned systems in marine industry
             11.4.2 JAPAN
                        11.4.2.1 Increased border and security concerns
             11.4.3 INDIA
                        11.4.3.1 Increased offshore oil and gas production
             11.4.4 REST OF ASIA PACIFIC
     11.5 ROW 
             TABLE 118 ROW: UNDERWATER ACOUSTIC COMMUNICATION MARKET, BY APPLICATION, 2019–2022 (USD MILLION)
             TABLE 119 ROW: MARKET, BY APPLICATION, 2023–2028 (USD MILLION)
             TABLE 120 ROW: MARKET, BY END USER, 2019–2022 (USD MILLION)
             TABLE 121 ROW: MARKET, BY END USER, 2023–2028 (USD MILLION)
             TABLE 122 ROW: MARKET, BY REGION, 2019-2022 (USD MILLION)
             TABLE 123 ROW: MARKET, BY REGION, 2023–2028 (USD MILLION)
             11.5.1 MIDDLE EAST & AFRICA
                        11.5.1.1 Increased use of underwater acoustic communication in oil & gas industry
             11.5.2 SOUTH AMERICA
                        11.5.2.1 High government-led investments in oil & gas exploration
 
12 COMPETITIVE LANDSCAPE (Page No. - 142)
     12.1 OVERVIEW 
     12.2 STRATEGIES ADOPTED BY KEY PLAYERS/RIGHT TO WIN 
             TABLE 124 OVERVIEW OF STRATEGIES ADOPTED BY KEY PLAYERS IN UNDERWATER ACOUSTIC COMMUNICATION MARKET
     12.3 REVENUE ANALYSIS OF TOP FIVE PLAYERS 
             FIGURE 41 FIVE-YEAR ANNUAL SEGMENTAL REVENUE OF TOP FIVE PLAYERS IN MARKET, 2017–2021
     12.4 MARKET SHARE ANALYSIS OF KEY PLAYERS IN MARKET, 2021 
             FIGURE 42 MARKET SHARE ANALYSIS OF KEY PLAYERS IN MARKET, 2021
             TABLE 125 MARKET: DEGREE OF COMPETITION
             FIGURE 43 MARKET: RANKING ANALYSIS
     12.5 COMPANY EVALUATION QUADRANT, 2021 
             12.5.1 STARS
             12.5.2 EMERGING LEADERS
             12.5.3 PERVASIVE PLAYERS
             12.5.4 PARTICIPANTS
                        FIGURE 44 UNDERWATER ACOUSTIC COMMUNICATION MARKET (GLOBAL): COMPANY EVALUATION QUADRANT, 2021
     12.6 COMPETITIVE BENCHMARKING 
             TABLE 126 COMPANY APPLICATION FOOTPRINT (21 COMPANIES)
             TABLE 127 COMPANY REGIONAL FOOTPRINT (21 COMPANIES)
             TABLE 128 OVERALL COMPANY FOOTPRINT
     12.7 STARTUP/SMALL AND MEDIUM-SIZED ENTERPRISE (SME) EVALUATION QUADRANT, 2021 
             12.7.1 PROGRESSIVE COMPANIES
             12.7.2 RESPONSIVE COMPANIES
             12.7.3 DYNAMIC COMPANIES
             12.7.4 STARTING BLOCKS
                        FIGURE 45 MARKET (GLOBAL): STARTUP/SME EVALUATION QUADRANT, 2021
                        TABLE 129 MARKET: LIST OF KEY STARTUPS/SMES
                        TABLE 130 MARKET: COMPETITIVE BENCHMARKING OF KEY STARTUPS/SMES
     12.8 COMPETITIVE SCENARIO AND TRENDS 
             12.8.1 PRODUCT LAUNCHES
                        TABLE 131 MARKET: PRODUCT LAUNCHES, 2020–2022
             12.8.2 DEALS
                        TABLE 132 MARKET: DEALS, 2020–2022
 
13 COMPANY PROFILES (Page No. - 157)
     13.1 INTRODUCTION 
     13.2 KEY PLAYERS 
(Business Overview, Products Offered, Recent Developments, and MnM View)*  
             13.2.1 TELEDYNE TECHNOLOGIES INCORPORATED
                        TABLE 133 TELEDYNE TECHNOLOGIES INCORPORATED: COMPANY OVERVIEW
                        FIGURE 46 TELEDYNE TECHNOLOGIES INCORPORATED: COMPANY SNAPSHOT
                        TABLE 134 TELEDYNE TECHNOLOGIES INCORPORATED: PRODUCT LAUNCHES
                        TABLE 135 TELEDYNE TECHNOLOGIES INCORPORATED: DEALS
             13.2.2 KONGSBERG
                        TABLE 136 KONGSBERG: COMPANY OVERVIEW
                        FIGURE 47 KONGSBERG: COMPANY SNAPSHOT
                        TABLE 137 KONGSBERG: PRODUCT LAUNCHES
                        TABLE 138 KONGSBERG: DEALS
             13.2.3 THALES
                        TABLE 139 THALES: COMPANY OVERVIEW
                        FIGURE 48 THALES: COMPANY SNAPSHOT
                        TABLE 140 THALES: DEALS
             13.2.4 L3HARRIS TECHNOLOGIES, INC.
                        TABLE 141 L3HARRIS TECHNOLOGIES, INC.: COMPANY OVERVIEW
                        FIGURE 49 L3HARRIS TECHNOLOGIES, INC.: COMPANY SNAPSHOT
             13.2.5 ULTRA
                        TABLE 142 ULTRA: COMPANY OVERVIEW
                        FIGURE 50 ULTRA: COMPANY SNAPSHOT
                        TABLE 143 ULTRA: DEALS
             13.2.6 SONARDYNE INTERNATIONAL
                        TABLE 144 SONARDYNE INTERNATIONAL: COMPANY OVERVIEW
                        TABLE 145 SONARDYNE INTERNATIONAL: PRODUCT LAUNCHES
                        TABLE 146 SONARDYNE INTERNATIONAL: DEALS
             13.2.7 EVOLOGICS GMBH
                        TABLE 147 EVOLOGICS GMBH: COMPANY OVERVIEW
                        TABLE 148 EVOLOGICS GMBH: PRODUCT LAUNCHES
             13.2.8 MOOG, INC.
                        TABLE 149 MOOG, INC.: COMPANY OVERVIEW
                        FIGURE 51 MOOG, INC.: COMPANY SNAPSHOT
             13.2.9 NORTEK
                        TABLE 150 NORTEK: COMPANY OVERVIEW
                        TABLE 151 NORTEK: PRODUCT LAUNCHES
             13.2.10 SHIMADZU CORPORATION
                        TABLE 152 SHIMADZU CORPORATION.: COMPANY OVERVIEW
                        FIGURE 52 SHIMADZU CORPORATION: COMPANY SNAPSHOT
                        TABLE 153 SHIMADZU CORPORATION: PRODUCT LAUNCHES
* Business Overview, Products Offered, Recent Developments, and MnM View might not be captured in case of unlisted companies.  
     13.3 OTHER PLAYERS 
             13.3.1 AQUATIC SENSOR NETWORK TECHNOLOGY
             13.3.2 RTSYS
             13.3.3 THELMA BIOTEL
             13.3.4 HYDROACOUSTIC INC.
             13.3.5 BALTROBOTICS
             13.3.6 LINKQUEST INC.
             13.3.7 DSPCOMM
             13.3.8 JASCO APPLIED SCIENCES
             13.3.9 DRUMGRANGE LTD
             13.3.10 HYDROMEA
             13.3.11 UNDERWATER COMMUNICATIONS & NAVIGATION LABORATORY
             13.3.12 SAAB
             13.3.13 SUBNERO PTE. LTD.
             13.3.14 JPANALYTICS
             13.3.15 DELRESEARCH LLC.
 
14 APPENDIX (Page No. - 193)
     14.1 DISCUSSION GUIDE 
     14.2 KNOWLEDGESTORE: MARKETSANDMARKETS’ SUBSCRIPTION PORTAL 
     14.3 CUSTOMIZATION OPTIONS 
     14.4 RELATED REPORTS 
     14.5 AUTHOR DETAILS 
 

The study involved four major activities in estimating the size of the underwater acoustic communication market. Exhaustive secondary research has been done to collect information on the market, peer market, and parent market. Validation of these findings, assumptions, and sizing with industry experts across the value chain through primary research has been the next step. Both top-down and bottom-up approaches have been employed to estimate the global market size. After that, market breakdown and data triangulation have been used to estimate the market sizes of segments and subsegments.

Secondary Research

Secondary sources that were referred to for this research study include corporate filings (such as annual reports, investor presentations, and financial statements); trade, business, and professional associations; white papers; certified publications; articles from recognized authors; directories; and databases. Secondary data was collected and analyzed to arrive at the overall market size, further validated by primary research.

Primary Research

Extensive primary research was conducted after understanding and analyzing the underwater acoustic communication market scenario through the secondary research process. Several primary interviews were conducted with key opinion leaders from both the demand- and supply-side vendors across four major regions—North America, Asia Pacific, Europe, and RoW (including the Middle East & Africa and South America).

After interacting with industry experts, brief sessions were conducted with highly experienced independent consultants to reinforce the findings from our primaries. This, along with the in-house subject matter experts’ opinions, has led us to the findings as described in the remainder of this report.
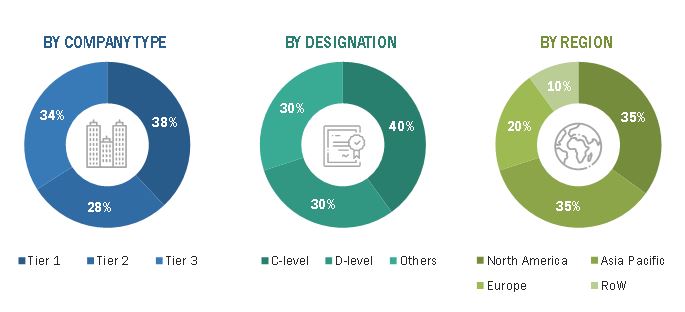
Underwater Acoustic Communication Market Size, and Share

To know about the assumptions considered for the study, download the pdf brochure

Market Size Estimation

Top-down and bottom-up approaches have been used to estimate and validate the overall underwater acoustic communication market size and the various dependent submarkets. The key players involved in the manufacturing of underwater acoustic communication equipment in the market have been identified through secondary research, and their market shares in the respective geographies have been determined through primary and secondary research. The research methodology includes the study of the annual and financial reports of the top market players and extensive interviews for key insights from industry leaders such as CEOs, VPs, directors, and marketing executives.

All the percentage shares, splits, and breakdowns have been determined using secondary sources and verified through primary sources. All possible parameters that affect the markets covered in this research study have been accounted for, viewed in detail, verified through primary research, and analyzed to derive the final quantitative and qualitative data. This data is consolidated and supplemented with detailed inputs and analysis from MarketsandMarkets and presented in this report.

This data was consolidated, supplemented with detailed inputs and analysis from MarketsandMarkets, and presented in this report.

Market Size Estimation Methodology-Bottom-up approach

The bottom-up procedure has been employed to arrive at the overall size of the underwater acoustic communication from the revenue of key players (companies) and their market share.

Underwater Acoustic Communication Market Size, and Share

Data Triangulation

After arriving at the overall market size from the market size estimation process explained in the earlier sections, the total market has been split into several segments and subsegments. The market breakdown and data triangulation procedures have been employed wherever applicable to complete the overall market engineering process and arrive at the exact statistics for all segments and subsegments. The data has been triangulated by studying various factors and trends from both the demand and supply sides. Along with this, the market size has been validated using both top-down and bottom-up approaches.

The main objectives of this study are as follows:

  • To define, describe, segment, and forecast the underwater acoustic communication market in terms of value and based on interface platform, communication depth, application, end user, and operating range (qualitative information)
  • To forecast the underwater acoustic communication market in terms of volume
  • To forecast the market size of the various segments with respect to four main regions: North America, Europe, Asia Pacific, and the Rest of the World (RoW)
  • To provide detailed information regarding the drivers, restraints, opportunities, and challenges influencing the growth of the market
  • To strategically analyze the micromarkets with respect to individual growth trends, prospects, and contributions to the overall market
  • To profile the key players and their core competencies2 and provide the details of the competitive landscape for market leaders
  • To analyze competitive developments such as joint ventures, collaborations, agreements, contracts, partnerships, mergers and acquisitions, product launches, and research and development (R&D) activities in the underwater acoustic communication market

Available Customizations:

MarketsandMarkets offers the following customizations for this market report:

  • Further breakdown of the market in different regions to the country-level
  • Detailed analysis and profiling of additional market players (up to 5)
Custom Market Research Services

We will customize the research for you, in case the report listed above does not meet with your exact requirements. Our custom research will comprehensively cover the business information you require to help you arrive at strategic and profitable business decisions.

Request Customization

Instant Answers with GPT - Ask Now!

Ask real questions. Get complete answers !
Report Code
SE 5910
Published ON
Dec, 2022
Choose License Type
BUY NOW
  • SHARE
X
Request Customization
Speak to Analyst
Speak to Analyst
OR FACE-TO-FACE MEETING
PERSONALIZE THIS RESEARCH
  • Triangulate with your Own Data
  • Get Data as per your Format and Definition
  • Gain a Deeper Dive on a Specific Application, Geography, Customer or Competitor
  • Any level of Personalization
REQUEST A FREE CUSTOMIZATION
LET US HELP YOU!
  • What are the Known and Unknown Adjacencies Impacting the Underwater Acoustic Communication Market
  • What will your New Revenue Sources be?
  • Who will be your Top Customer; what will make them switch?
  • Defend your Market Share or Win Competitors
  • Get a Scorecard for Target Partners
CUSTOMIZED WORKSHOP REQUEST
knowledgestore logo

Want to explore hidden markets that can drive new revenue in Underwater Acoustic Communication Market?

Find Hidden Markets
  • Call Us
  • +1-888-600-6441 (Corporate office hours)
  • +1-888-600-6441 (US/Can toll free)
  • +44-800-368-9399 (UK office hours)
CONNECT WITH US
ABOUT TRUST ONLINE
©2024 MarketsandMarkets Research Private Ltd. All rights reserved
DMCA.com Protection Status
Website Feedback