Synchronous Generator Market

Synchronous Generator Market by Prime Mover (Steam turbine, Gas turbines), Speed ( 1,500 RPM, 3,000 RPM), Power Rating (2-5 MVA, 5-10 MVA, 10-20 MVA, 20-30 MVA, & 30-50 MVA), End User (Renewable Power Generation) & Region - Global Forecast to 2028

Report Code: EP 8667 May, 2023, by marketsandmarkets.com

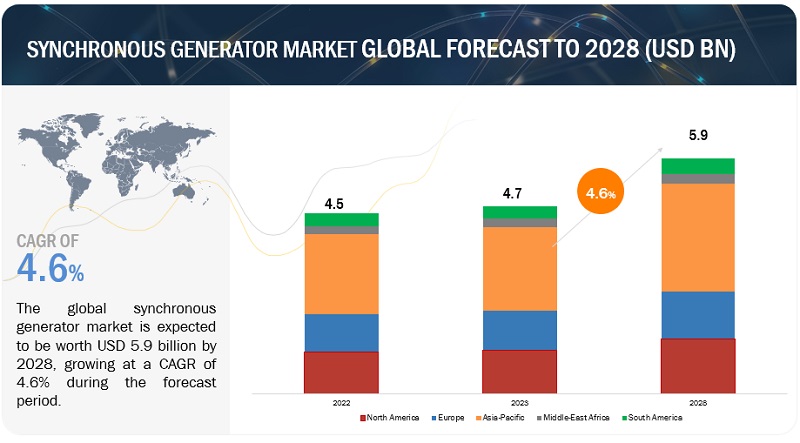
[200 Pages Report] The synchronous generator market is expected to grow from an estimated USD 4.7 billion in 2023 to USD 5.9 billion by 2028, at a CAGR of 4.6% during the forecast period. The growing demand for electricity, driven by industrialization, urbanization, and population growth, has led to a significant increase in power generation capacity worldwide. The need for reliable backup power solutions has increased due to the rising frequency of power outages caused by natural disasters, grid failures, and other unforeseen events. Synchronous generators play a vital role in power plants, including thermal, hydro, and nuclear, where they are used to convert mechanical energy into electrical energy. They often used as backup power sources in critical facilities like hospitals, data centers, telecommunications networks, and residential complexes.
Synchronous Generator Market

To know about the assumptions considered for the study, Request for Free Sample Report
Synchronous Generator Market

To know about the assumptions considered for the study, download the pdf brochure

Synchronous Generator market Dynamics

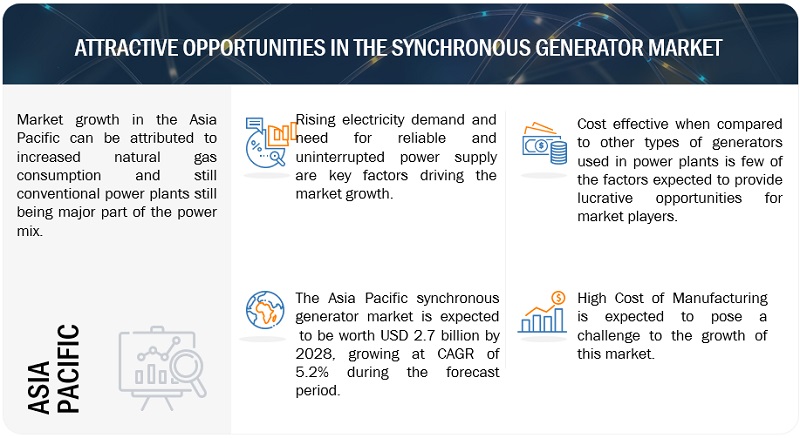
Driver: Rising electricity Demand

Synchronous generators are critical in power generation infrastructure, providing efficient and reliable power generation across various applications, including steam and gas turbines. One of the key factors driving the growth of the synchronous generator market is the rising demand for electricity, particularly in developing economies. As these economies continue to grow and urbanize, there is a corresponding increase in demand for electricity to power homes, businesses, and industries. The synchronous generator is an essential component of the power generation infrastructure and is commonly used in industrial and commercial settings to provide reliable and efficient power

Restraint: Environmental concerns associated with synchronous generators

Synchronous generators can have significant environmental impacts related to carbon emissions and noise pollution. Synchronous generators are often powered by fossil fuels, such as coal or natural gas, which release carbon dioxide and other greenhouse gases into the atmosphere when burned. These emissions contribute to global climate change and air pollution, which can negatively impact human health and the environment. The amount of carbon emissions produced by synchronous generators depends on the type of fuel used and the generator’s efficiency. The operation of synchronous generators can produce high noise pollution levels, which can adversely affect human health and the environment. The noise generated by synchronous generators can be particularly problematic in urban areas with high noise pollution levels. The noise produced by synchronous generators can cause hearing damage and sleep disturbances for humans and disrupt local ecosystems and wildlife. Additionally, noise pollution can negatively impact property values and community well-being.

Opportunity: Cost-effectiveness associated with synchronous generators compared with other generator types used in thermal power plants

A synchronous generator is a cost-effective option compared with other types of generators. This is due to its longer life span and minimal maintenance requirements, which result in a lower total cost of ownership over the long term. Compared to other generators, synchronous generators are designed to last longer, which can reduce the overall cost of owning a generator. This is because the components used in synchronous generators are built to withstand high temperatures and pressures, which are common in thermal power plants. As a result, synchronous generators require less frequent maintenance and are less likely to break down, which can lead to costly repairs and downtime. Additionally, synchronous generators are designed with simplicity in mind, reducing the likelihood of wear and tear over time. This simplicity also makes them easier to repair and maintain, saving time and money in the long run

Challenge: High manufacturing cost

Synchronous generators can have a higher manufacturing cost than other types of generators due to the complexity of their design and the materials used in their construction. The manufacturing cost of synchronous generators can vary depending on factors such as the generator’s size, materials used, and manufacturing process. Generally, the cost of manufacturing a synchronous generator is relatively high compared to other types of generators due to the complexity of its design and the materials required for construction. The cost of materials, such as copper wire and steel laminations, can also impact the overall manufacturing cost. Moreover, the labor, energy, and equipment cost in the manufacturing process also contributes to the total manufacturing cost.

Synchronous Generator Market Ecosystem

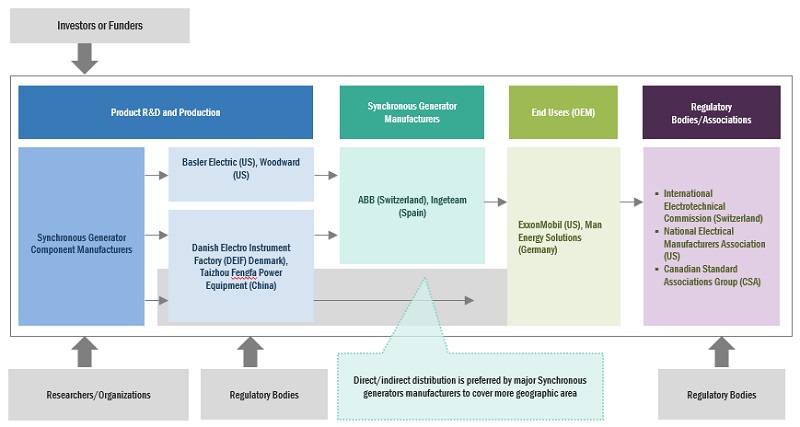
Prominent companies in this market include well-established, financially stable manufacturers of Synchronous Generator Market and components. These companies have been operating in the market for several years and possess a diversified product portfolio, state-of-the-art technologies, and strong global sales and marketing networks. Prominent companies in this market include ABB (Switzerland), WEG (Brazil), Siemens Energy (Germany), Meidensha Corporation (Japan),  and Andritz (Austria).
Synchronous Generator Market Size, and Share

The Others segment by  prime mover holds the largest segment in 2022

Others include wind turbine, hydro turbine, and diesel driven. Hydro turbines, wind turbines, and diesel-driven synchronous generators are essential devices that convert distinct forms of energy into electrical energy. Hydro turbines harness the power of flowing water to generate electricity, while wind turbines capture the wind’s kinetic energy. On the other hand, diesel-driven synchronous generators rely on the combustion of diesel fuel to produce electrical power. These technologies are pivotal in generating clean and sustainable electricity, catering to various energy requirements in various sectors.

3,000 RPM segment by speed is estimated to be the second fastest segment for synchronous generator market

Operating at a higher speed of 3,000 RPM allows for a more compact and lightweight generator design. This makes it suitable for applications where space is limited, or mobility is required, such as in portable generators or smaller power generation systems. The higher rotational speed of 3,000 RPM enables the generator to deliver a higher power output per unit size. This increased power density is advantageous in applications where a compact generator is needed to provide substantial power.

Renewable Power Generation segment by end user is estimated to be the largest segment for synchronous generator market

Renewable power generation market projected to grow at 6.8% market share during the forecast period of 2023-2028. Synchronous generators are widely used in hydroelectric power plants. Water turbines, driven by the force of flowing water or falling water, are coupled to synchronous generators to produce electricity. This setup is commonly used in large-scale hydroelectric projects. They are also frequently employed in wind turbines to convert mechanical energy from the wind into electrical energy. Synchronous generators offer advantages in renewable power generation, such as stable frequency output, grid synchronization capability, and the ability to provide reactive power for grid stability

North America is expected to account for second largest market during the forecast period.

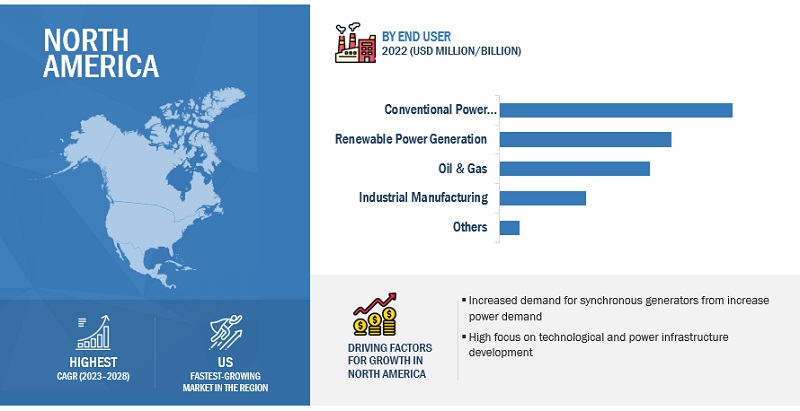
North America accounted for a 23.2% share of the synchronous generator market in 2022. The region has been segmented into the US, Canada, and Mexico. The power generation industry has grown due to infrastructure development, industrial demand, expansion of the renewable energy sector, technological advancements, and a supportive regulatory environment. The largest market in North America is the US. Companies in this region are focusing on developing new technologies to improve the efficiency of synchronous generators. Natural gas production has grown by 3.3% per year from 2011 and reached 1,135.8 billion cubic meters in 2021. With rapid urbanization, the demand for power generation has increased, which is enhancing the investment in the development of power generation industry, further driving the growth of the synchronous generator market. Besides, the North American governments have implemented policies to support the growth of the industry.
Synchronous Generator Market Size, and Share

Key Market Players

The synchronous generator market is dominated by a few major players that have a wide regional presence. The major players in the synchronous generator market are ABB (Switzerland), WEG (Brazil), Siemens Energy (Germany), Meidensha Corporation (Japan),  and Andritz (Austria). Between 2018 and 2022, Strategies such as product launches, contracts, agreements, partnerships, collaborations, alliances, acquisitions, and expansions are followed by these companies to capture a larger share of the synchronous generator market.

Want to explore hidden markets that can drive new revenue in Synchronous Generator Market?

Scope of the Report

Report Metric

Details

Market Size available for years

2021–2028

Base year considered

2022

Forecast period

2023–2028

Forecast units

Value (USD Million/Billion)

Segments covered

By Prime Mover, By Speed, By Power rating, By End User

Geographies covered

Asia Pacific, North America, Europe, Middle East & Africa, and South America 

Companies covered

ABB (Switzerland), Siemens Energy (Germany), WEG (Brazil), Menzel Elektromotoren (Germany), Ingeteam (Spain), CG Power (India), NIDEC Industrial Solutions (Japan), Marelli Motori (Italy), TMEIC (Japan), Ideal Electric (US), MECC ALTE (Italy), Heinzmann GMBH & Co. KG (Germany), Meidinsha Corporation (Japan), Jeumont Electric (France), Andritz Group (Austria), Alsaldo Energia (Italy), Lloyd Dynamowerke GMBH (Germany), Elin Motors (Austria), Partzsch Group (Germanny), Alconza (South Africa)

This research report categorizes the synchronous generator market based on Prime Mover, Speed, Power rating, End User, and region.

By Speed
  • 1,500 RPM
  • 3,000 RPM
By Prime Mover
  • Steam Turbine
  • Gas Turbine
  • Others
By Power Rating
  • 2-5 MVA
  • 5-10 MVA
  • 10-20 MVA
  • 20-30 MVA
  • 30-50 MVA
By End User
  • Renewable Power Generation
  • Oil & Gas
  • Conventional Power Generation
  • Industrial Manufacturing
  • Others
By Region
  • North America
  • Asia Pacific
  • South America
  • Europe
  • Middle East & Africa

Recent Developments

  • In Nov 2022, ABB secured its first order from COSCO Shipping, China’s largest shipping company, for in-line permanent magnet shaft generator systems.
  • In Nov 2022, Menzel Elektromotoren supplies complete rotary converter sets for test fields, with motors and generators from its own production, as well as frequency converters, transformers, all accessories, controls, and software being programmed in-house
  • In Oct 2022, WEG installed a state-of-the-art gearless wind turbine generator at the cost of INR 88 crore at Vadalivilai, which is close to the advantageous Aralvaimozhi Pass.
  • In Apr 2022, ABB introduced latest in-line shaft generator from ABB will enable ship operators to benefit from the efficiency, performance, and reliability advantages of permanent magnet technology. The new generator brings flexibility and ease of installation to a wide range of vessels, including bulk carriers, container carriers, liquid natural gas tankers, and ferries transporting passengers and cars

Frequently Asked Questions (FAQ):

To speak to our analyst for a discussion on the above findings, click Speak to Analyst

Exclusive indicates content/data unique to MarketsandMarkets and not available with any competitors.

TABLE OF CONTENTS
 
1 INTRODUCTION (Page No. - 27)
    1.1 STUDY OBJECTIVES 
    1.2 MARKET DEFINITION 
    1.3 INCLUSIONS AND EXCLUSIONS 
           1.3.1 MARKET, BY POWER RATING: INCLUSIONS AND EXCLUSIONS
           1.3.2 MARKET, BY END USER: INCLUSIONS AND EXCLUSIONS
           1.3.3 MARKET, BY PRIME MOVER: INCLUSIONS AND EXCLUSIONS
           1.3.4 MARKET, BY SPEED: INCLUSIONS AND EXCLUSIONS
    1.4 MARKET SCOPE 
           1.4.1 MARKET SEGMENTATION
           1.4.2 REGIONAL SCOPE
           1.4.3 YEARS CONSIDERED
    1.5 CURRENCY CONSIDERED 
    1.6 LIMITATIONS 
    1.7 STAKEHOLDERS 
           1.7.1 RECESSION IMPACT
 
2 RESEARCH METHODOLOGY (Page No. - 32)
    2.1 RESEARCH DATA 
           FIGURE 1 MARKET: RESEARCH DESIGN
    2.2 MARKET BREAKDOWN AND DATA TRIANGULATION 
           FIGURE 2 DATA TRIANGULATION
           2.2.1 SECONDARY DATA
                    2.2.1.1 Key data from secondary sources
           2.2.2 PRIMARY DATA
                    2.2.2.1 Key data from primary sources
                    2.2.2.2 Breakdown of primaries
                               FIGURE 3 BREAKDOWN OF PRIMARIES
    2.3 RECESSION IMPACT 
    2.4 REPORT SCOPE 
           FIGURE 4 MAIN METRICS CONSIDERED TO ANALYZE AND ASSESS DEMAND FOR SYNCHRONOUS GENERATORS
    2.5 MARKET SIZE ESTIMATION 
           2.5.1 BOTTOM-UP APPROACH
                    FIGURE 5 MARKET SIZE ESTIMATION METHODOLOGY: BOTTOM-UP APPROACH
           2.5.2 TOP-DOWN APPROACH
                    FIGURE 6 MARKET SIZE ESTIMATION METHODOLOGY: TOP-DOWN APPROACH
           2.5.3 DEMAND-SIDE ANALYSIS
                    2.5.3.1 Regional analysis
                    2.5.3.2 Country-level analysis
                    2.5.3.3 Assumptions for demand-side analysis
                    2.5.3.4 Calculations to derive market size using demand-side analysis
           2.5.4 SUPPLY-SIDE ANALYSIS
                    FIGURE 7 KEY STEPS CONSIDERED TO ASSESS SUPPLY OF SYNCHRONOUS GENERATORS
                    FIGURE 8 MARKET: SUPPLY-SIDE ANALYSIS
                    2.5.4.1 Calculations to derive market size using supply-side analysis
                    2.5.4.2 Assumptions for supply-side analysis
                               FIGURE 9 COMPANY REVENUE ANALYSIS, 2022
           2.5.5 FORECAST
 
3 EXECUTIVE SUMMARY (Page No. - 45)
    TABLE 1 SNAPSHOT OF MARKET 
    FIGURE 10 CONVENTIONAL POWER GENERATION SEGMENT TO HOLD LARGEST SHARE OF MARKET DURING FORECAST PERIOD 
    FIGURE 11 20–30 MVA SEGMENT TO LEAD MARKET DURING FORECAST PERIOD 
    FIGURE 12 1,500 RPM SEGMENT TO HOLD LARGER SHARE OF MARKET DURING FORECAST PERIOD 
    FIGURE 13 OTHERS SEGMENT TO HOLD LARGEST SHARE OF MARKET DURING FORECAST PERIOD 
    FIGURE 14 ASIA PACIFIC ACCOUNTED FOR LARGEST SHARE OF MARKET IN 2022 
 
4 PREMIUM INSIGHTS (Page No. - 50)
    4.1 ATTRACTIVE OPPORTUNITIES FOR PLAYERS IN MARKET 
           FIGURE 15 RISING ENERGY DEMAND AND RELIANCE ON CONVENTIONAL POWER GENERATION
    4.2 ASIA PACIFIC MARKET, BY END USER AND COUNTRY 
           FIGURE 16 CONVENTIONAL POWER GENERATION SEGMENT AND CHINA HELD LARGEST SHARES OF ASIA PACIFIC MARKET IN 2028
    4.3 MARKET, BY POWER RATING 
           FIGURE 17 20–30 MVA SEGMENT TO ACCOUNT FOR LARGEST MARKET SHARE IN 2028
    4.4 MARKET, BY END USER 
           FIGURE 18 CONVENTIONAL POWER GENERATION SEGMENT TO HOLD LARGEST MARKET SHARE IN 2028
    4.5 MARKET, BY PRIME MOVER 
           FIGURE 19 OTHERS SEGMENT TO LEAD MARKET IN 2028
    4.6 MARKET, BY SPEED 
           FIGURE 20 1,500 RPM SPEED SEGMENT TO HOLD LARGER MARKET SHARE IN 2028
 
5 MARKET OVERVIEW (Page No. - 54)
    5.1 INTRODUCTION 
    5.2 MARKET DYNAMICS 
           FIGURE 21 MARKET: DRIVERS, RESTRAINTS, OPPORTUNITIES, AND CHALLENGES
           5.2.1 DRIVERS
                    5.2.1.1 Rising electricity demand and replacement of aging infrastructure
                               FIGURE 22 GLOBAL ENERGY CONSUMPTION, 2017–2021
                    5.2.1.2 Increasing oil and gas demand
                               FIGURE 23 GLOBAL OIL DEMAND, 2021–2026
           5.2.2 RESTRAINTS
                    5.2.2.1 Environmental concerns associated with synchronous generators
           5.2.3 OPPORTUNITIES
                    5.2.3.1 Cost-effectiveness associated with synchronous generators than other generator types used in thermal power plants
                    5.2.3.2 Ability of synchronous generators to provide uninterrupted and stable power supply
           5.2.4 CHALLENGES
                    5.2.4.1 High manufacturing cost
    5.3 TRENDS/DISRUPTIONS IMPACTING CUSTOMERS’ BUSINESSES 
           5.3.1 REVENUE SHIFTS AND NEW REVENUE POCKETS FOR SYNCHRONOUS GENERATOR MANUFACTURERS
                    FIGURE 24 REVENUE SHIFTS FOR SYNCHRONOUS GENERATOR MANUFACTURERS
    5.4 MARKET MAP 
           TABLE 2 MARKET: ECOSYSTEM ANALYSIS
           FIGURE 25 MARKET MAP/ECOSYSTEM ANALYSIS
    5.5 VALUE CHAIN ANALYSIS 
           FIGURE 26 MARKET: VALUE CHAIN ANALYSIS
           5.5.1 RAW MATERIAL PROVIDERS/SUPPLIERS
           5.5.2 COMPONENT MANUFACTURERS
           5.5.3 SYNCHRONOUS GENERATOR MANUFACTURERS
           5.5.4 DISTRIBUTORS (BUYERS)/END USERS
           5.5.5 POST-SALE SERVICE PROVIDERS
    5.6 AVERAGE SELLING PRICE (ASP) ANALYSIS 
           TABLE 3 AVERAGE SELLING PRICE (ASP) OF SYNCHRONOUS GENERATORS BY REGION (USD), BY POWER OUTPUT RATING (2-5 MVA)
           FIGURE 27 AVERAGE SELLING PRICE (ASP) OF SYNCHRONOUS GENERATORS IN DIFFERENT REGIONS, BY POWER OUTPUT RATING (2–5 MVA)
           FIGURE 28 AVERAGE SELLING PRICE OF DIFFERENT TYPES OF SYNCHRONOUS GENERATORS, BY POWER RATING
    5.7 TECHNOLOGY ANALYSIS 
           5.7.1 VIRTUAL SYNCHRONOUS GENERATOR
                    TABLE 4 COMPARISON OF VIRTUAL SYNCHRONOUS GENERATORS WITH TRADITIONAL SYNCHRONOUS GENERATORS
    5.8 TARIFFS, CODES, AND REGULATIONS 
           5.8.1 TARIFFS RELATED TO SYNCHRONOUS GENERATORS
           5.8.2 CODES AND REGULATIONS RELATED TO MARKET
                    TABLE 5 NORTH AMERICA: LIST OF REGULATORY BODIES, GOVERNMENT AGENCIES, AND OTHER ORGANIZATIONS
                    TABLE 6 EUROPE: LIST OF REGULATORY BODIES, GOVERNMENT AGENCIES, AND OTHER ORGANIZATIONS
                    TABLE 7 ASIA PACIFIC: LIST OF REGULATORY BODIES, GOVERNMENT AGENCIES, AND OTHER ORGANIZATIONS
                    TABLE 8 MIDDLE EAST & AFRICA: LIST OF REGULATORY BODIES, GOVERNMENT AGENCIES, AND OTHER ORGANIZATIONS
                    TABLE 9 GLOBAL: LIST OF REGULATORY BODIES, GOVERNMENT AGENCIES, AND OTHER ORGANIZATIONS
           5.8.3 CODES AND REGULATIONS RELATED TO SYNCHRONOUS GENERATORS
                    TABLE 10 NORTH AMERICA: CODES AND REGULATIONS
                    TABLE 11 ASIA PACIFIC: CODES AND REGULATIONS
                    TABLE 12 EUROPE: CODES AND REGULATIONS
    5.9 PATENT ANALYSIS 
           TABLE 13 MARKET: INNOVATIONS AND PATENT REGISTRATIONS
    5.10 TRADE ANALYSIS 
           5.10.1 IMPORT SCENARIO
                    TABLE 14 IMPORT SCENARIO FOR HS CODE: 8501, BY COUNTRY, 2020–2022 (USD THOUSAND)
           5.10.2 EXPORT SCENARIO
                    TABLE 15 EXPORT SCENARIO FOR HS CODE: 8501, BY COUNTRY, 2020–2022 (USD THOUSAND)
    5.11 KEY CONFERENCES AND EVENTS, 2023–2024 
                    TABLE 16 MARKET: CONFERENCES AND EVENTS
    5.12 CASE STUDY ANALYSIS 
           5.12.1 DEPLOYMENT OF SYNCHRONOUS GENERATOR FOR BIOMASS POWER PLANT IN SCOTLAND
           5.12.2 DEPLOYMENT OF SYNCHRONOUS GENERATOR AT PAPER MILL IN SWEDEN
    5.13 PORTER’S FIVE FORCES ANALYSIS 
                    TABLE 17 MARKET: PORTER’S FIVE FORCES ANALYSIS
                    FIGURE 29 MARKET: PORTER’S FIVE FORCES ANALYSIS
           5.13.1 THREAT OF SUBSTITUTES
           5.13.2 BARGAINING POWER OF SUPPLIERS
           5.13.3 BARGAINING POWER OF BUYERS
           5.13.4 THREAT OF NEW ENTRANTS
           5.13.5 INTENSITY OF COMPETITIVE RIVALRY
    5.14 KEY STAKEHOLDERS AND BUYING CRITERIA 
           5.14.1 KEY STAKEHOLDERS IN BUYING PROCESS
                    FIGURE 30 INFLUENCE OF STAKEHOLDERS ON BUYING PROCESS, BY END USER
                    TABLE 18 INFLUENCE OF STAKEHOLDERS ON BUYING PROCESS, BY END USER (%)
           5.14.2 BUYING CRITERIA
                    FIGURE 31 KEY BUYING CRITERIA FOR END USER
                    TABLE 19 KEY BUYING CRITERIA, BY END USER
 
6 MARKET, BY SPEED (Page No. - 81)
    6.1 INTRODUCTION 
           FIGURE 32 MARKET, BY SPEED, 2022 (%)
           TABLE 20 MARKET, BY SPEED, 2021–2028 (USD MILLION)
    6.2 1,500 RPM 
           6.2.1 EXCELLENT SYNCHRONIZATION WITH GRID AND WIDENING APPLICATION SCOPE
                    TABLE 21 1,500 RPM: MARKET, BY REGION, 2021–2028 (USD MILLION)
    6.3 3,000 RPM 
           6.3.1 HIGH POWER DENSITY, COMPACT SIZE, AND LIGHTWEIGHT
                    TABLE 22 3,000 RPM: MARKET, BY REGION, 2021–2028 (USD MILLION)
 
7 MARKET, BY PRIME MOVER (Page No. - 84)
    7.1 INTRODUCTION 
           FIGURE 33 MARKET, BY PRIME MOVER, 2022 (%)
           TABLE 23 MARKET, BY PRIME MOVER, 2021–2028 (USD MILLION)
    7.2 STEAM TURBINE 
           7.2.1 HIGHLY EFFICIENT AND STABLE
                    TABLE 24 STEAM TURBINE: MARKET, BY REGION, 2021–2028 (USD MILLION)
    7.3 GAS TURBINE 
           7.3.1 FAST START-UP TIME AND FLEXIBILITY IN FUEL CHOICE
                    TABLE 25 GAS TURBINE: MARKET, BY REGION, 2021–2028 (USD MILLION)
    7.4 OTHERS 
           TABLE 26 OTHERS: MARKET, BY REGION, 2021–2028 (USD MILLION)
 
8 MARKET, BY POWER RATING (Page No. - 88)
    8.1 INTRODUCTION 
           FIGURE 34 MARKET, BY POWER RATING, 2022
           TABLE 27 MARKET, BY POWER RATING, 2021–2028 (USD MILLION)
    8.2 2–5 MVA 
           8.2.1 GOVERNMENT-LED SUBSIDIES AND IMPLEMENTATION OF FAVORABLE POLICIES TO BOOST ADOPTION OF EFFICIENT POWER GENERATION TECHNOLOGIES
                    TABLE 28 2–5 MVA: MARKET, BY REGION, 2021–2028 (USD MILLION)
    8.3 5–10 MVA 
           8.3.1 ADVANCEMENTS IN GENERATOR TECHNOLOGY
                    TABLE 29 5–10 MVA: MARKET, BY REGION, 2021–2028 (USD MILLION)
    8.4 10–20 MVA 
           8.4.1 GROWING USE IN INDUSTRIAL, COMMERCIAL, AND UTILITY SECTORS ATTRIBUTED TO ADAPTABILITY AND EFFICIENT POWER GENERATION FEATURES
                    TABLE 30 10–20 MVA: MARKET, BY REGION, 2021–2028 (USD MILLION)
    8.5 20–30 MVA 
           8.5.1 EXPANSION AND MODERNIZATION OF POWER INFRASTRUCTURE
                    TABLE 31 20–30 MVA: MARKET, BY REGION, 2021–2028 (USD MILLION)
    8.6 30–50 MVA 
           8.6.1 INCREASING ELECTRICITY DEMAND
                    TABLE 32 30–50 MVA: MARKET, BY REGION, 2021–2028 (USD MILLION)
 
9 MARKET, BY END USER (Page No. - 94)
    9.1 INTRODUCTION 
           FIGURE 35 MARKET, BY END USER, 2022
           TABLE 33 MARKET, BY END USER, 2021–2028 (USD MILLION)
    9.2 RENEWABLE POWER GENERATION 
           9.2.1 WIDELY USED IN HYDROELECTRIC AND WIND POWER PLANTS
                    TABLE 34 RENEWABLE POWER GENERATION: MARKET, BY REGION, 2021–2028 (USD MILLION)
    9.3 OIL & GAS 
           9.3.1 ABILITY TO WITHSTAND EXTREME OPERATING CONDITIONS IN OIL & GAS PLANTS
                    TABLE 35 OIL & GAS: MARKET, BY REGION, 2021–2028 (USD MILLION)
    9.4 CONVENTIONAL POWER GENERATION 
           9.4.1 MAJORLY USED IN LARGE BASELOAD POWER PLANTS (COAL AND NUCLEAR)
                    TABLE 36 CONVENTIONAL POWER GENERATION: MARKET, BY REGION, 2021–2028 (USD MILLION)
    9.5 INDUSTRIAL MANUFACTURING 
           9.5.1 USED TO MAINTAIN POWER QUALITY AND VOLTAGE STABILITY WHILE OPERATING INDUSTRIAL EQUIPMENT
                    TABLE 37 INDUSTRIAL MANUFACTURING: MARKET, BY REGION, 2021–2028 (USD MILLION)
    9.6 OTHERS 
           TABLE 38 OTHERS: MARKET, BY REGION, 2021–2028 (USD MILLION)
 
10 MARKET, BY REGION (Page No. - 100)
     10.1 INTRODUCTION 
               FIGURE 36 MARKET REGIONAL SNAPSHOT
               TABLE 39 MARKET, BY REGION, 2021–2028 (USD MILLION)
               TABLE 40 MARKET, BY REGION, 2021–2028 (UNITS)
     10.2 ASIA PACIFIC 
               FIGURE 37 ASIA PACIFIC: SNAPSHOT OF MARKET
             10.2.1 ASIA PACIFIC: RECESSION IMPACT
             10.2.2 BY POWER RATING
                       TABLE 41 ASIA PACIFIC: MARKET, BY POWER RATING, 2021–2028 (USD MILLION)
             10.2.3 BY END USER
                       TABLE 42 ASIA PACIFIC: MARKET, BY END USER, 2021–2028 (USD MILLION)
             10.2.4 BY PRIME MOVER
                       TABLE 43 ASIA PACIFIC: MARKET, BY PRIME MOVER, 2021–2028 (USD MILLION)
             10.2.5 BY SPEED
                       TABLE 44 ASIA PACIFIC: MARKET, BY SPEED, 2021–2028 (USD MILLION)
             10.2.6 BY COUNTRY
                       TABLE 45 ASIA PACIFIC: MARKET, BY COUNTRY, 2021–2028 (USD MILLION)
             10.2.7 CHINA
                       10.2.7.1 Rising investments in hydroelectric and combined-cycle power plants
                                   TABLE 46 CHINA: MARKET, BY END USER, 2021–2028 (USD MILLION)
             10.2.8 INDIA
                       10.2.8.1 Increasing focus on domestic manufacturing for power equipment
                                   TABLE 47 INDIA: MARKET, BY END USER, 2021–2028 (USD MILLION)
             10.2.9 JAPAN
                       10.2.9.1 Growing use of efficient equipment in thermal and nuclear power plants
                                   TABLE 48 JAPAN: MARKET, BY END USER, 2021–2028 (USD MILLION)
               10.2.10 AUSTRALIA
            10.2.10.1 Rising natural gas and oil exploration
                                   TABLE 49 AUSTRALIA: MARKET, BY END USER, 2021–2028 (USD MILLION)
               10.2.11 SOUTH KOREA
            10.2.11.1 Growing demand for uninterrupted power in manufacturing sector
                                   TABLE 50 SOUTH KOREA: MARKET, BY END USER, 2021–2028 (USD MILLION)
               10.2.12 REST OF ASIA PACIFIC
                                   TABLE 51 REST OF ASIA PACIFIC: MARKET, BY END USER, 2021–2028 (USD MILLION)
     10.3 NORTH AMERICA 
               FIGURE 38 NORTH AMERICA: SNAPSHOT OF MARKET
             10.3.1 NORTH AMERICA: RECESSION IMPACT
             10.3.2 BY POWER RATING
                       TABLE 52 NORTH AMERICA: MARKET, BY POWER RATING, 2021–2028 (USD MILLION)
             10.3.3 BY END USER
                       TABLE 53 NORTH AMERICA: MARKET, BY END USER, 2021–2028 (USD MILLION)
             10.3.4 BY PRIME MOVER
                       TABLE 54 NORTH AMERICA: MARKET, BY PRIME MOVER, 2021–2028 (USD MILLION)
             10.3.5 BY SPEED
                       TABLE 55 NORTH AMERICA: MARKET, BY SPEED, 2021–2028 (USD MILLION)
             10.3.6 BY COUNTRY
                       TABLE 56 NORTH AMERICA: MARKET, BY COUNTRY, 2021–2028 (USD MILLION)
             10.3.7 US
                       10.3.7.1 Increased production and investments in power industry
                                   TABLE 57 US: MARKET, BY END USER, 2021–2028 (USD MILLION)
             10.3.8 CANADA
                       10.3.8.1 Increased industrial activities
                                   TABLE 58 CANADA: MARKET, BY END USER, 2021–2028 (USD MILLION)
             10.3.9 MEXICO
                       10.3.9.1 Increase in wind turbine capacity
                                   TABLE 59 MEXICO: MARKET, BY END USER, 2021–2028 (USD MILLION)
     10.4 EUROPE 
               FIGURE 39 EUROPE: SNAPSHOT OF MARKET
     10.5 EUROPE: RECESSION IMPACT 
             10.5.1 BY POWER RATING
                       TABLE 60 EUROPE: MARKET, BY POWER RATING, 2021–2028 (USD MILLION)
             10.5.2 BY END USER
                       TABLE 61 EUROPE: MARKET, BY END USER, 2021–2028 (USD MILLION)
             10.5.3 BY PRIME MOVER
                       TABLE 62 EUROPE: MARKET, BY PRIME MOVER, 2021–2028 (USD MILLION)
             10.5.4 BY SPEED
                       TABLE 63 EUROPE: MARKET, BY SPEED, 2021–2028 (USD MILLION)
             10.5.5 BY COUNTRY
                       TABLE 64 EUROPE: MARKET, BY COUNTRY, 2021–2028 (USD MILLION)
             10.5.6 GERMANY
                       10.5.6.1 Retrofitting of old power plants
                                   TABLE 65 GERMANY: MARKET, BY END USER, 2021–2028 (USD MILLION)
             10.5.7 FRANCE
                       10.5.7.1 Rising investment in natural gas and nuclear power plants
                                   TABLE 66 FRANCE: MARKET, BY END USER, 2021–2028 (USD MILLION)
             10.5.8 UK
                       10.5.8.1 High dependency on gas-fired power plants
                                   TABLE 67 UK: MARKET, BY END USER, 2021–2028 (USD MILLION)
             10.5.9 ITALY
                       10.5.9.1 Modernization and upgrade of old power infrastructure
                                   TABLE 68 ITALY: MARKET, BY END USER, 2021–2028 (USD MILLION)
             10.5.10 SPAIN
                       10.5.10.1 High dependence on fossil fuels and natural gas power plants
                                   TABLE 69 SPAIN: MARKET, BY END USER, 2021–2028 (USD MILLION)
             10.5.11 POLAND
                       10.5.11.1 Rising need for power in decentralized locations
                                   TABLE 70 POLAND: MARKET, BY END USER, 2021–2028 (USD MILLION)
             10.5.12 DENMARK
                       10.5.12.1 Increasing investments in gas-fired power plants to replace coal power plants
                                   TABLE 71 DENMARK: MARKET, BY END USER, 2021–2028 (USD MILLION)
             10.5.13 CZECH REPUBLIC
                       10.5.13.1 Upgrade of conventional power plants
                                   TABLE 72 CZECH REPUBLIC: MARKET, BY END USER, 2021–2028 (USD MILLION)
             10.5.14 AUSTRIA
                       10.5.14.1 Growing demand for off-grid power solutions
                                   TABLE 73 AUSTRIA: MARKET, BY END USER, 2021–2028 (USD MILLION)
             10.5.15 REST OF EUROPE
                       TABLE 74 REST OF EUROPE: MARKET, BY END USER, 2021–2028 (USD MILLION)
     10.6 SOUTH AMERICA 
             10.6.1 SOUTH AMERICA: RECESSION IMPACT
             10.6.2 BY POWER RATING
                       TABLE 75 SOUTH AMERICA: MARKET, BY POWER RATING, 2021–2028 (USD MILLION)
             10.6.3 BY END USER
                       TABLE 76 SOUTH AMERICA: MARKET, BY END USER, 2021–2028 (USD MILLION)
             10.6.4 BY PRIME MOVER
                       TABLE 77 SOUTH AMERICA: MARKET, BY PRIME MOVER, 2021–2028 (USD MILLION)
             10.6.5 BY SPEED
                       TABLE 78 SOUTH AMERICA: MARKET, BY SPEED, 2021–2028 (USD MILLION)
             10.6.6 BY COUNTRY
                       TABLE 79 SOUTH AMERICA: MARKET, BY COUNTRY, 2021–2028 (USD MILLION)
             10.6.7 BRAZIL
                       10.6.7.1 Increased oil and natural gas production
                                   TABLE 80 BRAZIL: MARKET, BY END USER, 2021–2028 (USD MILLION)
             10.6.8 ARGENTINA
                       10.6.8.1 Increasing demand for efficient and reliable power equipment
                                   TABLE 81 ARGENTINA: MARKET, BY END USER, 2021–2028 (USD MILLION)
             10.6.9 REST OF SOUTH AMERICA
                       TABLE 82 REST OF SOUTH AMERICA: MARKET, BY END USER, 2021–2028 (USD MILLION)
     10.7 MIDDLE EAST & AFRICA 
             10.7.1 MIDDLE EAST & AFRICA: RECESSION IMPACT
             10.7.2 BY POWER RATING
                       TABLE 83 MIDDLE EAST & AFRICA: MARKET, BY POWER RATING, 2021–2028 (USD MILLION)
             10.7.3 BY END USER
                       TABLE 84 MIDDLE EAST & AFRICA: MARKET, BY END USER, 2021–2028 (USD MILLION)
             10.7.4 BY PRIME MOVER
                       TABLE 85 MIDDLE EAST & AFRICA: MARKET, BY PRIME MOVER, 2021–2028 (USD MILLION)
             10.7.5 BY SPEED
                       TABLE 86 MIDDLE EAST & AFRICA: MARKET, BY SPEED, 2021–2028 (USD MILLION)
             10.7.6 BY COUNTRY
                       TABLE 87 MIDDLE EAST & AFRICA: MARKET, BY COUNTRY, 2021–2028 (USD MILLION)
             10.7.7 JORDAN
                       10.7.7.1 Presence of favorable government policies
                                   TABLE 88 JORDAN: MARKET, BY END USER, 2021–2028 (USD MILLION)
             10.7.8 SOUTH AFRICA
                       10.7.8.1 Increasing investments and developments in power infrastructure
                                   TABLE 89 SOUTH AFRICA: MARKET, BY END USER, 2021–2028 (USD MILLION)
             10.7.9 EGYPT
                       10.7.9.1 Major dependency on conventional power generation
                                   TABLE 90 EGYPT: MARKET, BY END USER, 2021–2028 (USD MILLION)
             10.7.10 IRAN
                       10.7.10.1 Government policies and increased consumption of coal-based energy
                                   TABLE 91 IRAN: MARKET, BY END USER, 2021–2028 (USD MILLION)
             10.7.11 REST OF MIDDLE EAST & AFRICA
                                   TABLE 92 REST OF MIDDLE EAST & AFRICA: MARKET , BY END USER, 2021–2028 (USD MILLION)
 
11 COMPETITIVE LANDSCAPE (Page No. - 135)
     11.1 KEY STRATEGIES ADOPTED BY MAJOR MARKET PLAYERS 
               TABLE 93 OVERVIEW OF KEY STRATEGIES ADOPTED BY TOP PLAYERS, 2018–2022
     11.2 MARKET SHARE ANALYSIS OF TOP FIVE PLAYERS, 2022 
               FIGURE 40 MARKET SHARE ANALYSIS, 2022
     11.3 FIVE-YEAR COMPANY REVENUE ANALYSIS 
               FIGURE 41 REVENUE ANALYSIS OF TOP FIVE PLAYERS IN MARKET, 2018–2022
     11.4 COMPANY EVALUATION QUADRANT, 2022 
             11.4.1 STARS
             11.4.2 PERVASIVE PLAYERS
             11.4.3 EMERGING LEADERS
             11.4.4 PARTICIPANTS
                       FIGURE 42 MARKET (GLOBAL) COMPANY EVALUATION QUADRANT, 2022
     11.5 MARKET: COMPANY FOOTPRINT 
               TABLE 94 POWER RATING: COMPANY FOOTPRINT
               TABLE 95 END USER: COMPANY FOOTPRINT
               TABLE 96 REGION: COMPANY FOOTPRINT
               TABLE 97 COMPANY FOOTPRINT
     11.6 STARTUP/SMALL AND MEDIUM-SIZED ENTERPRISE (SME) EVALUATION QUADRANT, 2022 
             11.6.1 PROGRESSIVE COMPANIES
             11.6.2 RESPONSIVE COMPANIES
             11.6.3 DYNAMIC COMPANIES
             11.6.4 STARTING BLOCKS
                       FIGURE 43 MARKET: STARTUP/SME EVALUATION QUADRANT, 2021
     11.7 COMPETITIVE BENCHMARKING 
               TABLE 98 MARKET: DETAILED LIST OF KEY STARTUPS/SMES
               TABLE 99 MARKET: COMPETITIVE BENCHMARKING OF KEY STARTUPS/SMES
     11.8 COMPETITIVE SCENARIO AND TRENDS 
               TABLE 100 MARKET: OTHERS, JULY 2019–MARCH 2023
               TABLE 101 MARKET: DEALS, JULY 2021–FEBRUARY 2023
 
12 COMPANY PROFILES (Page No. - 150)
(Business overview, Products/Solutions/Services offered, Recent Developments, MNM view)*
     12.1 KEY PLAYERS 
             12.1.1 ABB
                       TABLE 102 ABB: COMPANY OVERVIEW
                       FIGURE 44 ABB: COMPANY SNAPSHOT
                       TABLE 103 ABB: PRODUCTS/SOLUTIONS/SERVICES OFFERED
                       TABLE 104 ABB: PRODUCT LAUNCHES
                       TABLE 105 ABB: DEALS
             12.1.2 WEG
                       TABLE 106 WEG: COMPANY OVERVIEW
                       FIGURE 45 WEG: COMPANY SNAPSHOT
                       TABLE 107 WEG: PRODUCTS/SOLUTIONS/SERVICES OFFERED
                       TABLE 108 WEG: PRODUCT LAUNCHES
                       TABLE 109 WEG: DEALS
             12.1.3 SIEMENS ENERGY
                       TABLE 110 SIEMENS ENERGY: COMPANY OVERVIEW
                       FIGURE 46 SIEMENS ENERGY: COMPANY SNAPSHOT
                       TABLE 111 SIEMENS ENERGY: PRODUCTS/SOLUTIONS/SERVICES OFFERED
                       TABLE 112 SIEMENS ENERGY: DEALS
             12.1.4 MENZEL ELEKTROMOTOREN
                       TABLE 113 MENZEL ELEKTROMOTOREN: COMPANY OVERVIEW
                       TABLE 114 MENZEL ELEKTROMOTOREN: PRODUCTS/SOLUTIONS/SERVICES OFFERED
                       TABLE 115 MENZEL ELEKTROMOTOREN: DEALS
             12.1.5 INGETEAM
                       TABLE 116 INGETEAM: COMPANY OVERVIEW
                       TABLE 117 INGETEAM: PRODUCTS/SOLUTIONS/SERVICES OFFERED
                       TABLE 118 INGETEAM: OTHERS
             12.1.6 CG POWER
                       TABLE 119 CG POWER: COMPANY OVERVIEW
                       FIGURE 47 CG POWER: COMPANY SNAPSHOT
                       TABLE 120 CG POWER: PRODUCTS/SOLUTIONS/SERVICES OFFERED
             12.1.7 NIDEC INDUSTRIAL SOLUTIONS
                       TABLE 121 NIDEC INDUSTRIAL SOLUTIONS: COMPANY OVERVIEW
                       TABLE 122 NIDEC INDUSTRIAL SOLUTIONS: PRODUCTS/SOLUTIONS/SERVICES OFFERED
             12.1.8 MARELLI MOTORI
                       TABLE 123 MARELLI MOTORI: COMPANY OVERVIEW
                       TABLE 124 MARELLI MOTORI: PRODUCTS/SOLUTIONS/SERVICES OFFERED
             12.1.9 TMEIC
                       TABLE 125 TMEIC: COMPANY OVERVIEW
                       TABLE 126 TMEIC: PRODUCTS/SOLUTIONS/SERVICES OFFERED
                       TABLE 127 TMEIC: DEALS
             12.1.10 IDEAL ELECTRIC
                       TABLE 128 IDEAL ELECTRIC: COMPANY OVERVIEW
                       TABLE 129 IDEAL ELECTRIC: PRODUCTS/SOLUTIONS/SERVICES OFFERED
             12.1.11 MECC ALTE
                       TABLE 130 MECC ALTE: COMPANY OVERVIEW
                       TABLE 131 MECC ALTE: PRODUCTS/SOLUTIONS/SERVICES OFFERED
                       TABLE 132 MECC ALTE: PRODUCT LAUNCHES
                       TABLE 133 MECC ALTE: DEALS
             12.1.12 HEINZMANN GMBH & CO. KG
                       TABLE 134 HEINZMANN GMBH & CO. KG: COMPANY OVERVIEW
                       TABLE 135 HEINZMANN GMBH & CO. KG: PRODUCTS/SOLUTIONS/SERVICES OFFERED
                       TABLE 136 HEINZMANN GMBH & CO. KG: DEALS
             12.1.13 MEIDENSHA CORPORATION
                       TABLE 137 MEIDENSHA CORPORATION: COMPANY OVERVIEW
                       FIGURE 48 MEIDENSHA CORPORATION: COMPANY SNAPSHOT
                       TABLE 138 MEIDENSHA CORPORATION: PRODUCTS/SOLUTIONS/SERVICES OFFERED
             12.1.14 JEUMONT ELECTRIC
                       TABLE 139 JEUMONT ELECTRIC: COMPANY OVERVIEW
                       TABLE 140 JEUMONT ELECTRIC: PRODUCTS/SOLUTIONS/SERVICES OFFERED
                       TABLE 141 JEUMONT ELECTRIC: DEALS
             12.1.15 ANDRITZ GROUP
                       TABLE 142 ANDRITZ GROUP: COMPANY OVERVIEW
                       FIGURE 49 ANDRITZ GROUP: COMPANY SNAPSHOT
                       TABLE 143 ANDRITZ GROUP: PRODUCTS/SOLUTIONS/SERVICES OFFERED
                       TABLE 144 ANDRITZ GROUP: DEALS
             12.1.16 ANSALDO ENERGIA
                       TABLE 145 ANSALDO ENERGIA: COMPANY OVERVIEW
                       TABLE 146 ANSALDO ENERGIA: PRODUCTS/SOLUTIONS/SERVICES OFFERED
     12.2 OTHER PLAYERS 
             12.2.1 LLOYD DYNAMOWERKE GMBH
             12.2.2 ELIN MOTORS
             12.2.3 PARTZSCH GROUP
             12.2.4 ALCONZA
*Details on Business overview, Products/Solutions/Services offered, Recent Developments, MNM view might not be captured in case of unlisted companies.
 
13 ADJACENT AND RELATED MARKETS (Page No. - 189)
     13.1 INTRODUCTION 
     13.2 LIMITATIONS 
     13.3 INTERCONNECTED MARKETS OF SYNCHRONOUS GENERATOR 
     13.4 SYNCHRONOUS CONDENSER MARKET 
             13.4.1 MARKET DEFINITION
             13.4.2 LIMITATIONS
             13.4.3 MARKET OVERVIEW
             13.4.4 SYNCHRONOUS CONDENSER MARKET, BY TYPE
     13.5 NEW SYNCHRONOUS CONDENSER 
             13.5.1 EXPANSION OF HVDC NETWORKS
                       TABLE 147 NEW SYNCHRONOUS CONDENSER: SYNCHRONOUS CONDENSER MARKET, BY REGION, 2018–2021 (USD MILLION)
                       TABLE 148 NEW SYNCHRONOUS CONDENSER: SYNCHRONOUS CONDENSER MARKET, BY REGION, 2022–2030 (USD MILLION)
     13.6 REFURBISHED SYNCHRONOUS CONDENSER 
             13.6.1 LOW COST OF REFURBISHED SYNCHRONOUS CONDENSER
                       TABLE 149 REFURBISHED SYNCHRONOUS CONDENSER: SYNCHRONOUS CONDENSER MARKET, BY REGION, 2018–2021 (USD MILLION)
                       TABLE 150 REFURBISHED SYNCHRONOUS CONDENSER: SYNCHRONOUS CONDENSER MARKET, BY REGION, 2022–2030 (USD MILLION)
 
14 APPENDIX (Page No. - 193)
     14.1 INSIGHTS FROM INDUSTRY EXPERTS 
     14.2 DISCUSSION GUIDE 
     14.3 KNOWLEDGESTORE: MARKETSANDMARKETS’ SUBSCRIPTION PORTAL 
     14.4 CUSTOMIZATION OPTIONS 
     14.5 RELATED REPORTS 
     14.6 AUTHOR DETAILS 

This study involved major activities in estimating the current size of the synchronous generator market. Comprehensive secondary research was done to collect information on the market, peer market, and parent market. The next step involved was validation of these findings, assumptions, and market sizing with industry experts across the value chain through primary research. The total market size was estimated through country-wise analysis. Then, the market breakdown and data triangulation were performed to estimate the market size of the segments and sub-segments.

Secondary Research

The secondary research involved the use of extensive secondary sources, directories, and databases, such as Hoover’s, Bloomberg BusinessWeek, Factiva, and OneSource, to identify and collect information useful for a technical, market-oriented, and commercial study of the global synchronous generator market. The other secondary sources comprised press releases & investor presentations of companies, white papers, certified publications, articles by recognized authors, manufacturers, associations, trade directories, and databases.

Primary Research

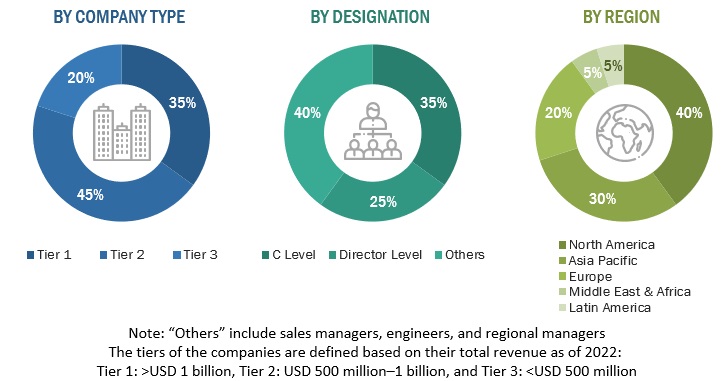
The synchronous generator market comprises several stakeholders, such as product manufacturers, service providers, distributors, and end-users in the supply chain. The demand side of this market is characterized by end-users. Moreover, the demand is also fueled by the growing demand of upgrading aging power infrastructure systems. The supply side is characterized by rising demand for contracts from the industrial sector, and mergers & acquisitions among big players. Various primary sources from both the supply and demand sides of the market were interviewed to obtain qualitative and quantitative information. Following is the breakdown of primary respondents:
Synchronous Generator Market Size, and Share

To know about the assumptions considered for the study, download the pdf brochure

Market Size Estimation

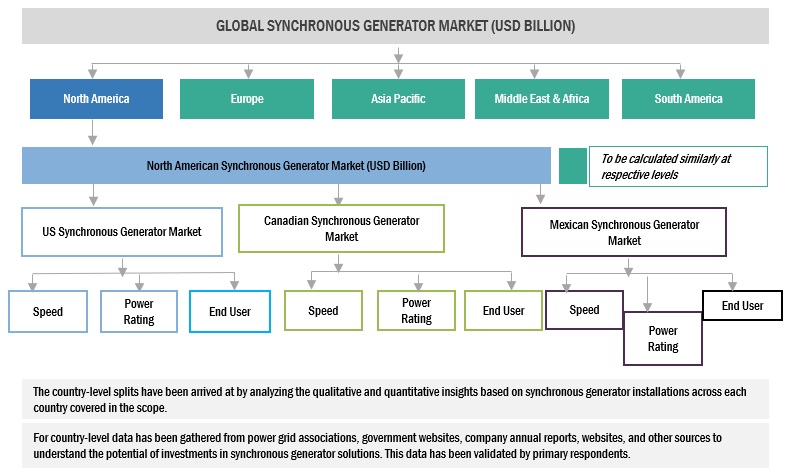
  • The bottom-up approach has been used to estimate and validate the size of the synchronous generator market.
  • In this approach, the synchronous generator production statistics for each product type have been considered at a country and regional level.
  • Extensive secondary and primary research has been carried out to understand the global market scenario for various synchronous generator.
  • Several primary interviews have been conducted with key opinion leaders related to synchronous generator system development, including key OEMs and Tier I suppliers.
  • Qualitative aspects such as market drivers, restraints, opportunities, and challenges have been taken into consideration while calculating and forecasting the market size.

Synchronous Generator Market Size: Tow-Down Approach
Synchronous Generator Market Size, and Share

To know about the assumptions considered for the study, Request for Free Sample Report

Data Triangulation

The overall market size is estimated using the market size estimation processes as explained above, followed by splitting of the market into several segments and subsegments. To complete the overall market engineering process and arrive at the exact statistics of each market segment and subsegment, data triangulation, and market breakdown procedures were employed, wherever applicable. The data was triangulated by studying various factors and trends from both the demand and supply sides in the synchronous generator market ecosystem.

Market Defenition

Synchronous generators, also known as alternators, are electrical machines that convert mechanical energy into electrical energy. They are commonly used in power generation applications, such as power plants or wind turbines, to produce electricity. Synchronous generators are designed to operate at a constant speed, known as the synchronous speed, which is determined by the frequency of the AC power being generated and the number of poles in the rotor.

The growth of the Synchronous generators market during the forecast period can be attributed to the rising demand of electricity across major countries in North America, South America, Europe, Asia Pacific, and the Middle East & Africa.

Key Stakeholders

  • Government Utility Providers
  • Independent Power Producers
  • Synchronous Generator manufacturers
  • Power equipment and garden tool manufacturers
  • Consulting companies in the energy & power sector
  • Generation utilities
  • Government and research organizations
  • Organizations, forums, and associations
  • Raw material suppliers
  • State and national regulatory authorities
  • Synchronous Generator manufacturers, distributors, and suppliers
  • Synchronous Generator original equipment manufacturers (OEMs)

Objectives of the Study

  • To define, describe, and forecast the size of the synchronous generator market by prime mover, speed, power rating, End User, and region, in terms of value
  • To estimate and forecast the global synchronous generator market for various segments with respect to 5 main regions, namely, North America, Europe, Asia Pacific (APAC), South America, Middle East & Africa, in terms of value
  • To provide comprehensive information about the drivers, restraints, opportunities, and industry-specific challenges that affect the market growth
  • To provide a detailed overview of the synchronous generator value chain, along with industry trends, use cases, security standards, and Porter’s five forces
  • To strategically analyze micromarkets with respect to individual growth trends, prospects, and contribution to the total market
  • To analyze the opportunities in the market for stakeholders by identifying high-growth segments and detail the competitive landscape for market players
  • To strategically profile key players and comprehensively analyze their market rankings and core competencies
  • To analyze competitive developments, such as joint ventures, mergers and acquisitions, contracts, and agreements, and new product launches, in the synchronous generator market
  • To benchmark players within the market using the proprietary competitive leadership mapping framework, which analyzes market players on various parameters within the broad categories of business strategy excellence and strength of product portfolio
  • This report covers the synchronous generator market size in terms of value.

Available Customizations:

With the given market data, MarketsandMarkets offers customizations according to the specific requirements of companies. The following customization options are available for the report:

Product Analysis

  • Product Matrix, which provides a detailed comparison of the product portfolio of each company

Company Information

  • Detailed analyses and profiling of additional market players
Custom Market Research Services

We will customize the research for you, in case the report listed above does not meet with your exact requirements. Our custom research will comprehensively cover the business information you require to help you arrive at strategic and profitable business decisions.

Request Customization
Report Code
EP 8667
Published ON
May, 2023
Choose License Type
BUY NOW
  • SHARE
X
Request Customization
Speak to Analyst
Speak to Analyst
OR FACE-TO-FACE MEETING
PERSONALIZE THIS RESEARCH
  • Triangulate with your Own Data
  • Get Data as per your Format and Definition
  • Gain a Deeper Dive on a Specific Application, Geography, Customer or Competitor
  • Any level of Personalization
REQUEST A FREE CUSTOMIZATION
LET US HELP YOU!
  • What are the Known and Unknown Adjacencies Impacting the Synchronous Generator Market
  • What will your New Revenue Sources be?
  • Who will be your Top Customer; what will make them switch?
  • Defend your Market Share or Win Competitors
  • Get a Scorecard for Target Partners
CUSTOMIZED WORKSHOP REQUEST
knowledgestore logo

Want to explore hidden markets that can drive new revenue in Synchronous Generator Market?

Find Hidden Markets
  • Call Us
  • +1-888-600-6441 (Corporate office hours)
  • +1-888-600-6441 (US/Can toll free)
  • +44-800-368-9399 (UK office hours)
CONNECT WITH US
ABOUT TRUST ONLINE
©2024 MarketsandMarkets Research Private Ltd. All rights reserved
DMCA.com Protection Status
Website Feedback