Sterilization Monitoring Market by Technology (Biological, Chemical), Product (Self-contained Vials, Integrating, Emulating & Bowie-dick Indicators), Method (Steam, EtO), Process (Pack, Load), End User (Hospitals, Pharma Companies) - Global Forecast to 2022


[184 Pages Report] The global sterilization monitoring market is projected to reach USD 631.0 Million by 2022, at a CAGR of 7.5% in the forecast period (2017–2022). Factors such as rising incidence of hospital-acquired infections, increasing number of surgical procedures coupled with the rising geriatric population and chronic disease incidence, technological advancements in sterilization monitoring products, and rising focus on food sterilization are the major factors driving the growth of this market. However, end user noncompliance to sterilization standards poses a major challenge to the growth of this market.
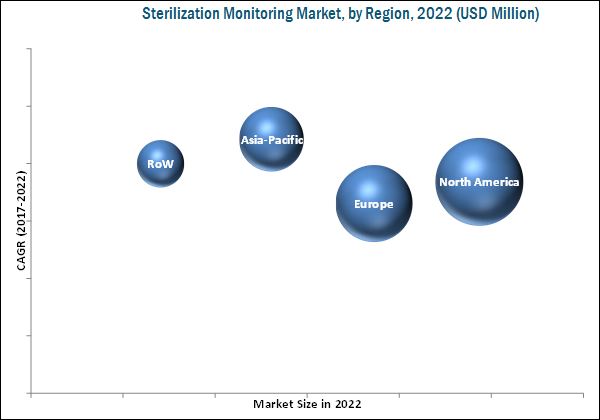
Geographically, the market for sterilization monitoring is segmented into North America, Europe, Asia-Pacific, and RoW. Among the four geographic regions, North America is estimated to command the largest share of the sterilization monitoring market in 2017, followed by Europe and Asia-Pacific. Emerging markets, including India and China, have become attractive destinations for companies engaged in the development and marketing of sterilization monitoring products. Rising incidence of hospital-acquired infection, increase in the number of surgical procedures, increasing number of hospitals, growing medical tourism industry in the region, and growth in the pharmaceutical and medical devices industry are among the major driving factors for the growth of this market in China and India. For instance, the prevalence of HAIs in India varies between 3.8% and 18.6%. In Indian ICUs, the prevalence of vancomycin-resistant enterococcus (VRE), which causes a dangerous HAI, is five times more than that in the rest of the world. Moreover, the Indian pharmaceutical industry has grown multifold over the past two decades. According to a study by the Department of Pharmaceuticals, PwC, and McKinsey, the Indian pharmaceutical sector accounts for about 2.4% of the global pharmaceutical industry in terms of value and 10% in terms of volume. This sector is expected to reach USD 55 billion by 2020 from USD 20 billion in 2015, at a CAGR of 15.9%. The rising income levels, expansion of pharmaceutical companies, and advanced medical infrastructure have led to the expansion of the pharmaceutical market in India.
As of 2016, 3M Company (U.S.), Getinge Group (Sweden), Cantel Medical Corp. (U.S.), and STERIS plc (U.S.) dominated the global sterilization monitoring market. In the past three years, these companies adopted product launches, product showcase, agreements, and expansions as their key business strategies to ensure market dominance. Cardinal Health, Inc. (U.S.), Mesa Laboratories, Inc. (U.S.), Propper Manufacturing Co. Inc. (U.S.), PMS Healthcare Technologies (Turkey), Hu-Friedy Mfg. Co., LLC (U.S.), and gke-GmbH (Germany) are some of the other players in this market.
Stakeholders
- Sterilization monitoring device manufacturers
- Sterilization monitoring service providers
- Pharmaceutical, biotechnology, and medical device companies
- Hospitals and clinical laboratories
- Food & beverage companies
- Academic and research institutes
- Regulatory bodies
To know about the assumptions considered for the study, download the pdf brochure
Scope of the Report
This report categorizes the global market for sterilization monitoring into the following segments and subsegments:
Global Sterilization Monitoring Market, by Technology
- Biological Monitoring
- Chemical Monitoring
- Mechanical Monitoring
Global Sterilization Monitoring Market, by Product
-
Biological Indicators, by Product
- Self-contained Vials
- Spore Strips
- Spore Ampoules
- Spore Suspension
-
Chemical Indicators, by Product
-
Internal Chemical Indicators, by Class
- Class 3 (Single-parameter Indicators)
- Class 4 (Multi-parameter Indicators)
- Class 5 (Integrating Indicators)
- Class 6 (Emulating Indicators)
-
External Chemical Indicators, by Class
- Class 1 (Process Indicators)
- Class 2 (Bowie-Dick Indicators)
-
Internal Chemical Indicators, by Class
Global Sterilization Monitoring Market, by Method of Sterilization
- Steam Sterilization
- Ethylene Oxide Sterilization
- Hydrogen Peroxide Sterilization
- Formaldehyde Sterilization
Global Sterilization Monitoring Market, by Process
- Pack Monitoring
- Load Monitoring
- Equipment/Process Monitoring
- Exposure Monitoring
Global Sterilization Monitoring Market, by End User
- Hospitals
- Pharmaceutical, Biotechnology, and Medical Device Companies
- Research and Academic Institutes
- Food & Beverage Industry
- Other End Users (Cosmetics Industry, Dietary Supplement Manufacturers, Veterinary Clinics, and Manufacturing Facilities)
Global Sterilization Monitoring Market, by Region
-
North America
- U.S.
- Canada
-
Europe
- Germany
- U.K.
- France
- Rest of Europe (RoE)
-
Asia-Pacific
- Japan
- China
- India
- Rest of Asia-Pacific (RoAPAC)
- Rest of the World (RoW)
Available Customizations
With the given market data, MarketsandMarkets offers customizations as per the company’s specific needs. The following customization options are available for the report:
Geographical Analysis
- Further breakdown of the sterilization monitoring market into Rest of Europe (RoE), Rest of Asia-Pacific (RoAPAC), and Rest of the World (RoW)
Company Information
- Detailed analysis and profiling of additional market players (up to 5)
The sterilization monitoring market is expected to reach USD 631.0 Million by 2022 from USD 439.5 million in 2017, at a CAGR of 7.5% between 2017 and 2022. Factors such as rising incidence of hospital-acquired infections, increasing number of surgical procedures coupled with the rising geriatric population and chronic disease incidence, technological advancements in sterilization monitoring products, and rising focus on food sterilization are the major factors driving the growth of this market. However, factors such as lack of awareness on sterilization monitoring and dearth of skilled professionals are hampering the growth of this market.
On the basis of technology, the global sterilization monitoring market is segmented into biological monitoring, chemical monitoring, and mechanical monitoring. The chemical indicators segment is expected to grow at the highest CAGR owing to its advantage to deliver immediate valuable information about specific parameters of the sterilization process such as time, temperature, and steam quality.
On the basis of product, the biological indicators market is categorized into self-contained vials, spore strips, spore ampoules, and spore suspensions. The self-contained vials segment is expected to grow at the highest CAGR during the forecast period owing to faster results, shorter processing time, ease of use, and reduced incubation period. Furthermore, the chemical indicators market is categorized into internal chemical indicators and external chemical indicators. The internal chemical indicators segment are categorized as single-parameter indicators (class 3), multi-parameter indicators (class 4), integrating indicators (class 5), and emulating indicators (class 6). The integrating indicators segment held the largest share of the global internal chemical indicators market.
On the basis of method of Sterilization, the global sterilization monitoring market is segmented into steam sterilization, ethylene oxide sterilization, hydrogen peroxide sterilization, and formaldehyde sterilization. The ethylene oxide (EtO) sterilization segment accounted for the second-largest share of the global market for sterilization monitoring in 2016. The growth of this market can be attributed to the various advantages offered by the method such as low temperature, high efficiency (destroys microorganisms, including resistant spores), large sterilizing volume/chamber capacity, and non-corrosive to plastic, metal, and rubber materials.
Based on process, the market is categorized into pack monitoring, load monitoring, equipment/process monitoring, and exposure monitoring. The load monitoring segment accounted for the second-largest share of the global sterilization monitoring market in 2016. Load monitoring enables the user to make decisions and take actions prior to surgery, which reduces the risks and costs associated with recalls and surgical infections. Moreover, the use of biological indicators in load monitoring reduces the quarantine time by 88% providing BI results in 3 hours. These factors are driving the growth of this market during the forecast period.
On the basis of end user, the market is segmented into hospitals; pharmaceutical, biotechnology, and medical device companies; research & academic institutes; food & beverage industry; and other end users. The pharmaceutical, biotechnology, and medical device companies segment is expected to grow at the highest CAGR during the forecast period. This growth can be attributed to factors such as increasing number of pharmaceutical and biotechnology companies in the Asia-Pacific region, rising need to ensure sterility, and the practice of enhancing aseptic manufacture sterility assurance level (SAL) of pharmaceuticals.
This report covers the sterilization monitoring market across four major geographies, namely, North America, Europe, Asia-Pacific, and the Rest of the World (RoW). North America is expected to account for the largest share of the global market in 2017, followed by Europe and Asia-Pacific. The Asia-Pacific market is expected to register the highest CAGR during the forecast period. The high growth of this regional segment can be attributed to growth in per capita income, increasing number of hospitals, growth in geriatric population, increase in the number of surgical procedures, and growth in the pharmaceutical and medical devices industry.
The major players in the global market for sterilization monitoring include 3M Company (U.S.), Getinge Group (Sweden), Cantel Medical Corp. (U.S.), STERIS plc (U.S.), Cardinal Health, Inc. (U.S.), Mesa Laboratories, Inc. (U.S.), Propper Manufacturing Co. Inc. (U.S.), PMS Healthcare Technologies (Turkey), Hu-Friedy Mfg. Co., LLC (U.S.), and gke-GmbH (Germany).
To speak to our analyst for a discussion on the above findings, click Speak to Analyst
 Exclusive indicates content/data unique to MarketsandMarkets and not available with any competitors.
Table of Contents
1 Sterilization Monitoring Market: Introduction (Page No. - 17)
1.1 Objectives of the Study
1.2 Market Definition
1.3 Markets Covered
1.3.1 Years Considered for the Study
1.4 Currency
1.5 Limitations
1.6 Stakeholders
2 Sterilization Monitoring Market: Research Methodology (Page No. - 20)
2.1 Secondary and Primary Research Methodology
2.1.1 Secondary Research
2.1.1.1 Key Data From Secondary Sources
2.1.2 Primary Research
2.1.2.1 Breakdown of Primaries
2.1.2.2 Key Data From Primary Sources
2.2 Market Size Estimation
2.2.1 Research Methodology: Bottom-Up Approach
2.2.2 Research Methodology: Top-Down Approach
2.3 Research Design
2.4 Market Breakdown and Data Triangulation
2.5 Research Assumptions and Limitations
2.5.1 Assumptions for the Study
2.5.2 Limitations
3 Sterilization Monitoring Market: Executive Summary (Page No. - 29)
4 Sterilization Monitoring Market: Premium Insights (Page No. - 35)
4.1 Sterilization Monitoring: Market Overview
4.2 Geographic Analysis: Market, By Method of Sterilization (2016)
4.3 Market Size, By Technology, 2017 vs 2022 (USD Million)
4.4 Market, By Process (2017 vs 2022)
4.5 Geographical Snapshot of the Market for sterilization monitoring
5 Market Overview (Page No. - 39)
5.1 Introduction
5.2 Market Dynamics
5.2.1 Drivers
5.2.1.1 Rising Incidence of Hospital-Acquired Infections
5.2.1.2 Increasing Number of Surgical Procedures
5.2.1.3 Technological Advancements in Sterilization Monitoring Products
5.2.1.4 Rising Focus on Food Sterilization
5.2.2 Restraints
5.2.2.1 Lack of Awareness on Sterilization Monitoring
5.2.2.2 Dearth of Skilled Professionals
5.2.3 Opportunities
5.2.3.1 Increasing Mergers & Acquisitions
5.2.3.2 High Growth Opportunities in Emerging Countries
5.2.3.2.1 Growing Number of Hospitals
5.2.3.2.2 Growing Pharmaceutical and Biotechnology Industry
5.2.4 Challenge
5.2.4.1 End User Noncompliance to Sterilization Standards
5.3 Industry Trends
5.3.1 Hospital Consolidation in Developed Regions
5.4 Regulatory Scenario
5.4.1 Regulatory Analysis
5.4.1.1 North America
5.4.1.2 Europe
5.4.1.3 Asia-Pacific
5.4.1.3.1 Japan
5.4.1.3.2 China
5.4.1.3.3 India
6 Sterilization Monitoring Market, By Technology (Page No. - 52)
6.1 Introduction
6.2 Biological Monitoring
6.3 Chemical Monitoring
6.4 Mechanical Monitoring
7 Sterilization Monitoring Market, By Product (Page No. - 58)
7.1 Introduction
7.2 Biological Indicators
7.2.1 Self-Contained Vials
7.2.2 Spore Strips
7.2.3 Spore Ampoules
7.2.4 Spore Suspensions
7.3 Chemical Indicators
7.3.1 Internal Chemical Indicators
7.3.1.1 Class 5 (Integrating Indicators)
7.3.1.2 Class 6 (Emulating Indicators)
7.3.1.3 Class 4 (Multi-Parameter Indicators)
7.3.1.4 Class 3 (Single-Parameter Indicators)
7.3.2 External Chemical Indicators
7.3.2.1 Class 2 (Bowie-Dick Indicators)
7.3.2.2 Class 1 (Process Indicators)
8 Sterilization Monitoring Market, By Method of Sterilization (Page No. - 70)
8.1 Introduction
8.2 Steam Sterilization
8.3 Ethylene Oxide Sterilization
8.4 Hydrogen Peroxide Sterilization
8.5 Formaldehyde Sterilization
9 Sterilization Monitoring Market, By Process (Page No. - 77)
9.1 Introduction
9.2 Pack Monitoring
9.3 Load Monitoring
9.4 Equipment/Process Monitoring
9.5 Exposure Monitoring
10 Sterilization Monitoring Market, By End User (Page No. - 84)
10.1 Introduction
10.2 Hospitals
10.3 Pharmaceutical, Biotechnology, and Medical Device Companies
10.4 Research and Academic Institutes
10.5 Food & Beverage Industry
10.6 Other End Users
11 Sterilization Monitoring Market, By Region (Page No. - 92)
11.1 Introduction
11.2 North America
11.2.1 U.S.
11.2.2 Canada
11.3 Europe
11.3.1 Germany
11.3.2 France
11.3.3 U.K.
11.3.4 Rest of Europe (RoE)
11.4 Asia-Pacific
11.4.1 Japan
11.4.2 China
11.4.3 India
11.4.4 Rest of Asia-Pacific (RoAPAC)
11.5 Rest of the World (RoW)
12 Competitive Landscape (Page No. - 128)
12.1 Introduction
12.1.1 Vanguards
12.1.2 Innovators
12.1.3 Dynamic Players
12.1.4 Emerging Players
12.2 Competitive Benchmarking
12.2.1 Product Offerings (For 25 Players)
12.2.2 Business Strategy (For 25 Players)
*Top 25 Companies Analyzed for This Study are - 3M Company (U.S.), Getinge Group (Sweden), Cantel Medical Corp. (U.S.), Steris PLC (U.S.), Cardinal Health, Inc. (U.S.), Mesa Laboratories, Inc. (U.S.), Propper Manufacturing Co. Inc. (U.S.), PMS Healthcare Technologies (Turkey), Hu-Friedy Mfg. Co., LLC (U.S.), GKE-GmbH (Germany), Matachana Group (Spain), Andersen Products, Inc. (U.S.), Bag Health Care GmbH (Germany), Terragene S.A. (Argentina), Excelsior Scientific Ltd. (U.K.),Medisafe Uk Limited (U.K.), Nigk Corporation (Japan), Parasure Limited (U.K.), Healthmark Industries Company, Inc. (U.S.), Scican, Inc. (U.S.), Etigam Bv (Netherlands), Clinichem Oy Ltd. (Finland), E.C.S. S.R.L. (Italy), Himedia Laboratories (India), and Indilab, Inc. (U.S.)
13 Company Profiles (Page No. - 134)
(Introduction, Products & Services, Strategy, & Analyst Insights, Developments, MnM View)*
13.1 3M Company
13.2 Getinge Group
13.3 Cantel Medical Corp.
13.4 Steris PLC
13.5 Cardinal Health, Inc.
13.6 Mesa Laboratories, Inc.
13.7 Propper Manufacturing Co. Inc.
13.8 PMS Healthcare Technologies
13.9 Hu-Friedy Mfg. Co., LLC
13.10 GKE-GmbH
13.11 Matachana Group
13.12 Andersen Products, Inc.
13.13 Bag Health Care GmbH
13.14 Terragene S.A.
13.15 Excelsior Scientific Ltd.
*Details on Marketsandmarkets View, Introduction, Product & Services, Strategy, & Analyst Insights, New Developments Might Not Be Captured in Case of Unlisted Companies.
14 Appendix (Page No. - 174)
14.1 Insights of Industry Experts
14.2 Discussion Guide
14.3 Knowledge Store: Marketsandmarkets’ Subscription Portal
14.4 Introducing RT: Real-Time Market Intelligence
14.5 Available Customizations
14.6 Related Reports
14.7 Author Details
List of Tables (79 Tables)
Table 1 Global Sterilization Monitoring Market Snapshot (2017 vs 2022)
Table 2 Market for Sterilization Monitoring Size, By Technology, 2015–2022 (USD Million)
Table 3 Biological Monitoring Market Size, By Region, 2015–2022 (USD Million)
Table 4 Chemical Monitoring Market Size, By Region, 2015–2022 (USD Million)
Table 5 Mechanical Monitoring Market Size, By Region, 2015–2022 (USD Million)
Table 6 Biological Indicators Market Size, By Product, 2015–2022 (USD Million)
Table 7 Self-Contained Vials Market Size, By Region, 2015–2022 (USD Million)
Table 8 Spore Strips Market Size, By Region, 2015–2022 (USD Million)
Table 9 Spore Ampoules Market Size, By Region, 2015–2022 (USD Million)
Table 10 Spore Suspensions Market Size, By Region, 2015–2022 (USD Million)
Table 11 Chemical Indicators Market Size, By Type, 2015–2022 (USD Million)
Table 12 Internal Chemical Indicators Market Size, By Region, 2015–2022 (USD Million)
Table 13 Internal Chemical Indicators Market Size, By Class, 2015–2022 (USD Million)
Table 14 External Chemical Indicators Market Size, By Region, 2015–2022 (USD Million)
Table 15 External Chemical Indicators Market Size, By Class, 2015–2022 (USD Million)
Table 16 Sterilization Monitoring Market Size, By Method of Sterilization, 2015–2022 (USD Million)
Table 17 Steam Sterilization Market Size, By Region, 2015–2022 (USD Million)
Table 18 Ethylene Oxide Sterilization Market Size, By Region, 2015–2022 (USD Million)
Table 19 Hydrogen Peroxide Sterilization Market Size, By Region, 2015–2022 (USD Million)
Table 20 Formaldehyde Sterilization Market Size, By Region, 2015–2022 (USD Million)
Table 21 Sterilization Monitoring Market Size, By Process, 2015–2022 (USD Million)
Table 22 Pack Monitoring Market Size, By Region, 2015–2022 (USD Million)
Table 23 Load Monitoring Market Size, By Region, 2015–2022 (USD Million)
Table 24 Equipment Monitoring Market Size, By Region, 2015–2022 (USD Million)
Table 25 Exposure Monitoring Market Size, By Region, 2015–2022 (USD Million)
Table 26 Sterilization Monitoring Market Size, By End User, 2015–2022 (USD Million)
Table 27 Market Size for Hospitals, By Region, 2015–2022 (USD Million)
Table 28 Market Size for Pharmaceutical, Biotechnology, and Medical Device Companies, By Region, 2015–2022 (USD Million)
Table 29 Market Size for Research and Academic Institutes, By Region, 2015–2022 (USD Million)
Table 30 Sterilization Monitoring Market Size for the Food and Beverage Industry, By Region, 2015–2022 (USD Million)
Table 31 Market Size for Other End Users, By Region, 2015–2022 (USD Million)
Table 32 Market Size, By Region, 2015-2022 (USD Million)
Table 33 North America: Sterilization Monitoring Market Size, By Country, 2015–2022 (USD Million)
Table 34 North America: Market Size, By Technology, 2015–2022 (USD Million)
Table 35 North America: Biological Indicators Market Size, By Product, 2015–2022 (USD Million)
Table 36 North America: Chemical Indicators Market Size, By Product, 2015–2022 (USD Million)
Table 37 North America: Market Size, By Method, 2015–2022 (USD Million)
Table 38 North America: Market Size, By Process, 2015–2022 (USD Million)
Table 39 North America: Market Size, By End User, 2015–2022 (USD Million)
Table 40 U.S.: Sterilization Monitoring Market Size, By Technology, 2015–2022 (USD Million)
Table 41 U.S.: Sterilization Monitoring Market Size, By End User, 2015–2022 (USD Million)
Table 42 Canada: Sterilization Monitoring Market Size, By Technology, 2015–2022 (USD Million)
Table 43 Canada: Market Size, By End User, 2015–2022 (USD Million)
Table 44 Europe: Market Size, By Country, 2015–2022 (USD Million)
Table 45 Europe: Market Size, By Technology, 2015–2022 (USD Million)
Table 46 Europe: Biological Indicators Market Size, By Product, 2015–2022 (USD Million)
Table 47 Europe: Chemical Indicators Market Size, By Product, 2015–2022 (USD Million)
Table 48 Europe: Sterilization Monitoring Market Size, By Method, 2015–2022 (USD Million)
Table 49 Europe: Market Size, By Process, 2015–2022 (USD Million)
Table 50 Europe: Market Size, By End User, 2015–2022 (USD Million)
Table 51 Germany: Sterilization Monitoring Market Size, By Technology, 2015–2022 (USD Million)
Table 52 Germany: Market Size, By End User, 2015–2022 (USD Million)
Table 53 France: Sterilization Monitoring Market Size, By Technology, 2015–2022 (USD Million)
Table 54 France: Market Size, By End User, 2015–2022 (USD Million)
Table 55 U.K.: Sterilization Monitoring Market Size, By Technology, 2015–2022 (USD Million)
Table 56 U.K.: Market Size, By End User, 2015–2022 (USD Million)
Table 57 RoE: Sterilization Monitoring Market Size, By Technology, 2015–2022 (USD Million)
Table 58 RoE: Market Size, By End User, 2015–2022 (USD Million)
Table 59 Asia-Pacific: Sterilization Monitoring Market Size, By Country, 2015–2022 (USD Million)
Table 60 Asia-Pacific: Market Size, By Technology, 2015–2022 (USD Million)
Table 61 Asia-Pacific: Biological Indicators Market Size, By Product, 2015–2022 (USD Million)
Table 62 Asia-Pacific: Chemical Indicators Market Size, By Product, 2015–2022 (USD Million)
Table 63 Asia-Pacific: Market Size, By Method, 2015–2022 (USD Million)
Table 64 Asia-Pacific: Market Size, By Process, 2015–2022 (USD Million)
Table 65 Asia-Pacific: Sterilization Monitoring Market Size, By End User, 2015–2022 (USD Million)
Table 66 Japan: Sterilization Monitoring Market Size, By Technology, 2015–2022 (USD Million)
Table 67 Japan: Market Size, By End User, 2015–2022 (USD Million)
Table 68 China: Sterilization Monitoring Market Size, By Technology, 2015–2022 (USD Million)
Table 69 China: Market Size, By End User, 2015–2022 (USD Million)
Table 70 India: Sterilization Monitoring Market Size, By Technology, 2015–2022 (USD Million)
Table 71 India: Market for Sterilization Monitoring: Size, By End User, 2015–2022 (USD Million)
Table 72 RoAPAC: Sterilization Monitoring Market Size, By Technology, 2015–2022 (USD Million)
Table 73 RoAPAC: Market Size, By End User, 2015–2022 (USD Million)
Table 74 RoW: Market Size, By Technology, 2015–2022 (USD Million)
Table 75 RoW: Biological Indicators Market Size, By Product, 2015–2022 (USD Million)
Table 76 RoW: Chemical Indicators Market Size, By Product, 2015–2022 (USD Million)
Table 77 RoW: Market Size, By Method, 2015–2022 (USD Million)
Table 78 RoW: Market Size, By Process, 2015–2022 (USD Million)
Table 79 RoW: Market for Sterilization Monitoring: Size, By End User, 2015–2022 (USD Million)
List of Figures (43 Figures)
Figure 1 Sterilization Monitoring Market
Figure 2 Research Methodology Steps
Figure 3 Breakdown of Supply-Side Primary Interviews: By Company Type, Designation, and Region
Figure 4 Data Triangulation
Figure 5 Global Sterilization Monitoring Market Size, By Technology, 2017 vs 2022 (USD Million)
Figure 6 Global Biological Indicators Market Size, By Product, 2017 vs 2022 (USD Million)
Figure 7 Global Chemical Indicators Market Size, By Product, 2017 vs 2022 (USD Million)
Figure 8 Global Market Size, By Method of Sterilization, 2017 vs 2022 (USD Million)
Figure 9 Global Market Share, By Process, 2017 vs 2022 (USD Million)
Figure 10 Global Sterilization Monitoring Market Share, By End User, 2017 vs 2022 (USD Million)
Figure 11 Geographical Snapshot of the Market for Sterilization Monitoring.
Figure 12 Rising Incidence of Hospital-Acquired Infections & Increasing Number of Surgical Procedures are Major Factors Driving Market Growth
Figure 13 Steam Sterilization Accounted for the Largest Market Share in 2016
Figure 14 Biological Monitoring Segment to Account for the Largest Share of the Sterilization Monitoring Market in 2017
Figure 15 Pack Monitoring Segment Will Continue to Dominate the Market in 2022
Figure 16 Asia-Pacific to Register the Highest CAGR During the Forecast Period
Figure 17 Sterilization Monitoring Market: Drivers, Restraints, Opportunities, and Challenges
Figure 18 U.S.: Hospital Mergers and Acquisitions, 2004-2014
Figure 19 Market Segmentation, By Technology
Figure 20 Sterilization Monitoring Market Size, By Technology, 2017 vs 2022 (USD Million)
Figure 21 Biological Indicators Market Segmentation, By Product
Figure 22 Biological Indicators Market Size, By Product, 2017 vs 2022 (USD Million)
Figure 23 Chemical Indicators Market Segmentation, By Product
Figure 24 Chemical Indicators Market Size, By Type, 2017 vs 2022 (USD Million)
Figure 25 Sterilization Monitoring Market Segmentation, By Method of Sterilization
Figure 26 Market Size, By Method of Sterilization, 2017 vs 2022 (USD Million)
Figure 27 Market Segmentation, By Process
Figure 28 Sterilization Monitoring Market Size, By Process, 2017 vs 2022 (USD Million)
Figure 29 Market Segmentation, By End User
Figure 30 Market Size, By End User, 2017 vs 2022 (USD Million)
Figure 31 Sterilization Monitoring Market, By Region
Figure 32 Asia-Pacific to Grow at the Highest Rate During the Forecast Period
Figure 33 North America: Market Snapshot
Figure 34 Europe: Market Snapshot
Figure 35 Asia-Pacific: Market Snapshot
Figure 36 RoW: Market Snapshot
Figure 37 Dive Chart
Figure 38 3M Company: Company Snapshot (2016)
Figure 39 Getinge Group: Company Snapshot (2016)
Figure 40 Cantel Medical Corp.: Company Snapshot (2016)
Figure 41 Steris PLC: Company Snapshot (2016)
Figure 42 Cardinal Health, Inc.: Company Snapshot (2016)
Figure 43 Mesa Laboratories, Inc.: Company Snapshot (2016)

 Generating Response ...


Growth opportunities and latent adjacency in Sterilization Monitoring Market