Static VAR Compensator (SVC) Market by Type (Thyristor Based, MCR-Based), by Component, by Vertical (Electric Utility, Renewable- Wind Power & Solar Farm, Railway, Industrial- Steel & Mining and Oil & Gas), and Geography - Global Forecast to 2020


The static VAR compensator (SVC) market was valued at USD 643.6 Million in 2014 and is estimated to reach USD 807.7 Million by 2020, at a CAGR of 3.8% between 2015 and 2020. The base year used for study is 2014 and the forecast period considered is between 2015 and 2020. This report provides a detailed analysis of the SVC market based on type, component, vertical, and region. It has been estimated that the thyristor-based SVC solution would hold a large share in the static VAR compensator market. However, the market for renewable vertical, which includes wind power and solar farm, is expected to grow at a high CAGR between 2015 and 2020
The static VAR compensator (SVC) market was valued at USD 643.6 Million in 2014, and it is expected to grow at a CAGR of 3.8% between 2015 and 2020. The increasing demand for renewable sources of energy and replacement of aging power infrastructure in developed geographical regions are some of the factors driving the static VAR compensator market positively.
Among the types of SVC solutions available, MCR based SVC is expected to grow at the highest rate in the static VAR compensator market. The presence of features such as high reliability, small dimension, its ability to sustain instantaneous voltage to avoid generator breaking, increased capability to transfer power, low harmonics and faster response time, as compared to thyristor-based SVC are the key reasons behind this growth.
The market for renewable vertical is expected to grow at a high CAGR during the forecast period. Increase in the number of investments made by investors in the renewable sector in countries in the Asia-Pacific, such as India, Japan and China, and also in Africa is a key reason behind the sharp growth.
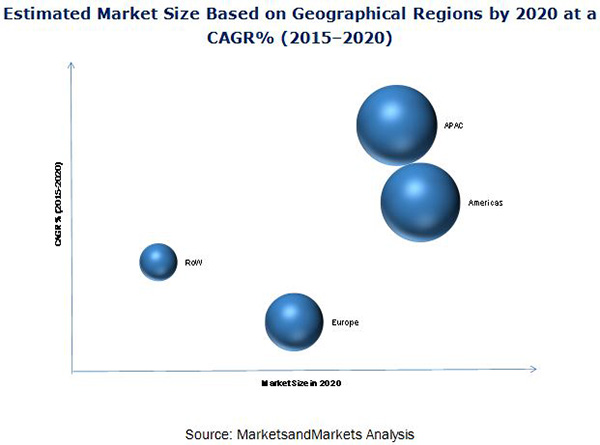
The market in the APAC region is expected to grow at the highest CAGR during the forecast period. The key reason behind a sharp growth in the APAC region can be attributed to the development of industrial sector and power infrastructure in this region. With the increase in investments, large numbers of plants are expected to be set up, which require SVC solutions for power transmission and distribution, which is directly expected to impact the growth of the overall static VAR compensator market.
Lack of awareness among companies regarding the benefits of MCR-based SVCs is one of the key restraining factors in the static VAR compensator market. There is reluctance from end customers to adopt or to switch onto SVC because of many reasons, and one such reason among them is—less knowledge about the technology. This unwillingness is mainly a result of ignorance about the benefits of MCR-based SVC. Since the inception of this technology, not much has been done to show the usefulness of this technology. In fact, MCR-based SVC devices have great potential to save the power system from the threat of collapse which in turn reduces the risk of revenue loss and penalties. However, the wide opportunities of SVC in applications such as being used as high voltage boosters for different purposes in the railways sector is responsible for the impressive growth of this market.
Key players in this market are focused on expansions and new product launches to increase their revenue. ABB Ltd. is one of the leaders in the static VAR compensator market. The company focuses on contracts and expansions to maintain their presence in the market all over the world. The company has a huge customer base with long-term contracts. For instance, in December 2014, ABB installed and commissioned four SVCs as part of a project given by Electric Transmission Texas, LLC (Austin). Similarly, ABB has also recently entered into a joint venture with Hitachi to provide HVDC solutions in Japan.
To speak to our analyst for a discussion on the above findings, click Speak to Analyst
 Exclusive indicates content/data unique to MarketsandMarkets and not available with any competitors.
Table of Contents
1 Introduction (Page No. - 14)
1.1 Study Objectives
1.2 Market Definition
1.3 Study Scope
1.3.1 Markets Covered
1.3.2 Years Considered for the Study
1.4 Currency & Pricing
1.5 Limitations
1.6 Stakeholders
2 Research Methodology (Page No. - 18)
2.1 Research Data
2.1.1 Secondary Data
2.1.1.1 Key Data From Secondary Sources
2.1.2 Primary Data
2.1.2.1 Key Data From Primary Sources
2.1.2.2 Key Industry Insights
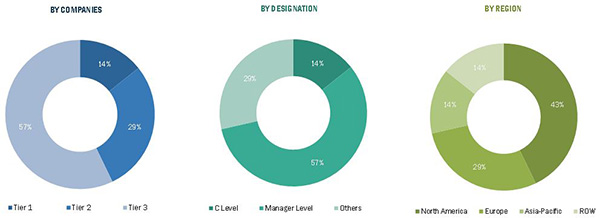
2.1.2.3 Breakdown of Primaries
2.2 Market Size Estimation
2.2.1 Bottom-Up Approach
2.2.2 Top-Down Approach
2.3 Market Breakdown and Data Triangulation
2.4 Research Assumptions
2.4.1 Assumptions
3 Executive Summary (Page No. - 26)
4 Premium Insight (Page No. - 31)
4.1 Increasing Opportunities in the Renewable Vertical Expected to Drive the static VAR compensator Market During the Forecast Period
4.2 Thyristor SVC Market: By Region
4.3 Canada Expected to Register the Highest CAGR During the Forecast Period
4.4 Americas Held the Largest Market Share in the Global SVC Market in 2014
4.5 SVC Market in Renewable Vertical
4.6 Life Cycle Analysis, By Geography
5 Market Overview (Page No. - 35)
5.1 Market Segmentation
5.2 Market Dynamics
5.2.1 Drivers
5.2.1.1 Increase in the Demand for Renewable Sources of Energy
5.2.1.2 Power Quality and Network Reliability Requirements
5.2.1.3 Upgradation and Replacement of Aging Power Infrastructure in Developed Regions
5.2.2 Restraints
5.2.2.1 Lack of Awareness About Mcr-Based SVCs
5.2.2.2 Political Intervention in the Power & Utility Market
5.2.3 Opportunities
5.2.3.1 Increasing Use of Static Var Compensators as High Voltage Boosters in Railways
5.2.4 Challenges
5.2.4.1 Cost and Other Related Issues in the SVC Market
6 Industry Trends (Page No. - 44)
6.1 Introduction
6.2 Value Chain Analysis
6.3 Porter’s Five Forces Analysis
6.3.1 Intensity of Competitive Rivalry
6.3.2 Threat of Substitutes
6.3.3 Bargaining Power of Buyers
6.3.4 Bargaining Power of Suppliers
6.3.5 Threat of New Entrants
6.4 Regulatory Landscape
7 Static Var Compensator Market, By Type (Page No. - 54)
7.1 Introduction
7.2 Thyristor-Based SVC
7.2.1 Thyristor-Controlled Reactor – Fixed Capacitor (TCR-FC)
7.2.2 Thyristor-Controlled Reactor – Thyristor Switched Capacitor (TCR-TSC)
7.3 Magnetically Controlled Reactor (Mcr)-Based SVC
8 Static Var Compensator Market, By Component (Page No. - 64)
8.1 Introduction
8.2 Power Electronics Devices
8.3 Harmonic Filter
8.4 Thyristor
8.5 Reactor
8.6 Capacitor Bank
8.7 Gis Switchgear
8.8 Phase-Shifting Transformer (PST)
8.9 Surge Arrester
8.10 Control Protection System
9 Static Var Compensator Market, By Vertical (Page No. - 68)
9.1 Introduction
9.2 Electric Utility
9.3 Renewable
9.3.1 Wind Power Grid
9.3.1.1 Onshore
9.3.1.2 Offshore
9.3.2 Solar Farm
9.4 Railway
9.5 Industrial
9.5.1 Steel
9.5.2 Mining
9.6 Oil & Gas
10 Geographic Analysis (Page No. - 85)
10.1 Introduction
10.2 Americas
10.2.1 North America
10.2.1.1 U.S.
10.2.1.2 Canada
10.2.1.3 Mexico
10.2.2 South America
10.2.2.1 Brazil
10.2.2.2 Rest of South America
10.3 Europe
10.3.1 Western Europe
10.3.1.1 Germany
10.3.1.2 France
10.3.1.3 U.K.
10.3.1.4 Spain
10.3.1.5 Rest of Western Europe
10.3.2 Eastern Europe
10.3.2.1 Russia
10.3.2.2 Turkey
10.3.3 Rest of Europe
10.4 APAC
10.4.1 China
10.4.2 India
10.4.3 Japan
10.4.4 South-Korea
10.4.5 Rest of APAC
10.5 Rest of the World
10.5.1 South Africa
10.5.2 Middle East
10.5.2.1 Saudi Arabia
10.5.2.2 Uae
11 Competitive Landscape (Page No. - 109)
11.1 Overview
11.2 Market Ranking for Static Var Compensator (SVC) Market
11.3 Competitive Scenario
11.4 Recent Developments
11.4.1 Expansions
11.4.2 New Product Launches
11.4.3 Partnerships & Joint Ventures
11.4.4 Mergers & Acquisitions
12 Company Profiles (Page No. - 116)
(Overview, Products and Services, Financials, Strategy & Development)*
12.1 Introduction
12.2 ABB Ltd.
12.3 General Electric
12.4 Siemens AG
12.5 Mitsubishi Electric Corporation
12.6 Eaton Corporation Plc
12.7 American Electric Power
12.8 Hyosung
12.9 Rongxin Power Electronic Co., Ltd.
12.10 American Superconductor Corp.
12.11 Nr Electric Co., Ltd.
*Details on Overview, Products and Services, Financials, Strategy & Development Might Not Be Captured in Case of Unlisted Companies.
13 Appendix (Page No. - 140)
13.1 Insights of Industry Experts
13.2 Discussion Guide
13.3 Introducing RT: Real-Time Market Intelligence
13.4 Available Customizations
13.5 Related Reports
List of Tables (74 Tables)
Table 1 Static VAR Compensator Market Segmentation, By Type
Table 2 Static VAR Compensator Market Segmentation, By Component
Table 3 Static VAR Compensator Market Segmentation, By Vertical
Table 4 List of SVC Projects With Government Support
Table 5 Increase in Demand for Renewable Source of Energy is PropellingThe Growth of SVC Market During the Forecast Period
Table 6 Lack of Awareness About Mcr-Based SVCs Expected to Acts as A Restraint for the SVC Market
Table 7 Increased Usage in Railways as High Voltage Boosters is A Huge Opportunity for the SVC Market
Table 8 Porter’s Five Forces Analysis: Threat of Substitutes is Likely to Have Minimum Impact on the Overall Market
Table 9 Static VAR Compensator Market: Regulatory Landscape
Table 10 SVC Market, By Type, 2013–2020 (USD Million)
Table 11 Characteristics of Mcr-Based SVC and Tcr-Based SVC
Table 12 Thyristor-Based SVC Market, By Vertical, 2013–2020 (USD Million)
Table 13 Thyristor-Based SVC Market, By Renewable Vertical,2013–2020 (USD Million)
Table 14 Thyristor-Based SVC Market, By Industrial Vertical,2013–2020 (USD Million)
Table 15 Thyristor-Based SVC Market, By Region, 2013–2020 (USD Million)
Table 16 Americas: Thyristor-Based SVC Market, By Region,2013–2020 (USD Million)
Table 17 Mcr-Based SVC Market, By Vertical, 2013–2020 (USD Million)
Table 18 Mcr-Based SVC Market, By Renewable Vertical, 2013–2020 (USD Million)
Table 19 Mcr-Based SVC Market, By Industrial Vertical, 2013–2020 (USD Million)
Table 20 Mcr-Based SVC Market, By Region, 2013–2020 (USD Million)
Table 21 Americas: Mcr Based SVC Market, By Region, 2013–2020 (USD Million)
Table 22 Static VAR Compensator Market, By Vertical, 2013–2020 (USD Million)
Table 23 Static VAR Compensator Market, By Renewable Vertical, 2013–2020 (USD Million)
Table 24 SVC Market, By Industrial Vertical, 2013–2020 (USD Million)
Table 25 Static VAR Compensator Market in Electric Utility , By Type, 2013–2020 (USD Million)
Table 26 Thyristor SVC Market in Electric Utility, By Type,2013–2020 (USD Million)
Table 27 SVC Market in Electric Utility, By Region, 2013–2020 (USD Million)
Table 28 Static VAR Compensator Market in Renewable Vertical, By Type, 2013–2020 (USD Million)
Table 29 Thyristor SVC Market in Renewable Vertical, By Type,2013–2020 (USD Million)
Table 30 SVC Market in Renewable Vertical, By Region, 2013–2020 (USD Million)
Table 31 SVC Market in Wind Power , By Type, 2013–2020 (USD Million)
Table 32 SVC Market in Wind Power, By Region, 2013–2020 (USD Million)
Table 33 SVC Market in Solar Farm, By Type, 2013–2020 (USD Million)
Table 34 SVC Market in Solar Farm, By Region, 2013–2020 (USD Million)
Table 35 SVC Market in Railway Vertical, By Type, 2013–2020 (USD Million)
Table 36 Thyristor SVC Market in Railway Vertical, By Type,2013-2020 (USD Million)
Table 37 SVC Market in Railway Vertical , By Geography, 2013–2020 (USD Million)
Table 38 SVC Market in Industrial Vertical, By Type, 2013–2020 (USD Million)
Table 39 Thyristor: SVC Market in Industrial Vertical, By Type,2013–2020 (USD Million)
Table 40 SVC Market in Industrial Vertical, By Geography,2013–2020 (USD Million)
Table 41 SVC Market in Steel, By Type, 2013–2020 (USD Million)
Table 42 SVC Market in Steel, By Geography, 2013–2020 (USD Million)
Table 43 SVC Market in Mining, By Type, 2013–2020 (USD Million)
Table 44 SVC Market in Mining, By Geography, 2013–2020 (USD Million)
Table 45 SVC Market in Oil & Gas, By Type, 2013–2020 (USD Million)
Table 46 Thyristor SVC Market in Oil & Gas, By Type, 2013–2020 (USD Million)
Table 47 SVC Market in Oil & Gas, By Region, 2013–2020 (USD Million)
Table 48 SVC Market, By Region, 2013–2020 (USD Million)
Table 49 Global SVC Power Transmission, By Region, 2013–2020 (In Mvar)
Table 50 Americas: Static VAR Compensator Market, By Vertical, 2013–2020 (USD Million)
Table 51 Americas: SVC Market, By Renewable Vertical, 2013–2020 (USD Million)
Table 52 Americas: SVC Market, By Industrial Vertical, 2013–2020 (USD Million)
Table 53 Americas: SVC Market, By Region, 2013–2020 (USD Million)
Table 54 North America: Static VAR Compensator Market, By Country, 2013–2020 (USD Million)
Table 55 South America: SVC Market, By Geography, 2013–2020 (USD Million)
Table 56 Europe: Static VAR Compensator Market, By Vertical, 2013–2020 (USD Million)
Table 57 Europe: SVC Market, By Renewable Vertical, 2013–2020 (USD Million)
Table 58 Europe: SVC Market, By Industrial Vertical, 2013–2020 (USD Million)
Table 59 Europe: SVC Market, By Region, 2013–2020 (USD Million)
Table 60 Western Europe: Static VAR Compensator Market, By Geography, 2013–2020 (USD Million)
Table 61 Eastern Europe: SVC Market, By Country, 2013–2020 (USD Million)
Table 62 APAC: Static VAR Compensator Market, By Vertical, 2013–2020 (USD Million)
Table 63 APAC: SVC Market, By Renewable Vertical, 2013–2020 (USD Million)
Table 64 APAC: SVC Market, By Industrial Vertical, 2013–2020 (USD Million)
Table 65 APAC: SVC Market, By Geography, 2013–2020 (USD Million)
Table 66 RoW: Static VAR Compensator Market, By Vertical, 2013–2020 (USD Million)
Table 67 RoW: SVC Market, By Renewable Vertical, 2013–2020 (USD Million)
Table 68 RoW: SVC Market, By Industrial Vertical, 2013–2020 (USD Million)
Table 69 RoW: SVC Market, By Region, 2013–2020 (USD Million)
Table 70 Middle East: SVC Market, By Country, 2013–2020 (USD Million)
Table 71 Expansions, 2013–2015
Table 72 New Product Launch, 2013–2015
Table 73 Partnerships & Joint Ventures, 2013–2014
Table 74 Mergers & Acquisitions, 2012–2015
List of Figures (68 Figures)
Figure 1 Research Design
Figure 2 Market Size Estimation Methodology: Bottom-Up Approach
Figure 3 Market Size Estimation Methodology: Top-Down Approach
Figure 4 Data Triangulation
Figure 5 Mcr-Based SVC Expected to Grow at the Highest Rate Between 2015 and 2020
Figure 6 Renewable Vertical of the SVC Market Expected to Grow at the Highest Rate Between 2015 and 2020
Figure 7 APAC Static VAR Compensator Market of the Renewable Vertical to Hold the Highest Market Share During the Forecast Period
Figure 8 Electric Utility Expected to Hold the Highest Market Share in Mcr-Based SVC Market During the Forecast Period
Figure 9 The Static VAR Compensator Market in APAC Expected to Grow at the Highest CAGR Between 2015 and 2020
Figure 10 Significant Increase in Demand for SVC Solution
Figure 11 APAC to Register the Highest CAGR in Thyristor SVC Market DuringThe Forecast Period
Figure 12 Electric Utility to Hold the Largest Market Share in Americas Till 2020
Figure 13 India & South Korea Expected to Witness the Highest Growth Rate During the Forecast Period
Figure 14 Solar Farm Estimated to Grow at A Higher CAGR Between 2015 and 2020
Figure 15 Static VAR Compensator Market is Currently in Growth Stage in APAC Region
Figure 16 SVC Market Segmentation, By Geography
Figure 17 Increase in Demand for Renewable Source of Energy Expected to Spur the Demand for SVC Market
Figure 18 Annual Investments & Installations in Europe Offshore Wind Farms, 2002–2014
Figure 19 Static Var Compensator (SVC) Solution Life-Cycle, 2014
Figure 20 Value Chain Analysis (2014): Major Value is Added During Epc &SVC Installation Phase
Figure 21 Static VAR Compensator Market: Porter's Five Forces Analysis (2014)
Figure 22 SVC Market: Porter’s Five Forces Analysis
Figure 23 Intensity of Competitive Rivalry: Moderate Competition in the Market Owing to the Presence of Moderate Number of Players
Figure 24 Threat of Substitutes: Threat of Substitutes is Likely to Be Low Due to Less Availability of Major Substitutes
Figure 25 Bargaining Power of Buyers: Bargaining Power of Buyers Likely to Be Moderate as Availability of Customized Solutions is Moderate
Figure 26 Bargaining Power of Suppliers: Ability to Provide SVC Solutions That are of High Quality and Reliable Would Drive the Suppliers’ Market in Future
Figure 27 Threat of New Entrants: Low Growth Rate is A Key Factor Behind Moderate Threat of New Entrants
Figure 28 Static Var Compensator Market, By Type
Figure 29 Mcr-Based SVC Type Expected to Grow at the Highest Rate Between2015 and 2020
Figure 30 Renewable Vertical Expected to Grow at the Highest Rate in the Thyristor-Based Static VAR Compensator Market Between 2015 and 2020
Figure 31 Mining Vertical Expected to Grow at the Highest Rate in the Mcr-Based Industrial Static VAR Compensator Market Between 2015 and 2020
Figure 32 Static VAR Compensator Market Segmentation: By Component
Figure 33 SVC Market Segmentation: By Vertical
Figure 34 Renewable Vertical Expected to Grow at the Highest Rate InThe Static VAR Compensator Market Between 2015 and 2020
Figure 35 Static VAR Compensator Market Segmentation: By Renewable
Figure 36 SVC Market Segmentation: By Wind Power Grid
Figure 37 Static VAR Compensator Market Segmentation: By Industrial Vertical
Figure 38 APAC Region to Grow at the Highest Rate in the Oil & Gas Static VAR Compensator Market Between 2015 and 2020
Figure 39 Static VAR Compensator Market Segmentation: By Geography
Figure 40 Geographic Snapshot: APAC Expected to Register the Highest Growth Rate During the Forecast Period
Figure 41 India Estimated to Grow at the Highest Rate Between 2015 and 2020In the Overall SVC Market
Figure 42 Segmentation: Americas
Figure 43 Americas Market Snapshot: the Demand Would Be Driven By the Requirement for Upgradation of Power Infrastructure Between 2015 and 2020
Figure 44 U.S. Holds the Maximum Share in North American Static VAR Compensator Market, in 2015
Figure 45 Segmentation: Europe
Figure 46 Europe Market Snapshot: the Demand Would Be Driven By the Growth of Renewable Vertical
Figure 47 Germany Expected to Hold the Maximum Share in the Western European SVC Market in 2015
Figure 48 Segmentation: APAC
Figure 49 APAC Market Snapshot: the Demand Would Be Driven By the Growing Consumption of Electricity
Figure 50 Segmentation: Rest of the World
Figure 51 Key Growth Strategies Adopted By the Top Companies, 2012–2015
Figure 52 Eaton Corporation PLC Grew Rapidly Between 2012 and 2014
Figure 53 Market Ranking of the Top 5 Players in the SVC Market, 2014
Figure 54 Market Evaluation Framework - New Product Launches Fuelled Growth and Innovation in 2013 and 2015
Figure 55 Battle for Market Share: Expansion Was the Key Strategy
Figure 56 Geographic Revenue Mix of Top 5 Market Players
Figure 57 ABB Ltd.: Company Snapshot
Figure 58 ABB Ltd.: SWOT Analysis
Figure 59 General Electric: Company Snapshot
Figure 60 General Electric: SWOT Analysis
Figure 61 Siemens AG: Company Snapshot
Figure 62 Siemens AG: SWOT Analysis
Figure 63 Mitsubishi Electric Corporation: Company Snapshot
Figure 64 Mitsubishi Electric Corporation: SWOT Analysis
Figure 65 Eaton Corporation: Company Snapshot
Figure 66 Eaton Corporation: SWOT Analysis
Figure 67 American Electric Power: Company Snapshot
Figure 68 American Superconductor Corp.: Company Snapshot
The research methodology used to estimate and forecast the SVC market begins with capturing data on key vendor revenues through secondary research. The vendor offerings are also taken into consideration to determine the market segmentation. The top-down procedure was employed to arrive at the overall market size of the global static VAR compensator market from the average MVARs installed globally and the average price of SVCs in USD/MVAR. After arriving at the overall market size, the total market was split into several segments and sub-segments which are then verified through primary research by conducting extensive interviews with key people such as CEOs, VPs, directors, and executives. This data triangulation and market breakdown procedures have been employed to complete the overall market engineering process and arrive at the exact statistics for all segments and sub-segments.
To know about the assumptions considered for the study, download the pdf brochure
This report provides valuable insights regarding ecosystem of this market such as product manufacturers and suppliers, distributors, energy consultants, component suppliers, engineering procurement and commissioning (EPCs), and standardization and testing firms. This study answers several questions for the stakeholders, primarily which market segments to focus on in the next two to five years for prioritizing the efforts and investments.
Target Audience
- Transmission network service providers
- Distribution network service providers
- Power generators, retailers and consultants
- End customers such as industrial and commercial users
- Government departments such as energy regulators and policy makers
- Energy producers
- Electric utilities
- Energy efficiency and sustainability consultants
- Component manufacturers
- Research organizations
- Technology standard associations, organizations, forums and alliances
Key players operating in this market are Rongxin Power Electronic Co., Ltd. (China), ABB Ltd. (Switzerland), Siemens AG (Germany), General Electric (U.S.), Eaton Corp plc (Ireland), American Electric Power (U.S.), Hyosung (South Korea), NR Electric Co. Ltd. (China), Mitsubishi Electric Corp. (Japan), and American Superconductor Corp. (U.S.).
Scope of the Report:
This research report categorizes the global static VAR compensator (SVC) market based on type, component, vertical, and region.
Global SVC Market, By Type
-
Thyristor-based
- TCR-FC
- TCR-TSC
- MCR-based
Global SVC Market, By Component
- Power electronic device
- Harmonic filter
- Thyristor
- Reactor
- Capacitor bank
- GIS switchgear
- Phase shifting transformer (PST)
- Surge arrester
- Control protection system
Global SVC Market, By Vertical
- Electric Utility
-
Renewable
-
Wind power grid
- On-shore
- Off-shore
- Solar farm
-
Wind power grid
- Railway
-
Industrial
- Steel
- Mining
- Oil & Gas
Global SVC Market, By Region
- Americas
- Europe
- APAC
- RoW
Available Customizations:
With the given market data, MarketsandMarkets offers customizations as per a company’s specific needs. The following customization options are available for the report:
- Geographic Analysis
- Comprehensive coverage of regulations followed in each region (the Americas, APAC, and Europe)
- Company Information
- Detailed analysis and profiling of additional market players (up to five)


Growth opportunities and latent adjacency in Static VAR Compensator (SVC) Market
What al information the report covers specific to western Europe? We are looking for a 2MVARS transformers for active compensation on a 35kV line. Could you help us understand the cost involved in this?
I would like to have more details about market growth of MCR-SVC for power transmission and distribution and, if possible, a comparison with market growth of STATCOM for power transmission.
I am looking forward to market projection for Static VAR Compensator (SVC), and Static Synchronous Compensator (STATCOM).
I have an offer for the same report for about 50% less than listed here. What kind of discount would you offer?