Soybean Derivatives Market by Type (Soybean, Soy Meal, and Soy Oil), Application (Feed, Food, and Other Industries), Lecithin Processing (Water, Acid, and Enzyme) and by Region - Global Trends & Forecast to 2020


The market for soybean derivatives has a significant impact not only on the food & beverage industry but on other industries as well.
This report estimates the size of the soybean derivatives market in terms of value. The market has been segmented on the basis of type, application, lecithin processing type, and region. In 2015, the global market is estimated to be led by the Asia-Pacific region, where China is the major consumer. North America is the second-largest region with regards to the application of soybean derivatives.
The driving factors of this market are the increasing global population, increasing awareness among consumers about health, and high demand for animal feed. Different industries have also increased the demand for soy derivatives in all parts of the world. Apart from food, the functional purpose of soy in feed has accelerated growth of the soybean derivatives market to a great extent.
Soybean derivatives are broadly categorized as soybean, soy meal, and soy oil. Soy meal is further segmented as soy milk and soy protein concentrate. The global market is also segmented on the basis of its applications in feed, food, and others (biodiesel, soy-based wood adhesives, soy ink, soy crayons, soy-based lubricants). It is also segmented on the basis of lecithin processing into water, acid, and enzyme. The global soybean derivatives market is divided into regions and at a country level, in terms of value. Drivers, restraints, opportunities, and challenges of the market are also discussed in detail.
The report provides a complete analysis of the key global players in the soybean derivatives industry, with a clear insight and commentary on the developments, trends, and their product portfolio. With a huge opportunity in the market, the existing companies are experiencing a significant shift in the industry. Leading players of this industry such as Bunge Ltd (U.S.), Archer Daniels Midland Company (U.S.), Louis Dreyfus Commodities (The Netherlands), Cargill, Incorporated (U.S.), and Wilmar International Limited (Singapore) have been profiled in the report. These players are executing various strategies to grow and develop in the soybean derivatives market. Joint ventures, expansions, and acquisitions have been the key moves undertaken by market players for global expansion.
Soybean Derivatives Market Size, 2014 vs. 2020 ($Billion)
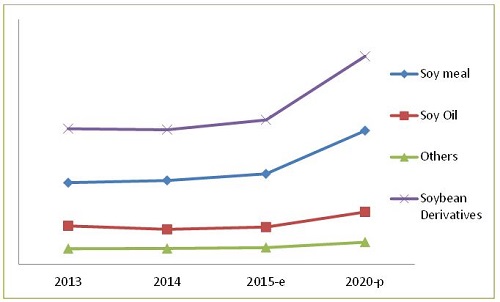
E – Estimated; P – Projected
Source: Expert Interviews, Government Authorities, Related Associations/Institutes, Related Research Publications, Government Publications, and MarketsandMarkets Analysis
Scope of the Report
This report focuses on the soybean derivatives market. It categorizes soybean derivatives on the basis of types, applications, lecithin processing, and region.
On the basis of region, the market has been segmented as follows:
- North America
- Europe
- Asia-Pacific
- Latin America
- Rest of the World (RoW)
On the basis of type, the market has been segmented as follows:
- Soybean
- Soy meal (soy milk and soy protein concentrate)
- Soy oil (soy lecithin)
On the basis of application, the market has been segmented as follows:
- Feed
- Food
- Others (biodiesel, soy-based wood adhesives, soy ink, soy crayons, soy-based lubricants and many more).
On the basis of lecithin processing, the market has been segmented as follows:
- Water
- Acid
- Enzyme
The soybean derivatives market is projected to reach $254.9 Billion by 2020, at a CAGR of 7.6%, as studied from 2015.
As per the study on soybean derivatives such as soy meal and soy oil have made a significant impact in the animal feed, food & beverage industry. Including the new market opportunities to its key players, this study also estimates each sub-segment in terms of value ($Million). In this report, soy meal is further segmented into soy milk and soy protein concentrate. Likewise, soy oil is further segmented into soy lecithin and soy gum. The global market is also segmented on the basis of its applications in feed, food, and other industries such as biodiesel, soy-based wood adhesives, soy ink, soy crayons, and soy-based lubricants. The lecithin processing segment is further sub-segmented on the basis of processing techniques by water, acid, and enzyme.
Being low-cost source of protein, essential nutrient for animal feed, in the industrial-application segment, feed was found the largest market for soybean derivatives in 2014. It is used for poultry, pork, cattle, other farm animals, pets, and fish as major ingredient in animal feed. In the type segment, soy meal was found to be the largest in 2014.
The market for soybean derivatives gains in significance due to a number of factors like the increasing global population, increasing awareness among consumers about health, and high demand for nutritious animal feed. Different industries have increased the demand for soy derivatives in all parts of the world.
Soybean Derivatives Market Size, by Region, 2014 vs. 2020 ($Billion)
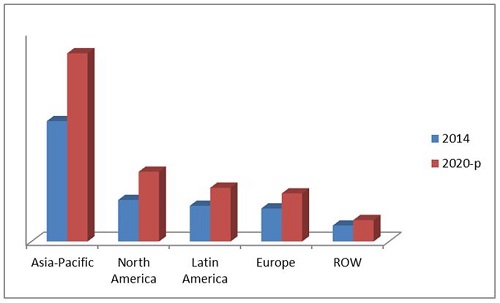
P – Projected
Source: Expert Interviews, Government Authorities, Related Associations/Institutes, Related Research Publications, Government Publications, and MarketsandMarkets Analysis
The market for soybean derivatives is estimated to be worth $176.9 Billion in 2015, and is projected to reach $254.9 Billion by 2020, at a CAGR of 7.6%. In 2015, the Asia-Pacific is estimated to be the largest market and is projected to grow to $125.9 Billion by 2020, at a CAGR of 7.8%, from 2015. North America is the second-largest market and is projected to grow at a CAGR of 9.2% during the period under review.
The high level of acceptance among customers is seen for this market due to global presence of soybean derived products and its nutritional value. Major participants in the soybean derivatives market include Bunge Ltd (U.S.), Archer Daniels Midland Company (U.S.), Louis Dreyfus Commodities Group (The Netherlands), Cargill, Incorporated (U.S.), and Wilmar International Limited (Singapore). These players are implementing various strategies to achieve growth and market share in the soybean derivatives market. The key strategies followed by Key leading players include joint ventures, expansions, acquisitions, and mergers.
 Exclusive indicates content/data unique to MarketsandMarkets and not available with any competitors.
Table of Contents
1 Introduction (Page No. - 15)
1.1 Objectives of the Study
1.2 Market Definition
1.2.1 Markets Covered
1.2.2 Period Considered for the Soybean Market
1.3 Base Currency Considered for the Soybean Derivatives Market
1.4 Limitations
1.5 Stakeholders
2 Research Methodology (Page No. - 18)
2.1 Research Data
2.1.1 Secondary Research
2.1.1.1 Key Data From Secondary Sources
2.1.2 Primary Research
2.1.2.1 Key Data From Primary Sources
2.1.3 Breakdown of Primaries
2.2 Factor Analysis
2.2.1 Introduction
2.2.2 Demand-Side Analysis
2.2.2.1 Increased Food Demand of Continuously Growing Population
2.2.2.2 Developing Economies
2.2.2.3 Increasing Middle-Class Population, 2009–2030
2.2.2.4 Supply-Side Analysis
2.2.2.5 Oilseed Production
2.2.2.6 Increased Soybean Production
2.2.2.7 Global Rise in Import of Soybean
2.3 Market Size Estimation
2.3.1 Bottom-Up Approach
2.3.2 Top-Down Approach
2.4 Market Breakdown & Data Triangulation
2.5 Market Share Estimation
2.6 Assumptions
2.7 Limitations
3 Executive Summary (Page No. - 30)
4 Premium Insights (Page No. - 34)
4.1 Extensive Market Opportunities in this Market
4.2 Soybean Derivatives Market, By Type ($Million)
4.3 Asia-Pacific: The Largest Soybean Derivatives Market
4.4 Soybean Derivatives Market, By Major Countries, 2014
4.5 Soybean Derivatives Market: Developed vs Developing Nations, 2015–2020 ($Million)
4.6 Soybean Derivatives Market Size, By Region, ($Million)
4.7 Product Growth Matrix
4.8 Life Cycle Analysis, By Region
4.9 Market Chasm Analysis
5 Market Overview (Page No. - 43)
5.1 Introduction
5.2 Evolution
5.3 Market Segmentation
5.3.1 By Type
5.3.2 By Application
5.3.3 By Processing
5.3.4 By Region
5.4 Market Dynamics
5.4.1 Drivers
5.4.1.1 Growing Requirement for Animal Feed Consumption
5.4.1.2 Increased Global Demand for Protein
5.4.1.3 Cheap Source of High-Quality Protein
5.4.1.4 Increase in Consumption of Processed Foods
5.4.1.5 Continuous Investment and Expansion of Oilseed Crushing Ability
5.4.2 Restraints
5.4.2.1 Health Issues Due to Excess Consumption of Processed Foods
5.4.2.1.1 Soy Lecithin Allergy
5.4.3 Opportunities
5.4.3.1 Growing Lecithin Demand
5.4.3.2 Increased Demand for Soy Food in Developing Nations
5.4.3.3 New Soy Derivatives Launched in the Market
5.4.4 Burning Issue
5.4.4.1 Regulations Related to Genetically Modified Soybeans
6 Industry Trends (Page No. - 54)
6.1 Introduction
6.2 Value Chain Analysis
6.3 Supply Chain Analysis
6.4 Key Influencers
6.5 Industry Trends
6.6 Porter’s Five Forces Analysis
6.6.1 Threat of New Entrants
6.6.2 Threat of Substitutes
6.6.3 Bargaining Power of Suppliers
6.6.4 Bargaining Power of Buyers
6.6.5 Intensity of Competitive Rivalry
6.7 Strategic Benchmarking
6.7.1 Key Players Targeted Acquisitions of Medium-Sized Players
6.7.2 Opportunities Through Joint Ventures & Agreements
7 Soybean Derivatives Market, By Type (Page No. - 63)
7.1 Introduction
7.2 Soybean
7.3 Soy Meal
7.3.1 Soy Milk
7.3.2 Soy Protein Concentrate
7.4 Soy Oil
7.4.1 Refined Oil
7.4.2 Lecithin
7.4.3 Others (Gums, Chemicals)
7.5 Others
8 Soybean Derivatives Market, By Application (Page No. - 74)
8.1 Introduction
8.2 Feed
8.2.1 Poultry Feed
8.2.2 Swine Feed
8.2.3 Ruminants
8.2.4 Aquafeed
8.3 Food
8.3.1 Protein
8.3.2 Fat
8.3.3 Fiber
8.4 Other Industrial Applications
9 Soyabean Lecithin Market, By Processing (Page No. - 82)
9.1 Introduction
9.2 Water
9.3 Acid
9.4 Enzyme
9.5 Others (Membrane)
10 Soybean Derivatives Market, By Region (Page No. - 86)
10.1 Introduction
10.2 Pest Analysis
10.2.1 Political Factors
10.2.2 Economic Factors
10.2.3 Social Factors
10.2.4 Technological Factors
10.3 North America
10.3.1 U.S.
10.3.2 Canada
10.3.3 Mexico
10.4 Europe
10.4.1 Germany
10.4.2 Spain
10.4.3 France
10.4.4 Russia
10.4.5 Italy
10.4.6 Rest of Europe
10.5 Asia-Pacific
10.5.1 India
10.5.2 Japan
10.5.3 China
10.5.4 Thailand
10.5.5 Indonesia
10.5.6 Rest of Asia-Pacific
10.6 Latin America
10.6.1 Brazil
10.6.2 Argentina
10.6.3 Rest of Latin America
10.7 Rest of the World (RoW)
10.7.1 Egypt
10.7.2 Middle East
10.7.3 South Africa
11 Competitive Landscape (Page No. - 126)
11.1 Overview
11.2 Soybean Derivatives Market: Growth Strategies, By Company
11.3 Competitive Situations & Trends
11.4 Agreements & Collaborations
11.5 Investments & Expansions
11.6 Acquisitions & Mergers
11.7 Joint Ventures
11.8 Partnerships
12 Company Profiles (Page No. - 133)
12.1 Introduction
12.2 Bunge Ltd.
12.3 Archer Daniels Midland and Company
12.4 Louis Dreyfus Commodities B.V.
12.5 Cargill, Incorporated
12.6 Wilmar International Limited
12.7 Noble Group Ltd.
12.8 CHS Inc.
12.9 AG Processing Inc.
12.10 Ruchi Soya Industries Limited
12.11 Du Pont Nutrition and Health
13 Appendix (Page No. - 159)
13.1 Discussion Guide
13.2 Introducing RT: Real-Time Market Intelligence
13.3 Available Customizations
List of Tables (72 Tables)
Table 1 Rising Demand for High-Quality, Backed By Increased Consumption of Processed Food
Table 2 Health Issues Faced Due to Consumption of Processed Foods is Restraining Growth of Soybean Derivatives Market
Table 3 Growing Demand for Lecithin is Likely to Enhance the Global Soybean Derivatives Market
Table 4 Regulations Related to Genetically Modified Soybeans is the Major Burning Issue in the Soybean Market
Table 5 Soybean Derivatives Market Size, By Type, 2013-2020 ($Million)
Table 6 Soy Meal Market Size, By Region, 2013-2020 ($Million)
Table 7 Soy Meal Market Size, By Sub-Type, 2013-2020 ($Million)
Table 8 Soy Oil Market Size, By Region, 2013-2020 ($Million)
Table 9 Soy Oil Market Size, By Sub-Type, 2013-2020 ($Million)
Table 10 Other Soybean Derivatives Market Size, By Region, 2013-2020 ($Million)
Table 11 Soybean Derivatives Market Size, By Application, 2013-2020 ($Million)
Table 12 Soybean Derivatives Market Size for Feed Application, By Region, 2013-2020 ($Million)
Table 13 Soybean Derivatives Market Size for Food Application, By Region, 2013-2020 ($Million)
Table 14 Soybean Derivatives Market Size in Other Industries, By Region, 2013-2020 ($Million)
Table 15 Soy Lecithin Market Size, By Processing, 2013-2020 ($Million)
Table 16 Pest Analysis: Soybean Derivatives Market
Table 17 Soybean Derivatives Market Size, By Region, 2013-2020 ($Million)
Table 18 North America: Soybean Derivatives Market Size, By Country, 2013-2020 ($Million)
Table 19 North America: Market Size, By Type, 2013-2020 ($Million)
Table 20 U.S.: Soybean Derivatives Market Size, By Type, 2013-2020 ($Million)
Table 21 U.S.: Market Size, By Application, 2013-2020 ($Million)
Table 22 Canada: Soybean Derivatives Market Size, By Type, 2013-2020 ($Million)
Table 23 Canada: Market Size, By Application, 2013-2020 ($Million)
Table 24 Mexico: Soybean Derivatives Market Size, By Type, 2013-2020 ($Million)
Table 25 Mexico: Market Size, By Application, 2013-2020 ($Million)
Table 26 Europe: Soybean Derivatives Market Size, By Country, 2013-2020 ($Million)
Table 27 Europe: Market Size, By Type, 2013-2020 ($Million)
Table 28 Germany: Soybean Derivatives Market Size, By Type, 2013-2020 ($Million)
Table 29 Germany: Market Size, By Application, 2013-2020 ($Million)
Table 30 Spain: Soybean Derivatives Market Size, By Type, 2013-2020 ($Million)
Table 31 Spain: Market Size, By Application, 2013-2020 ($Million)
Table 32 France: Soybean Derivatives Market Size, By Type, 2013-2020 ($Million)
Table 33 France: Market Size, By Application, 2013-2020 ($Million)
Table 34 Russia: Soybean Derivatives Market Size, By Type, 2013-2020 ($Million)
Table 35 Russia: Market Size, By Application, 2013-2020 ($Million)
Table 36 Italy: Soybean Derivatives Market Size, By Type, 2013-2020 ($Million)
Table 37 Italy: Market Size, By Application, 2013-2020 ($Million)
Table 38 Rest of Europe: Soybean Derivatives Market Size, By Type, 2013-2020 ($Million)
Table 39 Rest of Europe: Market Size, By Application, 2013-2020 ($Million)
Table 40 Asia-Pacific: Soybean Derivatives Market Size, By Country, 2013-2020 ($Million)
Table 41 Asia-Pacific: Market Size, By Type, 2013-2020 ($Million)
Table 42 India: Soybean Derivatives Market Size, By Type, 2013-2020 ($Million)
Table 43 India: Market Size, By Application, 2013-2020 ($Million)
Table 44 Japan: Soybean Derivatives Market Size, By Type, 2013-2020 ($Million)
Table 45 Japan: Market Size, By Application, 2013-2020 ($Million)
Table 46 China: Soybean Derivatives Market Size, By Type, 2013-2020 ($Million)
Table 47 China: Market Size, By Application, 2013-2020 ($Million)
Table 48 Thailand: Soybean Derivatives Market Size, By Type, 2013-2020 ($Million)
Table 49 Thailand: Market Size, By Application, 2013-2020 ($Million)
Table 50 Indonesia: Soybean Derivatives Market Size, By Type, 2013-2020 ($Million)
Table 51 Indonesia: Market Size, By Application, 2013-2020 ($Million)
Table 52 Rest of Asia-Pacific: Soybean Derivatives Market Size, By Type, 2013-2020 ($Million)
Table 53 Rest of Asia-Pacific : Market Size, By Application, 2013-2020 ($Million)
Table 54 Latin America: Soybean Derivatives Market Size, By Country, 2013-2020 ($Million)
Table 55 Latin America: Market Size, By Type, 2013-2020 ($Million)
Table 56 Brazil: Soybean Derivatives Market Size, By Type, 2013-2020 ($Million)
Table 57 Brazil: Market Size, By Application, 2013-2020 ($Million)
Table 58 Argentina: Soybean Derivatives Market Size, By Type, 2013-2020 ($Million)
Table 59 Argentina: Market Size, By Application, 2013-2020 ($Million)
Table 60 Rest of Latin America: Soybean Derivatives Market Size, By Type, 2013-2020 ($Million)
Table 61 Rest of Latin America: Market Size, By Application, 2013-2020 ($Million)
Table 62 RoW: Soybean Derivatives Market Size, By Country, 2013-2020 ($Million)
Table 63 RoW: Market Size, By Type, 2013-2020 ($Million)
Table 64 Egypt: Soybean Derivatives Market Size, By Type, 2013-2020 ($Million)
Table 65 Egypt: Market Size, By Application, 2013-2020 ($Million)
Table 66 Others in RoW: Soybean Derivatives Market Size, By Type, 2013-2020 ($Million)
Table 67 Others in RoW: Market Size, By Application, 2013-2020 ($Million)
Table 68 Soybean Derivatives Market, Agreements & Collaborations, 2013-2015
Table 69 Soybean Derivatives Market, Investments & Expansions, 2011–2015
Table 70 Soybean Derivatives Market, Acquisitions & Mergers, 2010–2015
Table 71 Soybean Derivatives Market, Joint Ventures, 2012–2015
Table 72 Soybean Derivatives Market, Partnerships, 2012–2015
List of Figures (84 Figures)
Figure 1 Market Segmentation
Figure 2 Research Design
Figure 3 Breakdown of Primary Interviews: By Company Type, Designation & Region
Figure 4 Global Population Projected to Reach ~9.5 Billion By 2050
Figure 5 World GDP - Per Capita (PPP) (Us$)
Figure 6 Middle-Class Population in Asia-Pacific is Projected to Grow and Account for the Largest Share in the Global Market By 2030
Figure 7 Global Oilseed Production (Million Tons), 2010-2014
Figure 8 Global Soybean Production (Million Tons), 2010-2014
Figure 9 Global Soybean Import (Metric Tons), 2009-2014
Figure 10 Market Size Estimation Methodology: Bottom-Up Approach
Figure 11 Market Size Estimation Methodology: Top-Down Approach
Figure 12 Market Breakdown & Data Triangulation
Figure 13 Soybean Derivatives Market Snapshot (2015 vs 2020): Soy Meal Segment Poised for Better Future Growth ($Million)
Figure 14 Food: Most Attractive Segment for Investment in the Next Five Years
Figure 15 Asia-Pacific: the Largest Soy Derivatives Market (2014)
Figure 16 Strong Growth Potential With Rising Feed Demand, 2015–2019 ($Million)
Figure 17 Gaining Market Significance for Soy Meal Derivatives, 2015–2020 ($Million)
Figure 18 Increasing Imports Prompted Market Growth of Soy-Derived Products, 2014
Figure 19 Soy Derivatives: Strengthening Trade Relations Between Asia-Pacific & Latin America, 2014
Figure 20 Fermented Soybean Derivatives Gaining Importance as Food in Developed Markets, 2015–2020 ($Million)
Figure 21 Asia-Pacific Poses Strong Demand for Soybean Derivatives, 2020, ($Million)
Figure 22 Demand for Protein-Rich Food to Drive Soybean Derivatives Market in Next 5 Years
Figure 23 North America to Show Strong Growth Potential in All Application Segments, 2014
Figure 24 Price Fluctuations Restrained the Growth of Soybean Derivatives Market, 2014
Figure 25 Soybean Derivatives Market Evolution
Figure 26 Soybean Derivatives Market, By Type
Figure 27 Market, By Application
Figure 28 Soy Lecithin Market, By Processing
Figure 29 Soy Lecithin Market, By Region
Figure 30 Rising Soybean Demand Backed By Rising Food Demand Around the Globe Will Drive the Market
Figure 31 Processed End Food Products, 2013 Vs 2018, ($Billion)
Figure 32 Value Chain Analysis: Major Value Added During Sourcing & Processing Phase
Figure 33 Supply Chain: Trading Bodies and Crushers Ensure Sustained Product Flow Across the Globe
Figure 34 Increase in Protein-Rich Food Demand Leading to Market Growth
Figure 35 Porter’s Five Forces Analysis
Figure 36 Strategic Benchmarking: Key Companies Involved in Acquiring Firms to Integrate Supply Chain
Figure 37 Strategic Benchmarking: Noble Group, ADM and Bunge Signed Important Joint Ventures
Figure 38 Soybean Derivatives Market Size, By Type, 2015 vs 2020 ($Million)
Figure 39 Soy Meal Market Size, By Region, 2015 vs 2020 ($Million)
Figure 40 Soy Meal Market Size, By Sub-Type, 2015 vs 2020 ($Million)
Figure 41 Soy Oil Market Size, By Region, 2015 vs 2020 ($Million)
Figure 42 Soy Oil Market Size, By Sub-Type, 2015 vs 2020 ($Million)
Figure 43 Other Soybean Derivatives Market Size, By Region, 2013-2020 ($Million)
Figure 44 Soybean Derivatives Market Size, By Application, 2015 vs 2020 ($Million)
Figure 45 Soybean Derivatives Market Size for Feed Application, By Region, 2015 vs 2020 ($Million)
Figure 46 Food: Soybean Derivatives Market Size, By Region, 2015 vs 2020 ($Million)
Figure 47 Soybean Derivatives Market Size for Other Industries, By Region, 2015 vs 2020 ($Million)
Figure 48 Lecithin Market Size, By Processing
Figure 49 Geographic Snapshot – Rapid Growth Markets are Emerging as New Hot Spots (2015-2020)
Figure 50 Soybean Derivatives Market Size, By Region, 2015 vs 2020 ($Million)
Figure 51 North America Snapshot: Soybean Derivatives Market
Figure 52 North America: Soybean Derivatives Market, 2014 vs 2020, ($Million)
Figure 53 U.S.: Soybean Derivatives Market Size, By Type, 2014 vs 2020, ($Million)
Figure 54 Soybean Derivatives Market Share in Key European Countries, By Type (2014)
Figure 55 Europe: Soybean Derivatives Market Size, By Type, 2014 vs 2020, ($Million)
Figure 56 Germany: Soybean Derivatives Market Size, By Type, 2014 vs 2020, ($Million)
Figure 57 Asia-Pacific Soybean Derivatives Market Snapshot
Figure 58 Asia-Pacific: Soybean Derivatives Market Size, By Type, 2014 vs 2020, ($Million)
Figure 59 China: Soybean Derivatives Market Size, By Type, 2014 vs 2020, ($Million)
Figure 60 Latin America: Soybean Derivatives Market Snapshot
Figure 61 Latin America: Soybean Derivatives Market Size, By Type, 2015-2020, ($Million)
Figure 62 Brazil: Soybean Derivatives Market Size, By Type, 2015 vs 2020, ($Million)
Figure 63 RoW: Soybean Derivatives Market Snapshot
Figure 64 RoW: Soybean Derivatives Market Size, By Type, 2015 vs 2020, ($Million)
Figure 65 Agreements, Joint Ventures, Partnerships, & Collaborations: Leading Approach of Key Players
Figure 66 Revenue of Key Companies in the Soybean Derivatives Market, 2010–2014 ($Million)
Figure 67 Soybean Derivatives Market Share (Developments), By Company, 2010–2015
Figure 68 Strengthening Market Presence Through Agreements, Joint Ventures, & Partnerships
Figure 69 Agreements, Collaborations, & Partnerships: Leading Strategy for Efficient Market Growth
Figure 70 Geographic Revenue Mix of Top Market Players
Figure 71 Bunge Ltd.: Company Snapshot
Figure 72 Bunge Ltd.: SWOT Analysis
Figure 73 Archer Daniels Midland Company: Company Snapshot
Figure 74 ADM: SWOT Analysis
Figure 75 Louis Dreyfus Commodities B.V.: Company Snapshot
Figure 76 Louis Dreyfus Commodities B.V: SWOT Analysis
Figure 77 Cargill, Incorporated: Company Snapshot
Figure 78 Cargill, Incorporated: SWOT Analysis
Figure 79 Wilmar International Limited: Company Snapshot
Figure 80 Wilmar International Limited: SWOT Analysis
Figure 81 Noble Group Ltd.:Company Snapshot
Figure 82 CHS Inc.: Company Snapshot
Figure 83 AG Processing Inc.: Company Snapshot
Figure 84 Ruchi Soya Industries Limited: Company Snapshot


Growth opportunities and latent adjacency in Soybean Derivatives Market