South American Automotive Production Outlook to 2018 by Vehicle Type (Passenger Cars, LCV, and HCV), Fuel Type (Gasoline, Diesel, and Others) and Key Country Level Markets (Brazil and Argentina)
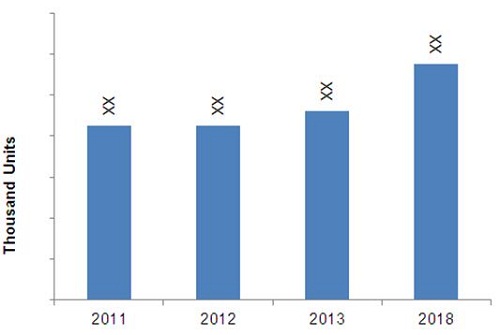
[144 Pages Report] The South American region has been garnering a lot of attention from automotive OEMs over the past few years. The regions vehicle production witnessed a growth of 8.23% from 2011 to 2013. The major countries contributing to the same were Brazil, Argentina, and Columbia. The major automotive original equipment manufacturers of the region are Fiat Chrysler Automobiles, Volkswagen, Ford Motor Co., and General Motors Co. With aid from the government in the form of liberal policies and regulations, OEMs in the region have been increasing their operations in the region to cater to the domestic and export demands. The entire South American automobile production market is expected to grow to 5,760.79 thousand units by 2018.
Growing urbanization, cheap labor and land rates have led to increased investments by the OEMs in the region to set up more plants and expand their production capacities in order to increase their market share in the region as well as cater to the increasing demand in the export markets. OEMs are achieving this by introducing new and improved technologies in the gasoline as well as diesel engine powertrain segment. Another factor responsible for the high investments in the automobile production industry is the availability of natural resources and cheap labor in the region and also increased purchasing power of the local population.
The introduction of policies from the governments requiring the use of blended fuels and natural gas as fuel in their vehicles has propelled the production of gasoline powered and AFVs in the region to new heights and they are expected to be the fastest growing segment in the South American automotive production market. Brazil is the largest contributor to the market in terms of volume while Argentina is expected to closely follow Brazil in terms of growth.
This report covers the entire South American automotive production market and vehicle trends focusing mainly on the vehicle types (passenger cars, heavy duty vehicles, and light commercial vehicles) and vehicle fuel types (diesel, gasoline and other fuel types). The key country level markets which are addressed in this report are Brazil, Argentina and Others. The other qualitative aspects covered in this report are Porters five forces, market dynamics and others.
South American Vehicle Production 2011-2018 (000 units)

Please click here to get the relevant report of
North American Automotive Production Outlook to 2018 by Vehicle Type (Passenger Cars, LCV, and HCV), Fuel Type (Gasoline, Diesel, and Others) and Key Country Level Markets (U.S., Canada, and Mexico)
The South American automotive production market can be sub-segmented on the basis of two types: vehicle type and fuel types. The types of vehicles include passenger cars, light-duty commercial vehicles (LCVs), and heavy-duty commercial vehicles (HCVs). The fuel types include gasoline, diesel, and others. During the course of time the industry has matured and grown due to different reasons such as the fast-growing FDIs, cheap labor, and increasing GDP. The region is also an attractive emerging market for all the original equipment manufacturers (OEMs) because of the rising vehicle demand in countries such as Brazil and Argentina. The vehicle industry has been showing continuous technological advancements mainly in different powertrain segments.
The key driver which is responsible for driving the growth of the automobile industry in the Latin American region is the fast economic recovery of the region after the global financial crisis. Brazils economy was able to return to positive growth within two quarters. With the rise in the regions economic growth, it has become a promising market for the OEMs to invest in. Another reason for this continuous growth is the trade agreements signed between the countries in this region and also with other foreign countries. For instance, one of the major trade agreements is MERCOSUR trade agreement signed between Argentina, Brazil, Paraguay, and Uruguay and another is the South American Free Trade Agreement (SAFTA) which is signed between the major countries of South America. All these factors have put the automobile industry in the South American region on a promising growth track.
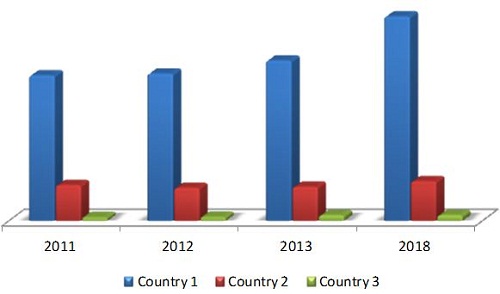
The major vehicle-producing nation in the South American region is Brazil, which is growing at a CAGR of 5.0%. This growth can mainly be attributed to the growth in demand of passenger cars and light-duty commercial vehicles, respectively in the domestic as well as export markets. Brazil is followed by Argentina, which is growing at a much faster rate than that of other countries combined.
The key automobile manufacturers in the South American region are identified as, Fiat Chrysler Automobiles, Volkswagen AG, Ford Motor Co., PSA, and Renault. These companies collectively account for a major share of the complete automobile market.
This report covers the vehicle production which is segmented based on Vehicle Type (passenger cars, LCVs and HCVs) and Fuel Type (Gasoline, Diesel, and other fuel types), with focus on Brazil and Argentina. And also the report provides qualitative insights into the South American automotive production market. All the production estimates given are in terms of volume (thousand units).
South America Vehicle Production Volume, by Country, 20112018 (000 Units)

Source: Industry Journals, Company Presentations, and MarketsandMarkets Analysis

Table Of Contents
1 Introduction (Page No. - 12)
1.1 Key Take-Aways
1.2 Report Description
1.2.1 Report Catalyst
1.2.2 Report Structure
1.3 Glance At Markets Covered
1.3.1 By Country
1.3.2 By Vehicle Type
1.3.3 By Fuel Type
1.4 Stakeholders
1.5 Key Data Points & Sources
1.5.1 Secondary Sources
1.5.2 Key Data Points Taken From Primary Sources
1.6 Research Methodology & Assumption
1.6.1 Assumptions
2 Executive Summary (Page No. - 22)
2.1 Passenger Cars: Leading The Segment in Latin America
2.2 Diversified Choices Of Fuel
3 Market Overview (Page No. - 25)
3.1 Introduction
3.2 Market Dynamics
3.2.1 South American Automotive Production: Drivers & Their Impact Analysis
3.2.1.1 South American Automotive Production: Drivers & Their Impact Analysis
3.2.1.2 Regional Agreements
3.2.2 South American Automotive Production: Restraints & Their Impact Analysis
3.2.2.1 Rising Raw Material Prices
3.2.2.2 Instable Political Conditions
3.2.2.3 Income Disparity
3.2.2.4 High Lending Interest Rates
3.2.2.5 Focus on Greener Vehicles
3.2.2.6 Increasing Demand For Vehicles in Export Markets
3.3 Burning Issues
3.3.1 High Import Duties and Restricted Access to Foreign Exchange
3.4 Winning Imperative
3.4.1 Introduction Of Global Vehicles
3.5 Value Chain Analysis
3.6 Porters Five Forces Analysis
3.7 Pestle Analysis
3.8 Market Share Analysis
4 South American Light Commercial Vehicles Market, By Country & Fuel Type (Page No. - 40)
4.1 Introduction
4.2 South American Passenger Cars Production, By Country
4.3 South American Passenger Cars Production, By Fuel Type
4.4 South American Passenger Cars Production: Key Country Level Markets
4.4.1 Brazil Passenger Cars Production, By Fuel Type
4.4.2 Argentina Passenger Cars Production, By Fuel Type
4.4.3 Others Passenger Cars Production, By Fuel Type
5 South American Light Commercial Vehicles Market, By Country & Fuel Type (Page No. - 49)
5.1 Introduction
5.2 South American Light Commercial Vehicles Production, By Country
5.3 South American Light Commercial Vehicles Production, By Fuel Type
5.4 South American Light Commercial Vehicles Production: Key Country Level Markets
5.4.1 Brazil Light Commercial Vehicles Production, By Fuel Type
5.4.2 Argentina Light Commercial Vehicles Production, By Fuel Type
5.4.3 Others Light Commercial Vehicles Production, By Fuel Type
6 South American Heavy Commercial Vehicles Market, By Country & Fuel Type (Page No. - 58)
6.1 Introduction
6.2 South American Heavy Commercial Vehicles Production, By Country
6.3 South American Heavy Commercial Vehicles Production, By Fuel Type
6.4 South American Heavy Commercial Vehicles Production: Key Country Level Markets
6.4.1 Brazil Heavy Commercial Vehicles Production, By Fuel Type
6.4.2 Argentina Heavy Commercial Vehicles Production, By Fuel Type
6.4.3 Others Heavy Commercial Vehicles Production, By Fuel Type
7 Engine Production Scenario (Page No. - 67)
7.1 South American Engine Manufacturing Scenario 2011, By Fuel Type
7.2 South American Engine Manufacturing Scenario 2011, By Displacement
7.3 South American Engine Manufacturing Scenario 2011, By Manufacturer
8 Competitive Landscape & Strategies (Page No. - 71)
8.1 Introduction
8.2 Key Growth Strategies
9 Company Profiles (Page No. - 76)
9.1 Fiat S.P.A.
9.2 Volkswagen AG
9.3 General Motors Co.
9.4 Renault S.A.
9.5 Ford Motor Co.
9.6 Peugeot S.A.
9.7 Toyota Motor Co.
9.8 Honda Motor Co.
9.9 Hyundai Motor Co.
9.10 Daimler AG
9.11 BMW AG
List Of Tables (34 Tables)
Table 1 Research Methodology: Forecasting Model
Table 2 Major Players Market Revenue, 2012 ($Billion)
Table 3 South America: Passenger Cars Production, By Country, 20112018 (000 Units)
Table 4 South America: Passenger Cars Production, By Fuel Type, 20112018 (000 Units)
Table 5 Brazil: Passenger Cars Production, By Fuel Type, 20112018 (000 Units)
Table 6 Argentina: Passenger Cars Production, By Fuel Type, 20112018 (000 Units)
Table 7 Others: Passenger Cars Production, By Fuel Type, 20112018 (000 Units)
Table 8 South America: Lcv Production, By Country, 20112018 (000 Units)
Table 9 South America: Lcv Production, By Fuel Type, 20112018 (000 Units)
Table 10 Brazil: Lcv Production, By Fuel Type, 20112018 (000 Units)
Table 11 Argentina: Lcv Production, By Fuel Type, 20112018 (000 Units)
Table 12 Others: Lcv Production, By Fuel Type, 20112018 (000 Units)
Table 13 South America: Hcv Production, By Country, 20112018 (000 Units)
Table 14 South America: Hcv Production, By Fuel Type, 20112018 (000 Units)
Table 15 Brazil: Hcv Production, By Fuel Type, 20112018 (000 Units)
Table 16 Argentina: Hcv Production, By Fuel Type, 20112018 (000 Units)
Table 17 Others: Hcv Production, By Fuel Type, 20112018 (000 Units)
Table 18 Key Growth Strategies Market Share, 2009-2014
Table 19 Fiat S.P.A..: Revenue, By Segment, 2011-2012 ($Billion)
Table 20 Volkswagen AG: Revenue, By Segment, 2011-2012 ($Million)
Table 21 Volkswagen AG: Revenue, By Geography, 2011-2012 ($Million)
Table 22 General Motors Co.: Revenue, By Segment, 2012-2013 ($Billion)
Table 23 Renault S.A. : Revenue, By Geography, 2012-2013 ($Million)
Table 24 Ford Motor Co.: Revenue, By Segment, 2011-2012 ($Million)
Table 25 Peugeot S.A. : Revenue, By Segment, 2012-2013 ($Million)
Table 26 Peugeot S.A. : Revenue, By Geography, 2012-2013 ($Million)
Table 27 Toyota Motor Co.: Revenue, By Geography, 2012-2013 ($Billion)
Table 28 Toyota Motor Co.: Revenue, By Business Segment, 2012-2013 ($Billion)
Table 29 Honda Motor Co.: Automobile Segment Revenue, By Geography, 2012-2013 ($Million)
Table 30 Hyundai Motors Co.: Revenue, By Segment, 2011-2012 ($Million)
Table 31 Daimler AG: Revenue, By Segment, 2012-2013 ($Billion)
Table 32 Daimler AG: Revenue, By Geography, 2012-2013 ($Billion)
Table 33 BMW AG: Revenue, By Segment, 2011-2012 ($Million)
Table 34 BMW AG: Revenue, By Geography, 2011-2012 ($Million)
List Of Figures (20 Figures)
Figure 1 Glance At Markets Covered
Figure 2 Market Dynamics
Figure 3 South America Automotive Industry: Value Chain Analysis
Figure 4 South America Automotive Industry: Porters Five Forces Analysis
Figure 5 South America: Pestle Analysis
Figure 6 South America: Market Share Analysis, 2013
Figure 7 South America: Passenger Car Production, By Country, 20112018 (000 Units)
Figure 8 South America: Passenger Car Production Share, By Fuel Type
Figure 9 South America: Light Commercial Vehicle Production, By Country, 20112018 (000 Units)
Figure 10 South America: Light Commercial Vehicle Production Share, By Fuel Type
Figure 11 South America: Heavy Commercial Vehicle Production, By Country, 20112018 (000 Units)
Figure 12 South America: Heavy Commercial Vehicle Production Share, By Country, 2013 Vs 2018
Figure 13 South American Engine Manufacturing Scenario 2011, By Fuel Type
Figure 14 South American Engine Manufacturing Scenario 2011, By Displacement
Figure 15 South American Engine Manufacturing Scenario 2011, By Manufacturer
Figure 16 Key Growth Strategies, 2011-2014
Figure 17 Key Growth Strategies Market Share, 2009-2014
Figure 18 Active Market Players
Figure 19 Volkswagen AG: Revenue, By Segment, 2011-2012 ($Million)
Figure 20 Volkswagen AG: Revenue, By Geography, 2011-2012 ($Million)


Growth opportunities and latent adjacency in South American Automotive Production Outlook to 2018