Sizing & Thickening Agents Market by type (Sizing: natural, synthetic, Thickening: minerals, hydrocolloids), Application (Food& Beverages, Paper & Paperboard, Paints& Coatings, Textile & Fiber) & by Region - Global Trends & Forecast to 2020


This report analyzes the sizing & thickening agents market, in terms of region, type, and application.
The global sizing & thickening agents market is driven by growing demand for natural ingredients in food & beverage products. Increasing demand for healthy, nutritive, and convenience food products is driving the hydrocolloids segment in the thickening agents market. The growing trend of using clean-label products, which are slowly becoming mandatory across the globe, creates many opportunities for new formulations and new product developments in food & beverage segments.
The demand for sizing & thickening agents is fueled by applications in various industries such as paper & paperboard, textiles, paints & coatings, pharmaceuticals, personal care products, and drilling fluids.
The global sizing & thickening agents market is highly competitive, with a large number of global and regional market players. Agreements, collaborations, joint ventures, acquisitions, expansions, and new product launches are some major strategies adopted by players to achieve growth in the market.
The geographical and application-wise split was determined using secondary sources and verified through primary respondents. Demand in different regions was considered while estimating the share of the different regions in the sizing & thickening agents market. The market estimation was also based on various parameters, such as the number of players, demand trends, supply trends, and the extent of research activity in a particular region. The global sizing & thickening agents market is projected to reach a value of $20.7 Billion by 2020, at a CAGR of 5.7% from 2015.
Sizing & Thickening Agents Market Share (Value), by Application, 2014
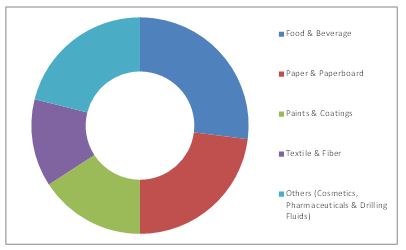
Source: Secondary Data, Primary Interviews, and MarketsandMarkets Analysis
The sizing & thickening agents market is segmented as mentioned below:
By sizing agent type
-
Natural
- Starches
- Rosins
- Others (Cellulosic derivatives, glue and albumen)
-
Synthetic sizing agents
- Polyvinyl alcohol
- Styrene
- Others (Acrylic acids polymer , alkenyl succinic anhydride, alkyl ketene dimer, and modified polyesters)
By thickening agent type
-
Minerals
- Clays
- Silicas
- Others (Ionic Minerals)
-
Hydrocolloids
- Starches
- Cellulose
- Gums
- Gelatin
- Pectin
- Carrageenan
- Others (alginates & derivative & protein thickeners)
-
Others
- - synthetic polymer thickeners
By application
- Food & beverages
- Paper & paperboard
- Paints & coatings
- Textile & fibers
- Others (cosmetics, pharmaceuticals, and drilling fluids)
By region
- North America
- Europe
- Asia-Pacific
- RoW
The global sizing & thickening agents market is projected to reach a value of $20.7 Billion by 2020, at a CAGR of 5.7% from 2015.
The global sizing & thickening agents market is dominated by North America and Europe. Developing countries are the leading exporters of sizing & thickening agents to North America and Europe. European and Middle Eastern countries have been increasing their production of sizing & thickening agents. The Asia-Pacific region is projected to have the highest growth rate of 6.5% from 2015 to 2020. Developments in industries such as paper, textiles, and growing demand for convenience food products in the Asia-Pacific region drive the sizing & thickening agents market.
Starch and starch derivatives are the most common natural sizing agents and polyvinyl alcohol is the most common synthetic polymer used for sizing. Natural starch and its derivatives constitute a large share of the sizing agents used in the global textile industry and could remain the predominant ingredient as a sizing agent as well as in combination with different sizing agents. Synthetic sizing agents are prepared by a combination of chemicals. PVA is used in textile industries as a warp sizing for yarns to prevent breakage during weaving; various grades of PVA are selected for use depending on the yarn, machine type, and other components of the sizing solution.
Thickeners or thickening agents are used to increase the viscosity of solutions. Usually, thickening agents are classified as food-grade thickeners and non-food grade thickeners. Food thickeners are used as additives in the food industry. These food thickeners are required to be approved by various food regulatory bodies.
The food & beverages sector is the dominant application for sizing & thickening agents. Thickening agents are widely used in various food & beverage products. A thickener helps in the modification of texture and viscosity of food systems and enhances their sensory properties. Food thickeners are mostly derived either from polysaccharides such as starches, vegetable gums, and pectin or proteins. The market for natural thickeners, which includes starches and hydrocolloids, is driven by the growing consciousness among consumers for natural products. The increase in prices of hydrocolloids is hindering the growth of the market. Emerging markets, such as China and India, have potential demand for hydrocolloids due to their huge population and increasing consumption of convenience food.
Sizing Agents Market Size, by Type, 2015 Vs. 2019 ($Million)
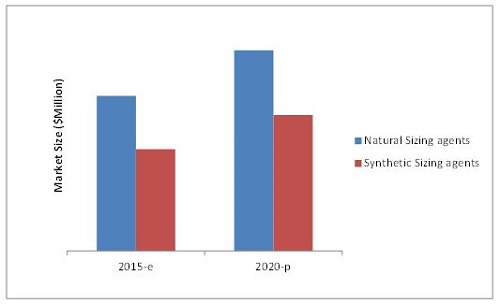
Source: Company Presentations, Company Websites, Secondary Data, Primary Interviews, and MarketsandMarkets Analysis
The figure above depicts the global market size of sizing agents. The natural sizing agents segment dominates, as compared to synthetic sizing agents.
 Exclusive indicates content/data unique to MarketsandMarkets and not available with any competitors.
Table of Contents
1 Introduction
1.1 Objectives of the Study
1.1 Market Definition
1.2 Study Scope
1.3 Markets Covered
1.3.1 Periodization Considered for the Sizing & Thickening Agents Market
1.4 Base Currency Considered for the Sizing & Thickening Agents Market
1.5 Base Unit Considered for the Sizing & Thickening Agents Market
1.6 Stakeholders
1.6.1 the Limitations of the Study are Listed Below:
2 Research Methodology
2.1 Research Data
2.1.1 Secondary Data
2.1.1.1 Key Data From Secondary Sources
2.1.2 Primary Data
2.1.2.1 Key Data From Primary Sources
2.1.2.2 Key Industry Insights
2.1.2.3 Breakdown of Primaries
2.2 Factor Analysis
2.2.1 Introduction
2.2.2 Overview of Parent Industry
2.2.3 Demand-Side Analysis
2.2.3.1 Textile Industry
2.2.3.2 Paper Industry
2.2.3.2 Food Industry
2.2.3.4 Growing Middle-Class Economy
2.2.4 Supply-Side Analysis
2.2.4.1 Majority of Supply of Strach Depends on Maize Crop
2.2.4.2 Maximum Usage Level of Hydrocolloids in Food Products
2.3 Market Size Estimation
2.4 Market Breakdown & Data Triangulation
2.5 Market Share Estimation
2.6 Research Assumptions & Limitations
2.6.1 Assumptions of the Research Study
2.6.2 Limitations of the Research Study
3 Executive Summary
3.1 Sizing & Thickening Agent Market
4 Premium Insights
4.1 Attractive Opportunities in the Sizing & Thickening Agent Market
4.2 Sizing & Thickening Agent Market, By Application
4.3 Sizing & Thickening Agent Market in the North American Region, By Type
4.4 U.S. Dominates the Overall Sizing & Thickening Agents Market
4.5 Sizing & Thickening Agent Market: Developed vs. Emerging Markets
4.6 Hydrocolloids Thickeners Accounted for Largest Share in the Sizing & Thickening Agent Market in 2015
4.7 Sizing & Thickening Agents Market: Life Cycle Analysis, By Region
5 Market Overview
5.1 Introduction
5.2 Evolution of Sizing & Thickening Agents
5.3 Market Segmentation
5.3.1 Sizing & Thickening Agents Market, By Type
5.3.3 Sizing & Thickening Agents Market, By Application
5.3.4 Sizing & Thickening Agents Market, By Region
5.4 Market Dynamics
5.4.1 Drivers
5.4.1.1 Increasing Demand of Sizing & Thickening Agents Due to Wide Industrial Applications
5.4.1.2 Growing Demand for Natural and Clean Label Ingredients in Food & Beverage Industry
5.4.2 Restraints
5.4.2.1 Vulnerability to Seasonal Changes Restricts the Raw Material Availability for Natural Sizing & Thickening Agent Production Ality of Barley and Seasonal Variations
5.4.2.2 Depletion of Mineral Resources Restricts Production of Minerals Thickeners
5.4.2.3 Environmental Concerns
5.4.3 Opportunity
5.4.3.1 Increased Consumption of Convenience Foods
5.4.3.2 Developments in the Economies of Emerging Countries
5.4.4 Challenges
5.4.4.1 Fluctuating Prices of Raw Materials Leading to Uncertainty in the Market
5.4.4.2 Food Additives Approval By Regulatory Bodies
6 Industry Trends
6.1 Introduction
6.2 Value Chain Analysis
6.3 Supply Chain
6.4 Industry Insights
6.5 Porter’s Five Forces Analysis
6.5.1 Threat of New Entrants
6.5.2 Threat of Substitutes
6.5.3 Bargaining Power of Suppliers
6.5.4 Bargaining Power of Buyers
6.5.5 Intensity of Competitive Rivalry
6.6 Pest Analysis
6.6.1 Political/Legal Factors
6.6.1.1 Government Regulations
6.6.2 Economic Factors
6.6.2.1 Fluctuating Raw Material Prices
6.6.3 Social Factors
6.6.3.1 Awareness Varied Applications of Sizing & Thickening Agents
6.6.4 Technological Factors
6.6.4.1 R&D Initiatives
6.7 Strategic Benchmarking
6.7.1 Strategic Acquisitions, Expansions, New Product Launches and Partnerships: Key Strategies Adopted By Leading Companies in the Sizing & Thickening Agents Market
7 Sizing & Thickening Agents Market, By Type
7.1 Introduction
7.2 Sizing Agents Market, By Type
7.2.1 Natural Sizing Agent
7.2.1.1 Starches
7.2.1.2 Rosins
7.2.1.3 Others
7.2.2 Synthetic Sizing Agent
7.2.2.1 Polyvinyl Alcohol
7.2.2.2 Styrene
7.2.2.3 Others
7.3 Thickening Agents Market, By Type
7.3.1 Mineral Thickening Agent
7.3.1.1 Clays
7.3.1.2 Silicas
7.3.1.3 Others
7.3.2 Hydrocolloids Thickening Agents Agent
7.3.2.1 Starches
7.3.2.2 Cellulose
7.3.2.3 Gums
7.3.2.4 Gelatin
7.3.2.5 Pectin
7.3.2.6 Carrageenan
7.3.2.7 Others
8 Sizing & Thickening Agents Market, By Application
8.1 Introduction
8.1.1 Food & Beverages
8.1.2 Paper & Paperboard
8.1.3 Paints & Coatings
8.1.4 Textile & Fiber
8.1.5 Others
9 Sizing & Thickening Agents Market, By Region
9.1 Introduction
9.2 North America
9.2.1 U.S.
9.2.2 Canada
9.2.3 Mexico
9.3 Europe
9.3.1 France.
9.3.2 U.K.
9.3.3 Germany
9.3.1 Spain.
9.3.2 Italy
9.3.3 Rest of Europe
9.4 Asia-Pacific
9.4.1 China
9.4.2 Japan
9.4.3 India
9.4.4 Australia
9.4.5 Rest of Asia-Pacific
9.5 Rest of the World (ROW)
9.5.1 Latin America
9.5.2 The Middle East
9.5.3 Rest of ROW
10 Competitive Landscape
10.1 Overview
10.2 Market Share Analysis
10.3 Competitive Situations & Trends
10.3.1 Acquisitions
10.3.2 Expansions
10.3.3 New Product Launches
10.3.4 Partnership
11 Company Profiles
11.1 Introduction
11.2 ADM
11.3 Ashland
11.4 Cargill, Incorporated
11.5 CP Kelco
11.6 Dupont
11.7 FMC Corp
11.8 Ingredion
11.9 DOW Chemicals
11.10 BASF.
11.11 AKZO Nobel
*Details on Company at A Glance, Recent Financials, Products & Services, Strategies & Insights, & Recent Developments Might Not Be Captured in Case of Unlisted Companies.
12 Appendix
12.1 Insights of Industry Experts
12.2 Discussion Guide
12.3 Available Customizations
12.4 Related Reports
List of Tables (79 Tables)
Table 1 Maximum Usage Level of Guar Gum in Food Products
Table 2 Maximum Usage Level of Polyvinyl Alcohol in Food Products
Table 3 Maximum Usage Level of Gelatin in Food Products
Table 4 Wide Range of Industrial Applications of Sizing & Thickening Agents Driving the Market
Table 5 Seasonal Variations, Depleting Mineral Resources, and Government Regulations Restricting Growth of Sizing & Thickening Agents Market
Table 6 Emerging Markets are Paving New Growth Avenues for Players in Sizing & Thickening Agents Market
Table 7 Industry Insights: Leading Trends Among Key Players
Table 8 Porter’s Impact Analysis Weightage
Table 9 Sizing Agent Market, By Type, 2013-2020 ($Million)
Table 10 Natural Sizing Agent Market, By Subtype, 2013-2020 ($Million)
Table 11 Natural Sizing Agent Market, By Region, 2013-2020 ($Million)
Table 12 Synthetic Sizing Agent, By Subtype, 2013-2020 ($Million)
Table 13 Synthetic Sizing Agent Market, By Region, 2013-2020 ($Million)
Table 14 Thickening Agent Market, By Type, 2013-2020 ($Million)
Table 15 Mineral Thickening Agent Market, By Subtype, 2013-2020 ($Million)
Table 16 Mineral Thickening Agent Market, By Region, 2013-2020 ($Million)
Table 17 Hydrocolloids Market, By Subtype, 2013-2020 ($Million)
Table 18 Hydrocolloids Thickening Agent Market, By Region, 2013-2020 ($Million)
Table 19 Other Thickening Agent Market, By Region, 2013-2020 ($Million)
Table 20 Global Sizing & Thickening Agent Market Size, By Application, 2013-2020 ($Million)
Table 21 Function of Different Types of Hydrocolloids -:
Table 22 Food & Beverage Sizing & Thickening Agent Market Size, By Region, 2013-2020 ($Million)
Table 23 Paper & Paperboard Sizing & Thickening Agent Market Size, By Region, 2013-2020 ($Million)
Table 24 Paints & Coatings Sizing & Thickening Agent Market Size, By Region, 2013-2020 ($Million)
Table 25 Textile & Fiber Sizing & Thickening Agent Market Size, By Region, 2013-2020 ($Million)
Table 26 Other Sizing & Thickening Agent Market Size, By Region, 2013-2020 ($Million)
Table 27 Global Sizing & Thickening Agent Market Size, By Region, 2013–2020 ($Million)
Table 28 Sizing Agent Market, By Region, 2013-2020 ($Million)
Table 29 Thickening Agent Market, By Region, 2013-2020 ($Million)
Table 30 North America: Sizing & Thickening Agent Market Size, By Application, 2013-2020 ($Million)
Table 31 North America: Sizing and Thickening Agent Market, By Type, 2013-2020 ($Million)
Table 32 North America: Sizing Agent Market, By Type, 2013-2020 ($Million)
Table 33 North America: Natural Sizing Agent Market, By Subtype, 2013-2020 ($Million)
Table 34 North America: Synthetic Sizing Agent Market, By Subtype, 2013-2020 ($Million)
Table 35 North America: Thickening Agent Market, By Type, 2013-2020 ($Million)
Table 36 North America: Sizing & Thickening Agent Market, By Country, 2013-2020 ($Million)
Table 37 U.S.: Sizing & Thickening Agent Market Size, By Application, 2013-2020 ($Million)
Table 38 Canada: Sizing & Thickening Agent Market Size, By Application, 2013-2020 ($Million)
Table 39 Mexico: Sizing & Thickening Agent Market Size, By Application, 2013-2020 ($Million)
Table 40 Europe: Sizing & Thickening Agent Market, By Country, 2013-2020 ($Million)
Table 41 Europe: Sizing and Thickning Agent Market, By Type 2013-2020 ($Million)
Table 42 Europe: Sizing Agent Market, By Type 2013-2020 ($Million)
Table 43 Europe: Natural Sizing Agent Market, By Type 2013-2020 ($Million)
Table 44 Europe: Synthetic Sizing Agent Market, By Type 2013-2020 ($Million)
Table 45 Europe: Thickning Agent Market, By Type 2013-2020 ($Million)
Table 46 Europe: Sizing & Thickening Agent Market, By Application, 2013-2020 ($Million)
Table 47 U.K.: Sizing & Thickning Agent Market, By Type 2013-2020 ($Million)
Table 48 Germany: Sizing & Thickening Agent Market Size, By Application, 2013-2020 ($Million)
Table 49 France: Sizing & Thickening Agent Market Size, By Application, 2013-2020 ($Million)
Table 50 Spain: Sizing & Thickening Agent Market Size, By Application, 2013-2020 ($Million)
Table 51 Italy: Sizing & Thickening Agent Market Size, By Application, 2013-2020 ($Million)
Table 52 Other European Countries: Sizing & Thickening Agent Market Size, By Application, 2013-2020 ($Million)
Table 53 Asia-Pacific: Sizing & Thickening Agent Market, By Country, 2013 - 2020 ($Million)
Table 54 Asia-Pacific: Sizing & Thickening Agent Market Size, By Application, 2013-2020 ($Million)
Table 55 Asia-Pacific: Sizing and Thickning Agent Market, By Type 2013-2020 ($Million)
Table 56 Asia-Pacific: Sizing Agent Market, By Type 2013-2020 ($Million)
Table 57 Asia-Pacific: Natural Sizing Agent Market, By Type 2013-2020 ($Million)
Table 58 Asia-Pacific: Synthetic Sizing Agent Market, By Type 2013-2020 ($Million)
Table 59 Asia-Pacific: Thickning Agent Market, By Type 2013-2020 ($Million)
Table 60 China: Sizing & Thickening Agent Market Size, By Application, 2013-2020 ($Million)
Table 61 Japan: Sizing & Thickening Agent Market Size, By Application, 2013-2020 ($Million)
Table 62 India: Sizing & Thickening Agent Market Size, By Application, 2013-2020 ($Million)
Table 63 Australia: Sizing & Thickening Agent Market Size, By Application, 2013-2020 ($Million)
Table 64 Other Asia-Pacific Countries: Sizing & Thickening Agent Market Size, By Application, 2013-2020 ($Million)
Table 65 ROW: Sizing & Thickening Agent Market Size, By Country ($Million)
Table 66 ROW: Sizing & Thickening Agent Market Size, By Application, 2013-2020 ($Million)
Table 67 ROW: Sizing & Thickening Agent Market Size, By Type, 2013-2020 ($Million)
Table 68 ROW: Sizing Agent Market, By Type 2013-2020 ($Million)
Table 69 ROW: Natural Sizing Agent Market, By Type 2013-2020 ($Million)
Table 70 ROW: Synthetic Sizing Agent Market, By Type 2013-2020 ($Million)
Table 71 ROW: Thickning Agent Market, By Type 2013-2020 ($Million)
Table 72 Latin America: Sizing & Thickening Agent Market Size, By Application, 2013-2020 ($Million)
Table 73 The Middle East: Sizing & Thickening Agent Market Size, By Application, 2013-2020 ($Million)
Table 74 Rest of the Countries: Sizing & Thickening Agent Market Size, By Application, 2013-2020 ($Million)
Table 75 New Product & Technology Launches, 2011-2014
Table 76 Expansions & Investment, 2011-2014
Table 77 Agreements, Collaborations & Joint Venture, 2012-2013
Table 78 Acquisitions, 2010-2015
Table 79 BASF SE: Products & Their Description
List of Figures (70 Figures)
Figure 1 Sizing & Thickening Agents Market Segmentation
Figure 2 Sizing & Thickening Agents Market: Research Design
Figure 3 Impact of Key Factors Influencing the Parent Industry
Figure 4 Per Capita Demand for Textile, 2013
Figure 5 Paper Production, By Region, 2013
Figure 6 RTE, Snacks & Savory Products Segments Held ~35% Share in the Food Sector in 2013
Figure 7 Middle-Class Population in Asia-Pacific Is Projected to Grow & Account for Largest Share in Global Market By 2030
Figure 8 Market Size Estimation Methodology: Bottom-Up Approach
Figure 9 Market Size Estimation Methodology: Top-Down Approach
Figure 10 Assumptions of the Research Study
Figure 11 Limitations
Figure 12 Sizing & Thickening Agents Market Snapshot (2015 vs. 2020): Food & Beverages to Maintain Leading Position Till 2020
Figure 13 Sizing & Thickening Agents Market Share ($Million), Regional Overview, 2015
Figure 14 Emerging Economies Offer Attractive Opportunities in the Sizing & Thickening Agents Market
Figure 15 Food & Beverages Segment to Grow at the Highest Rate
Figure 16 Hydrocolloid Thickeners Segment to Dominate the North American Market in 2015
Figure 17 India Is Projected to Be the Fastest-Growing Country-Level Market for Sizing & Thickening Agents
Figure 18 Emerging Economies to Grow Faster Than Developed Markets
Figure 19 Hydrocolloid Thickeners Segment to Dominate the Sizing & Thickening Agents Market in 2014
Figure 20 Sizing & Thickening Agents Market in Asia-Pacific Region to Experience the Highest Growth
Figure 21 Evolution of Sizing & Thickening Agents
Figure 22 Sizing & Thickening Agents Market Segmentation
Figure 23 Hydrocolloid Dominated the Global Thickening Agent Market in 2014
Figure 24 Natural Sizing Agents Dominated the Global Sizing Agent Market in 2014
Figure 25 Processing Contributes Maximum Value to Overall Worth of Sizing and Thickening Agents
Figure 26 Distribution Channel Plays A Vital Role in the Supply Chain of Sizing and Thickening Agents
Figure 27 Porter’s Five Forces Analysis: Strategic Mergers & Acquisitions in Diverse Geographies Have Intensified Industrial Rivalry
Figure 28 Global Strategic Expansion of Key Companies
Figure 29 Hydrocolloid Thickeners Segment Dominated the Sizing & Thickening Agent Market in 2015
Figure 30 Hydrocolloid Thickener to Be the Fastest-Growing in Sizing & Thickening Agent Market Segment By Type Through 2020
Figure 31 North America Captured Largest Market Share for Other Sizing & Thickening Agent , 2015 V/S 2020 ($Million)
Figure 32 Sizing & Thickening Agents in Food & Beverage Market Size, By Region, 2015 vs. 2020
Figure 33 Sizing & Thickening Agents in Food & Beverage Market Size, By Region, 2015 vs. 2020
Figure 34 Paper & Paperboard Sizing & Thickening Agent Market Size, By Region, 2015 vs. 2020 ($Million)
Figure 35 Paints & Coatings Sizing & Thickening Agent Market Size, By Region, 2015 vs. 2020
Figure 36 Textile & Fiber Sizing & Thickening Agent Market Size, By Region, 2015 vs. 2020
Figure 37 Others Sizing & Thickening Agent Market Size, By Region, 2015 vs. 2020
Figure 38 Geographical Snapshot (2015-2020): Asia-Pacific Emerging as A New Hot Spot for Sizing & Thickening Agent
Figure 39 North America Dominated the Global Sizing & Thickening Agent Market 2015 to 2020
Figure 40 U.S. Commands A Lion’s Share of Total North American Market in 2014
Figure 41 Food & Beverage Sector Drives the North American Sizing & Thickening Agent Market ($Million)
Figure 42 Hydrocolloids Dominate the North American Sizing & Thickening Agent Market, By Type ($Million), 2015 -2020
Figure 43 France and Germany LED the European Market for Sizing & Thickening Agents in 2015
Figure 44 Hydrocolloids Is the Fastest Growing Segment in Europe for Sizing & Thickening Agent, 2015-2020
Figure 45 Food & Beverage Is Largest Segment for Sizing & Thickening Agent Market, 2015-2020
Figure 46 Asia-Pacific Sizing & Thickening Agents Market Snapshot: China & India are the Most Lucrative Markets From 2015 to 2020
Figure 47 China LED the Sizing & Thickening Agent Market in Asia-Pacific, ($Million), 2015 vs. 2020
Figure 48 Hydrocolloids Is the Fastest Growing Segment in Asia-Pacific, 2015-2020
Figure 49 Investments By Major Players has Been Driving the Market in Latin America, 2015 vs. 2020
Figure 50 Paper & Paper Board Is the Fastest Growing Sector for Sizing & Thickening Agent Market in ROW, 2015 vs. 2020
Figure 51 Companies Adopted Expansion as the Key Growth Strategy
Figure 52 Sizing & Thickening Agents Market Share, By Key Player, 2014
Figure 53 Expansions Have Fueled Growth Between 2010 to 2014
Figure 54 Battle for Market Share: Expansions & Investments Was the Key Strategy
Figure 55 Geographical Revenue Mix of Top Five Players
Figure 56 Business Overview: Archer Daniels Midland Company
Figure 57 Cargill Inc.: Business Overview
Figure 58 Cargill Inc.: SWOT Analysis
Figure 59 Du Pont: Business Overview
Figure 60 SWOT Analysis
Figure 61 BASF SE: SWOT Analysis
Figure 62 The DOW Chemical Company: Business Overview
Figure 63 The DOW Chemical Company: SWOT Analysis
Figure 64 AKZO Nobel.: Business Overview
Figure 65 SWOT Analysis
Figure 66 Ashland Inc.: Business Overview
Figure 67 SWOT Analysis
Figure 68 FMC Corporation: Business Overview
Figure 69 FMC Corporation: SWOT Analysis
Figure 70 Ingredion Incorporation: Business Overview


Growth opportunities and latent adjacency in Sizing & Thickening Agents Market