Shell & Tube Heat Exchanger Market

Shell & Tube Heat Exchanger Market by Material (Steel, Nickel & Nickel Alloys, Titanium, Tantalum), Application (Chemicals, Petrochemicals, HVAC & Refrigeration, Food & Beverages, Power Generation, Pulp & Paper), and Region - Global Forecast to 2027

Report Code: CH 4047 Nov, 2022, by marketsandmarkets.com

Updated on : March 20, 2024

Shell & Tube Heat Exchanger Market

The global shell & tube heat exchanger market size was valued at USD 9.0 billion in 2022 and is projected to reach USD 11.7 billion by 2027, growing at 5.4% cagr from 2022 to 2027. Increasing demand for shell & tube heat exchanger from emerging markets and rising demand for HVACR equipment are driving the market.

Attractive Opportunities in the Shell & Tube Heat Exchanger Market
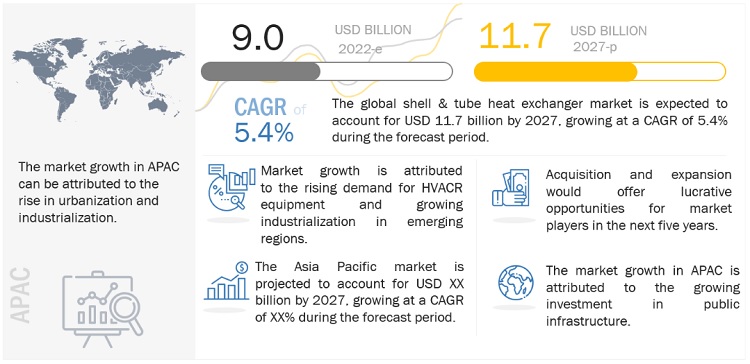
Shell & Tube Heat Exchangers Market

Note: e-estimated p-projected.

Source: Expert Interviews, Secondary Sources, and MarketsandMarkets Analysis

To know about the assumptions considered for the study, Request for Free Sample Report

Shell & Tube Heat Exchanger Market Dynamics

Driver: Growing industrialization in emerging regions

The shell & tube heat exchangers demand from the developing economies of Asia Pacific including China and India is increasing, owing to rapid industrialization, raw material prices, and low-cost labor. The increasing investments in manufacturing, commercial, and industrial projects in the region have contributed to the overall expansion of the heat exchangers market. The shell & tube heat exchangers market in Asia Pacific is expected grow at a high growth rate, due to increasing demand from the chemical, HVAC, petrochemical, food & beverage, and oil & gas industries. According to the International Energy Agency (IEA), Asia Pacific accounts for more than 50% of the global petrochemical production. Further, many major manufacturers are expanding their manufacturing plants across Asia Pacific to capitalize on the opportunity in the emerging economies of the region. According to the India Brand Equity Foundation, the demand for chemicals in India is expected to expand by 9% per annum and the chemical industry is projected to contribute USD 300 billion to the country’s GDP by 2025.

According to BP statistical review of World Energy 2022, China’s nuclear power generation was 407.7 TW-hour in 2021, and natural gas production increased by 8.1% to 209.2 billion cubic meters, which will have a significant impact on the shell & tube heat exchangers market in China, as power and oil & gas industries widely utilize shell & tube heat exchangers. The food & beverage industry in Asia Pacific is also expected to grow at a high growth rate owing to the rising urbanization, growing population, and rising disposable income of the middle-class population. The growth in these end use industries will drive the shell & tube heat exchangers market.

Restraint: Volatility in raw material prices

The fluctuation in raw material prices of copper, aluminium, steel, and other metals used for the manufacturing of shell & tube heat exchangers have contributed to the overall increase in the manufacturing cost and time. Many manufactures struggle in estimating the exact manufacturing cost of equipment owing to the uncertainty in the raw material prices. The pricing of these metals is dependent on various factors such as economic conditions, exchange rates, supply conditions, mining policies, processing of the raw materials, and others. Moreover, volatility in prices may increase the customer cost of operating business, resulting in delay or cancelation of large capital projects, which affects the profitability of the manufacturers.

Due to high cost and restricted availability of quality raw materials such as ferrous and nonferrous materials, manufactures shift to cheaper materials that affect the performance and efficiency of the equipment. Such actions reduce the longevity of shell & tube heat exchangers and increase maintenance cost. The price fluctuations or increase in tariffs and shortage of materials create an adverse effect on manufacturers as they may not be able to provide competitive pricing. Manufacturers are also engaged in long-term supplier contracts that may increase their exposure to pricing fluctuations. However, to manage the risk associated with pricing fluctuation, companies closely monitor the pricing trends to slightly overcome the risk related to pricing.

Opportunity: Growing aftermarket for shell & tube heat exchangers

A heat exchanger is a critical component in any process industry and its performance and longevity has direct impact not only on the capital cost, but also on operating costs. Breakdown maintenance is always costly; thus, regular maintenance of shell & tube heat exchangers is crucial, which can be relatively lower compared to rotating equipment such as pumps and compressors. Heat exchanger maintenance is important to ensure continuous production and system uptime for avoiding its sudden failure. The cost of prevention is normally lower than emergency repairs.

The process fluids and utility fluids in shell & tube heat exchangers generate scale and deposits due to high dissolved solid content and suspended colloidal solids that adhere to the heat transfer surface. These scale and deposits impact the heat exchange rate and leads to corrosion, erosion, scaling, or fouling in the heat exchangers. Well-planned maintenance of shell & tube heat exchangers helps companies in saving energy and reducing operational costs by up to 30%. Maintenance helps avoid pressure drops on the system, requiring less load on the pumps and other components. This helps in lowering energy consumption while increasing the heat transfer rate and operational efficiency. Regular maintenance of shell & tube heat exchangers has several other benefits, such as improved performance and efficiency, energy conservation, environment protection, and cost reductions. However, maintenance of plate type heat exchangers is much easier as compared to shell & tube. The shell & tube heat exchangers create a huge aftermarket for shell & tube heat exchangers manufactures, wherein, they can sell spare parts, such as gaskets, seals, tubes, and other components and take service contracts for cleaning and maintenance of shell & tube heat exchangers.

Challenge: High capital cost

The shell & tube heat exchangers market is very capital intensive to enter and operate. Heavy investments are required in setting up sophisticated manufacturing processes. Manufacturers are required to invest huge capital in R&D to develop innovative and consumer-centric products. Consumers have specific requirements depending upon their application area. Manufacturers must address these requirements with minimal operating and production costs. Furthermore, shell & tube heat exchangers manufacturers are required to produce products as per the needs of the end consumers, which further increases the capital required. In the manufacturing of heat exchangers, the grade of materials, heat transfer rate, refrigerant charge, and other factors such as volume and durability are crucial parameters for manufacturers. Established manufacturers invest significant amount of their revenue in R&D activities. However, local manufacturers offer products at lower costs, which creates credibility issues for the bigger players and increases market competition.

The heat exchangers industry being capital-intensive in nature, many small players are discouraged from entering the business. The initial investment cost for setting up HVAC systems including shell & tube heat exchangers in end applications is very high for small players. Moreover, the existing players are more dominant in the market, which makes it difficult for the new entrants to establish high-cost manufacturing units and market their products. Thus, the high capital cost for setting up new plants affects the growth of the shell & tube heat exchanger market. Shell & tube heat exchanger:

ECOSYSTEM


COMPANY

ROLE IN ECOSYSTEM

Baosteel Group

Raw Material

Rio Tinto Group

Raw Material

BHP

Raw Material

Alfa Laval

Product Manufacturing

Koch Heat Transfer Company

Product Manufacturing

Xylem Inc.

Product Manufacturing

Benns Industrial Solutions

Distribution

Valutech Inc.

Distribution

Source: Company Websites and MarketsandMarkets Analysis

In terms of value, the petrochemicals and oil & gas segment is projected to account for the second largest share of the shell & tube heat exchanger market, by application, during the forecast period.

The petrochemicals and oil & gas segment accounted for a share of 17.7% in terms of value, of the overall shell & tube heat exchanger market in 2021. Typical applications for shell & tube heat exchangers in the oil & gas industry include crude oil dehydration/stabilization, gas cooling and condensing, gas sweetening, gas dehydration, regasification, gas sweetening, and utility cooling. According to the International Energy Agency, by 2026, global oil consumption is projected to reach 104.1 million barrels per day which is expected to drive the demand for heat exchangers in the oil & gas industry. Furthermore, with increasing global population, the demand for energy as well as the products manufactured from oil and gas is projected to increase.

Steel raw material segment is projected to account for one of the fastest growth of the shell & tube heat exchanger market, by material, during the forecast period

Based on material, the steel dominated the market. Shell & tube heat exchangers are made of variety of steel grades. Super duplex steel has excellent weld-ability characteristics, and strong machinability capabilities. It provides excellent resistance to corrosion by oxidation. Super duplex steel contains 25% chromium, 7% nickel and 4% molybdenum. The higher percentage of these metals gives enhanced resistance to corrosions. It is more expensive than duplex steel due to their high percentage of nickel.

APAC is expected to be the fastest-growing market during the forecast period.

Based on region, Asia Pacific is a key market to produce shell & tube heat exchanger and is projected to grow at a CAGR of 7.6% in terms of value during the forecasted period. The availability of low-cost raw materials and labour, coupled with growing industrialization, makes the region an attractive investment destination for shell & tube heat exchanger manufacturers. The rising population, urbanization, and industrialization are some of the factors that will drive the shell & tube heat exchanger market in this region.
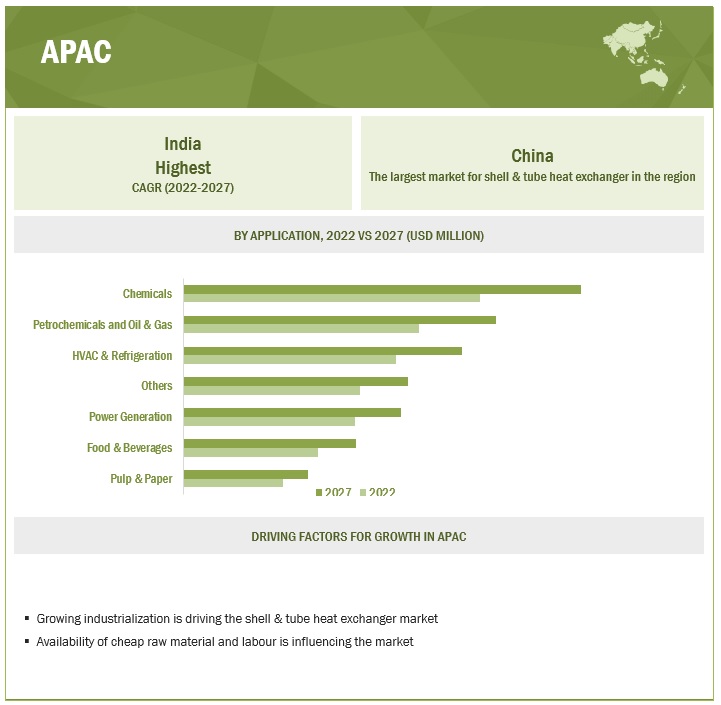
Shell & Tube Heat Exchangers Market by Region

To know about the assumptions considered for the study, download the pdf brochure

Key Market Players

Major players operating in the global shell & tube heat exchanger market include Alfa Laval AB (Sweden), HRS Heat Exchangers (UK), Kelvion (Germany), Xylem (US), API Heat Transfer (US), Koch Heat Transfer (US), Thermex (UK), Manning and Lewis (US), Thermofin (Canada), and Mersen (France)

Get online access to the report on the World's First Market Intelligence Cloud

  • Easy to Download Historical Data & Forecast Numbers
  • Company Analysis Dashboard for high growth potential opportunities
  • Research Analyst Access for customization & queries
  • Competitor Analysis with Interactive dashboard
  • Latest News, Updates & Trend analysis
Request Sample

Scope of the Report

Report Metric

Details

Years considered for the study

2018–2027

Base year

2021

Forecast period

2022–2027

Units considered

Value (USD Million/Billion), Units

Segments

Material, Application, and Region

Regions

North America, Europe, Asia Pacific, South America, and Middle East & Africa

Companies

Alfa Laval AB (Sweden), HRS Heat Exchangers (UK), Kelvion (Germany), Xylem (US), API Heat Transfer (US), Koch Heat Transfer (US), Thermex (UK), Manning and Lewis (US), Thermofin (Canada), and Mersen (France).

This research report categorizes the shell & tube heat exchanger market based on type, application, and region.

Based on Material:
  • Steel
  • Nickel & Nickel Alloys
  • Titanium
  • Tantalum
  • Others
Based on Application:
  • Chemicals
  • Petrochemicals and Oil & Gas
  • HVAC & Refrigeration
  • Food & Beverages
  • Power Generation
  • Pulp & Paper
  • Others
Based on Region:
  • Asia Pacific
  • Europe
  • North America
  • South America
  • Middle East & Africa

Recent Developments

  • In Sep 2018, Kelvion combined its double tube safety technology with its compact fin system to produce the new ComFin Safety heat exchanger. The benefits are optimized energy efficiency, small footprint, and efficient performance due to enlarged surface through fins. The product can be used in various industries such as power, marine and heavy industry.
  • In Oct 2021, Kelvion is expanding its, The Port of Catoosa site, to meet the growing demand in the North American market. The company investment of USD 6 million will increase manufacturing and create jobs.

Frequently Asked Questions (FAQ):

To speak to our analyst for a discussion on the above findings, click Speak to Analyst

TABLE OF CONTENTS
 
1 INTRODUCTION (Page No. - 25)
    1.1 STUDY OBJECTIVES 
    1.2 MARKET DEFINITION 
           1.2.1 INCLUSIONS & EXCLUSIONS
    1.3 MARKET SCOPE 
           1.3.1 REGIONS COVERED
    1.4 YEARS CONSIDERED 
    1.5 CURRENCY CONSIDERED 
    1.6 UNIT CONSIDERED 
    1.7 STAKEHOLDERS 
    1.8 SUMMARY OF CHANGES 
 
2 RESEARCH METHODOLOGY (Page No. - 29)
    2.1 RESEARCH DATA 
          FIGURE 1 SHELL & TUBE HEAT EXCHANGER MARKET: RESEARCH DESIGN
           2.1.1 SECONDARY DATA
                    2.1.1.1 Key data from secondary sources
           2.1.2 PRIMARY DATA
                    2.1.2.1 Key data from primary sources
                    2.1.2.2 Primary interviews – demand and supply sides
                    2.1.2.3 Key industry insights
                    2.1.2.4 Breakdown of primary interviews
    2.2 MARKET SIZE ESTIMATION 
           2.2.1 BOTTOM-UP APPROACH
                    FIGURE 2 SHELL & TUBE HEAT EXCHANGER MARKET: BOTTOM-UP APPROACH
           2.2.2 TOP-DOWN APPROACH
                    FIGURE 3 SHELL & TUBE HEAT EXCHANGER MARKET: TOP-DOWN APPROACH
                    FIGURE 4 MARKET SIZE ESTIMATION: SHELL & TUBE HEAT EXCHANGER MARKET TOP-DOWN APPROACH
    2.3 FORECAST NUMBER CALCULATION 
          FIGURE 5 DEMAND-SIDE FORECAST PROJECTIONS
    2.4 DATA TRIANGULATION 
          FIGURE 6 SHELL & TUBE HEAT EXCHANGER MARKET: DATA TRIANGULATION
    2.5 FACTOR ANALYSIS 
    2.6 RESEARCH ASSUMPTIONS 
    2.7 LIMITATIONS AND MARKET RISKS 
 
3 EXECUTIVE SUMMARY (Page No. - 38)
    FIGURE 7 STEEL SEGMENT TO LEAD MARKET DURING FORECAST PERIOD
    FIGURE 8 CHEMICAL SEGMENT TO DOMINATE MARKET BETWEEN 2022 AND 2027
    FIGURE 9 EUROPE ACCOUNTED FOR LARGEST SHARE IN 2021
 
4 PREMIUM INSIGHTS (Page No. - 40)
    4.1 SIGNIFICANT OPPORTUNITIES FOR PLAYERS IN SHELL & TUBE HEAT EXCHANGER MARKET 
          FIGURE 10 HIGH GROWTH POTENTIAL IN ASIA PACIFIC
    4.2 ASIA PACIFIC: SHELL & TUBE HEAT EXCHANGER MARKET, BY APPLICATION AND COUNTRY 
          FIGURE 11 CHEMICAL SEGMENT AND CHINA LED MARKET IN ASIA PACIFIC
    4.3 SHELL & TUBE HEAT EXCHANGER MARKET, BY APPLICATION 
          FIGURE 12 CHEMICAL SEGMENT TO LEAD MARKET IN TERMS OF UNITS
    4.4 SHELL & TUBE HEAT EXCHANGER MARKET, BY COUNTRY 
          FIGURE 13 INDIA TO BE FASTEST-GROWING MARKET DURING FORECAST PERIOD
 
5 MARKET OVERVIEW (Page No. - 42)
    5.1 INTRODUCTION 
    5.2 MARKET DYNAMICS 
          FIGURE 14 DRIVERS, RESTRAINTS, OPPORTUNITIES, AND CHALLENGES IN SHELL & TUBE HEAT EXCHANGER MARKET
           5.2.1 DRIVERS
                    5.2.1.1 Growing industrialization in emerging economies
                    5.2.1.2 Stringent environmental and energy efficiency regulations
                    5.2.1.3 Rising demand for HVACR equipment
           5.2.2 RESTRAINTS
                    5.2.2.1 Volatility in raw material prices
                    5.2.2.2 Increasing demand for plate & frame heat exchangers
           5.2.3 OPPORTUNITIES
                    5.2.3.1 Growing aftermarket for shell & tube heat exchangers
                    5.2.3.2 Rising nuclear power plants driving demand
                              TABLE 1 NUCLEAR ENERGY CONSUMPTION, BY REGION, 2017–2021 (EXAJOULES)
           5.2.4 CHALLENGES
                    5.2.4.1 High capital cost
    5.3 VALUE CHAIN 
          FIGURE 15 VALUE CHAIN ANALYSIS
           5.3.1 RAW MATERIAL SUPPLIERS
           5.3.2 SHELL & TUBE HEAT EXCHANGER MANUFACTURERS
           5.3.3 DISTRIBUTORS
           5.3.4 END CONSUMERS
    5.4 PORTER’S FIVE FORCES ANALYSIS 
          FIGURE 16 PORTER’S FIVE FORCES ANALYSIS
           5.4.1 THREAT OF NEW ENTRANTS
           5.4.2 THREATS OF SUBSTITUTES
           5.4.3 BARGAINING POWER OF SUPPLIERS
           5.4.4 BARGAINING POWER OF BUYERS
           5.4.5 INTENSITY OF COMPETITIVE RIVALRY
                    TABLE 2 SHELL & TUBE HEAT EXCHANGER MARKET: PORTER’S FIVE FORCES ANALYSIS
    5.5 ECOSYSTEM 
          FIGURE 17 ECOSYSTEM OF SHELL & TUBE HEAT EXCHANGER MARKET
          TABLE 3 SHELL & TUBE HEAT EXCHANGER MARKET: ECOSYSTEM
    5.6 PATENTS ANALYSIS 
           5.6.1 INTRODUCTION
           5.6.2 METHODOLOGY
           5.6.3 DOCUMENT TYPE
                    TABLE 4 GRANTED PATENTS ACCOUNT FOR 7% OF TOTAL COUNT IN LAST 10 YEARS
                    FIGURE 18 PUBLICATION TRENDS OVER LAST TEN YEARS
           5.6.4 INSIGHTS
           5.6.5 LEGAL STATUS OF PATENTS
                    FIGURE 19 PATENT ANALYSIS, BY LEGAL STATUS
           5.6.6 JURISDICTION ANALYSIS
                    FIGURE 20 TOP JURISDICTION-BY DOCUMENT
           5.6.7 TOP COMPANIES/APPLICANTS
                    FIGURE 21 TOP COMPANIES/APPLICANTS WITH HIGHEST NUMBER OF PATENTS
                    TABLE 5 PATENTS BY CARRIER CORPORATION
                    TABLE 6 PATENTS BY KOCH HEAT TRANSFER COMPANY
                    TABLE 7 PATENTS BY HAMILTON SUNDSTRAND CORPORATION
                    TABLE 8 TOP 10 PATENT OWNERS (US) IN LAST 10 YEARS
    5.7 TRADE ANALYSIS 
           5.7.1 IMPORT-EXPORT SCENARIO OF SHELL & TUBE HEAT EXCHANGER MARKET
                    TABLE 9 IMPORT TRADE DATA FOR HEAT-EXCHANGE UNITS (EXCLUDING INSTANTANEOUS HEATERS, STORAGE WATER HEATERS, BOILERS, AND EQUIPMENT WITHOUT A SEPARATING WALL)
                    TABLE 10 EXPORT TRADE DATA FOR HEAT-EXCHANGE UNITS (EXCLUDING INSTANTANEOUS HEATERS, STORAGE WATER HEATERS, BOILERS, AND EQUIPMENT WITHOUT A SEPARATING WALL)
    5.8 CASE STUDIES 
           5.8.1 SACOME
           5.8.2 HRS HEAT EXCHANGERS LTD.
    5.9 MACROECONOMIC DATA 
           5.9.1 POWER GENERATION
                    TABLE 11 POWER GENERATION, BY COUNTRY (TWH)
           5.9.2 CHEMICAL SALES
                    TABLE 12 CHEMICAL SALES, 2020 (USD BILLION)
    5.10 TRENDS/DISRUPTIONS IMPACTING CUSTOMER BUSINESS 
           FIGURE 22 ENERGY EFFICIENCY TO INFLUENCE SHELL & TUBE HEAT EXCHANGER MARKET
    5.11 KEY CONFERENCES & EVENTS IN 2022–2023 
           TABLE 13 SHELL & TUBE HEAT EXCHANGER MARKET: DETAILED LIST OF CONFERENCES & EVENTS
    5.12 KEY FACTORS AFFECTING BUYING DECISIONS 
           5.12.1 QUALITY
           5.12.2 SERVICE
                     FIGURE 23 KEY BUYING CRITERIA
    5.13 REGULATORY FRAMEWORKS 
           5.13.1 ASIA PACIFIC
           5.13.2 EUROPE
           5.13.3 NORTH AMERICA
                    5.13.3.1 US
                    5.13.3.2 Canada
           5.13.4 TUBULAR EXCHANGERS MANUFACTURERS ASSOCIATION (TEMA) STANDARDS
                     TABLE 14 LIST OF REGULATORY BODIES, GOVERNMENT AGENCIES, AND OTHER ORGANIZATIONS
    5.14 AVERAGE SELLING PRICE ANALYSIS 
           5.14.1 AVERAGE SELLING PRICE BASED ON REGION
                     FIGURE 24 AVERAGE SELLING PRICE, BY REGION (USD/UNIT)
           5.14.2 AVERAGE SELLING PRICE BASED ON APPLICATION
                     TABLE 15 AVERAGE SELLING PRICES BASED ON APPLICATION (USD/UNIT)
           5.14.3 AVERAGE SELLING PRICE, BY TOP 3 MARKET PLAYERS
                     FIGURE 25 AVERAGE SELLING PRICE, BY TOP 3 MARKET PLAYERS (USD/UNIT)
    5.15 TECHNOLOGY ANALYSIS 
           5.15.1 HELICAL BAFFLE HEAT EXCHANGER
           5.15.2 EXPANDED METAL BAFFLES
           5.15.3 TWISTED TUBE HEAT EXCHANGER
 
6 SHELL & TUBE HEAT EXCHANGER MARKET, BY FLOW TYPE (Page No. - 67)
    6.1 INTRODUCTION 
    6.2 PARALLEL FLOW 
    6.3 CROSS FLOW 
    6.4 COUNTER FLOW 
 
7 SHELL & TUBE HEAT EXCHANGER MARKET, BY MATERIAL (Page No. - 68)
    7.1 INTRODUCTION 
          FIGURE 26 STEEL SEGMENT TO LEAD SHELL & TUBE HEAT EXCHANGER MARKET
          TABLE 16 SHELL & TUBE HEAT EXCHANGER MARKET SIZE, BY MATERIAL, 2018–2021 (USD MILLION)
          TABLE 17 SHELL & TUBE HEAT EXCHANGER MARKET SIZE, BY MATERIAL, 2022–2027 (USD MILLION)
    7.2 STEEL 
    7.3 NICKEL & NICKEL ALLOYS 
    7.4 TITANIUM 
    7.5 TANTALUM 
    7.6 HASTELLOY 
    7.7 OTHERS 
 
8 SHELL & TUBE HEAT EXCHANGER MARKET, BY APPLICATION (Page No. - 73)
    8.1 INTRODUCTION 
          TABLE 18 SHELL & TUBE HEAT EXCHANGER MARKET, BY APPLICATION, 2018–2021 (UNIT)
          TABLE 19 SHELL & TUBE HEAT EXCHANGER MARKET, BY APPLICATION, 2022–2027 (UNIT)
          TABLE 20 SHELL & TUBE HEAT EXCHANGER MARKET, BY APPLICATION, 2018–2021 (USD MILLION)
          TABLE 21 SHELL & TUBE HEAT EXCHANGER MARKET, BY APPLICATION, 2022–2027 (USD MILLION)
    8.2 CHEMICALS 
           8.2.1 LEADING CONSUMER OF SHELL & TUBE HEAT EXCHANGERS
    8.3 PETROCHEMICALS AND OIL & GAS 
           8.3.1 USED FOR HEAT RECOVERY AND GENERATING EFFECTIVE HEAT ENERGY
    8.4 HVAC & REFRIGERATION 
           8.4.1 REQUIRES HIGH-PERFORMANCE AND CUSTOMIZED HEAT EXCHANGERS
    8.5 FOOD & BEVERAGES 
           8.5.1 USED IN FOOD PROCESSING, DAIRY PROCESSING, AND BEVERAGE PROCESSING APPLICATIONS
    8.6 POWER GENERATION 
           8.6.1 PROVIDES COST-EFFECTIVE TOOL FOR WASTE HEAT RECOVERY
    8.7 PULP & PAPER 
           8.7.1 USED FOR HEAT RECOVERY AND WASTEWATER TREATMENT
    8.8 OTHERS 
 
9 SHELL & TUBE HEAT EXCHANGER MARKET, BY REGION (Page No. - 80)
    9.1 INTRODUCTION 
          FIGURE 28 INDIA TO BE FASTEST-GROWING MARKET DURING FORECAST PERIOD
          TABLE 22 SHELL & TUBE HEAT EXCHANGER MARKET SIZE, BY REGION, 2018–2021 (UNIT)
          TABLE 23 SHELL & TUBE HEAT EXCHANGER MARKET SIZE, BY REGION, 2022–2027 (UNIT)
          TABLE 24 SHELL & TUBE HEAT EXCHANGER MARKET SIZE, BY REGION, 2018–2021 (USD MILLION)
          TABLE 25 SHELL & TUBE HEAT EXCHANGER MARKET SIZE, BY REGION, 2022–2027 (USD MILLION)
    9.2 ASIA PACIFIC 
          FIGURE 29 ASIA PACIFIC: SHELL & TUBE HEAT EXCHANGER MARKET SNAPSHOT
          TABLE 26 ASIA PACIFIC: SHELL & TUBE HEAT EXCHANGER MARKET SIZE, BY COUNTRY, 2018–2021 (UNIT)
          TABLE 27 ASIA PACIFIC: SHELL & TUBE HEAT EXCHANGER MARKET SIZE, BY COUNTRY, 2022–2027 (UNIT)
          TABLE 28 ASIA PACIFIC: SHELL & TUBE HEAT EXCHANGER MARKET SIZE, BY COUNTRY, 2018–2021 (USD MILLION)
          TABLE 29 ASIA PACIFIC: SHELL & TUBE HEAT EXCHANGER MARKET SIZE, BY COUNTRY, 2022–2027 (USD MILLION)
          TABLE 30 ASIA PACIFIC: SHELL & TUBE HEAT EXCHANGER MARKET SIZE, BY MATERIAL, 2018–2021 (USD MILLION)
          TABLE 31 ASIA PACIFIC: SHELL & TUBE HEAT EXCHANGER MARKET SIZE, BY MATERIAL, 2022–2027 (USD MILLION)
          TABLE 32 ASIA PACIFIC: SHELL & TUBE HEAT EXCHANGER MARKET SIZE, BY APPLICATION, 2018–2021 (UNIT)
          TABLE 33 ASIA PACIFIC: SHELL & TUBE HEAT EXCHANGER MARKET SIZE, BY APPLICATION, 2022–2027 (UNIT)
          TABLE 34 ASIA PACIFIC: SHELL & TUBE HEAT EXCHANGER MARKET SIZE, BY APPLICATION, 2018–2021 (USD MILLION)
          TABLE 35 ASIA PACIFIC: SHELL & TUBE HEAT EXCHANGER MARKET SIZE, BY APPLICATION, 2022–2027 (USD MILLION)
           9.2.1 CHINA
                    9.2.1.1 Availability of low-cost labor and cheap raw materials
                                TABLE 36 CHINA: SHELL & TUBE HEAT EXCHANGER MARKET SIZE, BY APPLICATION, 2018–2021 (USD MILLION)
                                TABLE 37 CHINA: SHELL & TUBE HEAT EXCHANGER MARKET SIZE, BY APPLICATION, 2022–2027 (USD MILLION)
           9.2.2 JAPAN
                    9.2.2.1 Significant demand from chemical industry
                                TABLE 38 JAPAN: SHELL & TUBE HEAT EXCHANGER MARKET SIZE, BY APPLICATION, 2018–2021 (USD MILLION)
                                TABLE 39 JAPAN: SHELL & TUBE HEAT EXCHANGER MARKET SIZE, BY APPLICATION, 2022–2027 (USD MILLION)
           9.2.3 INDIA
                    9.2.3.1 Urbanization and industrialization to impact market growth
                                TABLE 40 INDIA: SHELL & TUBE HEAT EXCHANGER MARKET SIZE, BY APPLICATION, 2018–2021 (USD MILLION)
                                TABLE 41 INDIA: SHELL & TUBE HEAT EXCHANGER MARKET SIZE, BY APPLICATION, 2022–2027 (USD MILLION)
           9.2.4 SOUTH KOREA
                    9.2.4.1 Investment in energy sources to drive market
                                TABLE 42 SOUTH KOREA: SHELL & TUBE HEAT EXCHANGER MARKET SIZE, BY APPLICATION, 2018–2021 (USD MILLION)
                                TABLE 43 SOUTH KOREA: SHELL & TUBE HEAT EXCHANGER MARKET SIZE, BY APPLICATION, 2022–2027 (USD MILLION)
           9.2.5 REST OF ASIA PACIFIC
                    TABLE 44 REST OF ASIA PACIFIC: SHELL & TUBE HEAT EXCHANGER MARKET SIZE, BY APPLICATION, 2018–2021 (USD MILLION)
                    TABLE 45 REST OF ASIA PACIFIC: SHELL & TUBE HEAT EXCHANGER MARKET SIZE, BY APPLICATION, 2022–2027 (USD MILLION)
    9.3 EUROPE 
          FIGURE 30 EUROPE: SHELL & TUBE HEAT EXCHANGER MARKET SNAPSHOT
          TABLE 46 EUROPE: SHELL & TUBE HEAT EXCHANGER MARKET SIZE, BY COUNTRY, 2018–2021 (UNIT)
          TABLE 47 EUROPE: SHELL & TUBE HEAT EXCHANGER MARKET SIZE, BY COUNTRY, 2022–2027 (UNIT)
          TABLE 48 EUROPE: SHELL & TUBE HEAT EXCHANGER MARKET SIZE, BY COUNTRY, 2018–2021 (USD MILLION)
          TABLE 49 EUROPE: SHELL & TUBE HEAT EXCHANGER MARKET SIZE, BY COUNTRY, 2022–2027 (USD MILLION)
          TABLE 50 EUROPE: SHELL & TUBE HEAT EXCHANGER MARKET SIZE, BY MATERIAL, 2018–2021 (USD MILLION)
          TABLE 51 EUROPE: SHELL & TUBE HEAT EXCHANGER MARKET SIZE, BY MATERIAL, 2022–2027 (USD MILLION)
          TABLE 52 EUROPE: SHELL & TUBE HEAT EXCHANGER MARKET SIZE, BY APPLICATION, 2018–2021 (UNIT)
          TABLE 53 EUROPE: SHELL & TUBE HEAT EXCHANGER MARKET SIZE, BY APPLICATION, 2022–2027 (UNIT)
          TABLE 54 EUROPE: SHELL & TUBE HEAT EXCHANGER MARKET SIZE, BY APPLICATION, 2018–2021 (USD MILLION)
          TABLE 55 EUROPE: SHELL & TUBE HEAT EXCHANGER MARKET SIZE, BY APPLICATION, 2022–2027 (USD MILLION)
           9.3.1 GERMANY
                    9.3.1.1 Energy transition to drive market
                                TABLE 56 GERMANY: SHELL & TUBE HEAT EXCHANGER MARKET SIZE, BY APPLICATION, 2018–2021 (USD MILLION)
                                TABLE 57 GERMANY: SHELL & TUBE HEAT EXCHANGER MARKET SIZE, BY APPLICATION, 2022–2027 (USD MILLION)
           9.3.2 UK
                    9.3.2.1 R&D expenditure in chemical industry to boost market
                                TABLE 58 UK: SHELL & TUBE HEAT EXCHANGER MARKET SIZE, BY APPLICATION, 2018–2021 (USD MILLION)
                                TABLE 59 UK: SHELL & TUBE HEAT EXCHANGER MARKET SIZE, BY APPLICATION, 2022–2027 (USD MILLION)
           9.3.3 FRANCE
                    9.3.3.1 Chemical exports to influence market growth
                                TABLE 60 FRANCE: SHELL & TUBE HEAT EXCHANGER MARKET SIZE, BY APPLICATION, 2018–2021 (USD MILLION)
                                TABLE 61 FRANCE: SHELL & TUBE HEAT EXCHANGER MARKET SIZE, BY APPLICATION, 2022–2027 (USD MILLION)
           9.3.4 ITALY
                    9.3.4.1 Growing number of chemical manufacturers to drive growth
                                TABLE 62 ITALY: SHELL & TUBE HEAT EXCHANGER MARKET SIZE, BY APPLICATION, 2018–2021 (USD MILLION)
                                TABLE 63 ITALY: SHELL & TUBE HEAT EXCHANGER MARKET SIZE, BY APPLICATION, 2022–2027 (USD MILLION)
           9.3.5 SPAIN
                    9.3.5.1 Chemical sector to boost demand for shell & tube heat exchangers
                                TABLE 64 SPAIN: SHELL & TUBE HEAT EXCHANGER MARKET SIZE, BY APPLICATION, 2018–2021 (USD MILLION)
                                TABLE 65 SPAIN: SHELL & TUBE HEAT EXCHANGER MARKET SIZE, BY APPLICATION, 2022–2027 (USD MILLION)
           9.3.6 TURKEY
                    9.3.6.1 Significant contribution due to strategic European positioning to drive market
                                TABLE 66 TURKEY: SHELL & TUBE HEAT EXCHANGER MARKET SIZE, BY APPLICATION, 2018–2021 (USD MILLION)
                                TABLE 67 TURKEY: SHELL & TUBE HEAT EXCHANGER MARKET SIZE, BY APPLICATION, 2022–2027 (USD MILLION)
           9.3.7 REST OF EUROPE
                    TABLE 68 REST OF EUROPE: SHELL & TUBE HEAT EXCHANGER MARKET SIZE, BY APPLICATION, 2018–2021 (USD MILLION)
                    TABLE 69 REST OF EUROPE: SHELL & TUBE HEAT EXCHANGER MARKET SIZE, BY APPLICATION, 2022–2027 (USD MILLION)
    9.4 NORTH AMERICA 
          FIGURE 31 NORTH AMERICA: SHELL & TUBE HEAT EXCHANGER MARKET SNAPSHOT
          TABLE 70 NORTH AMERICA: SHELL & TUBE HEAT EXCHANGER MARKET SIZE, BY COUNTRY, 2018–2021 (UNIT)
          TABLE 71 NORTH AMERICA: SHELL & TUBE HEAT EXCHANGER MARKET SIZE, BY COUNTRY, 2022–2027 (UNIT)
          TABLE 72 NORTH AMERICA: SHELL & TUBE HEAT EXCHANGER MARKET SIZE, BY COUNTRY, 2018–2021 (USD MILLION)
          TABLE 73 NORTH AMERICA: SHELL & TUBE HEAT EXCHANGER MARKET SIZE, BY COUNTRY, 2022–2027 (USD MILLION)
          TABLE 74 NORTH AMERICA: SHELL & TUBE HEAT EXCHANGER MARKET SIZE, BY MATERIAL, 2018–2021 (USD MILLION)
          TABLE 75 NORTH AMERICA: SHELL & TUBE HEAT EXCHANGER MARKET SIZE, BY MATERIAL, 2022–2027 (USD MILLION)
          TABLE 76 NORTH AMERICA: SHELL & TUBE HEAT EXCHANGER MARKET SIZE, BY APPLICATION, 2018–2021 (UNIT)
          TABLE 77 NORTH AMERICA: SHELL & TUBE HEAT EXCHANGER MARKET SIZE, BY APPLICATION, 2022–2027 (UNIT)
          TABLE 78 NORTH AMERICA: SHELL & TUBE HEAT EXCHANGER MARKET SIZE, BY APPLICATION, 2018–2021 (USD MILLION)
          TABLE 79 NORTH AMERICA: SHELL & TUBE HEAT EXCHANGER MARKET SIZE, BY APPLICATION, 2022–2027 (USD MILLION)
           9.4.1 US
                    9.4.1.1 Vast oil sector to support market growth
                                TABLE 80 US: SHELL & TUBE HEAT EXCHANGER MARKET SIZE, BY APPLICATION, 2018–2021 (USD MILLION)
                                TABLE 81 US: SHELL & TUBE HEAT EXCHANGER MARKET SIZE, BY APPLICATION, 2022–2027 (USD MILLION)
           9.4.2 CANADA
                    9.4.2.1 Availability of vast natural resources to contribute to market growth
                                TABLE 82 CANADA: SHELL & TUBE HEAT EXCHANGER MARKET SIZE, BY APPLICATION, 2018–2021 (USD MILLION)
                                TABLE 83 CANADA: SHELL & TUBE HEAT EXCHANGER MARKET SIZE, BY APPLICATION, 2022–2027 (USD MILLION)
           9.4.3 MEXICO
                    9.4.3.1 Rising population to drive demand for power generation
                                TABLE 84 MEXICO: SHELL & TUBE HEAT EXCHANGER MARKET SIZE, BY APPLICATION, 2018–2021 (USD MILLION)
                                TABLE 85 MEXICO: SHELL & TUBE HEAT EXCHANGER MARKET SIZE, BY APPLICATION, 2022–2027 (USD MILLION)
    9.5 SOUTH AMERICA 
          TABLE 86 SOUTH AMERICA: SHELL & TUBE HEAT EXCHANGER MARKET SIZE, BY COUNTRY, 2018–2021 (UNIT)
          TABLE 87 SOUTH AMERICA: SHELL & TUBE HEAT EXCHANGER MARKET SIZE, BY COUNTRY, 2022–2027 (UNIT)
          TABLE 88 SOUTH AMERICA: SHELL & TUBE HEAT EXCHANGER MARKET SIZE, BY COUNTRY, 2018–2021 (USD MILLION)
          TABLE 89 SOUTH AMERICA: SHELL & TUBE HEAT EXCHANGER MARKET SIZE, BY COUNTRY, 2022–2027 (USD MILLION)
          TABLE 90 SOUTH AMERICA: SHELL & TUBE HEAT EXCHANGER MARKET SIZE, BY MATERIAL, 2018–2021 (USD MILLION)
          TABLE 91 SOUTH AMERICA: SHELL & TUBE HEAT EXCHANGER MARKET SIZE, BY MATERIAL, 2022–2027 (USD MILLION)
          TABLE 92 SOUTH AMERICA: SHELL & TUBE HEAT EXCHANGER MARKET SIZE, BY APPLICATION, 2018–2021 (UNIT)
          TABLE 93 SOUTH AMERICA: SHELL & TUBE HEAT EXCHANGER MARKET SIZE, BY APPLICATION, 2022–2027 (UNIT)
          TABLE 94 SOUTH AMERICA: SHELL & TUBE HEAT EXCHANGER MARKET SIZE, BY APPLICATION, 2018–2021 (USD MILLION)
          TABLE 95 SOUTH AMERICA: SHELL & TUBE HEAT EXCHANGER MARKET SIZE, BY APPLICATION, 2022–2027 (USD MILLION)
           9.5.1 BRAZIL
                    9.5.1.1 Energy transition due to natural calamities to influence market
                                TABLE 96 BRAZIL: SHELL & TUBE HEAT EXCHANGER MARKET SIZE, BY APPLICATION, 2018–2021 (USD MILLION)
                                TABLE 97 BRAZIL: SHELL & TUBE HEAT EXCHANGER MARKET SIZE, BY APPLICATION, 2022–2027 (USD MILLION)
           9.5.2 ARGENTINA
                    9.5.2.1 Focus on non-hydro renewable sources to boost demand
                                TABLE 98 ARGENTINA: SHELL & TUBE HEAT EXCHANGER MARKET SIZE, BY APPLICATION, 2018–2021 (USD MILLION)
                                TABLE 99 ARGENTINA: SHELL & TUBE HEAT EXCHANGER MARKET SIZE, BY APPLICATION, 2022–2027 (USD MILLION)
           9.5.3 REST OF SOUTH AMERICA
                    TABLE 100 REST OF SOUTH AMERICA: SHELL & TUBE HEAT EXCHANGER MARKET SIZE, BY APPLICATION, 2018–2021 (USD MILLION)
                    TABLE 101 REST OF SOUTH AMERICA: SHELL & TUBE HEAT EXCHANGER MARKET SIZE, BY APPLICATION, 2022–2027 (USD MILLION)
    9.6 MIDDLE EAST & AFRICA 
          TABLE 102 MIDDLE EAST & AFRICA: SHELL & TUBE HEAT EXCHANGER MARKET SIZE, BY COUNTRY, 2018–2021 (UNIT)
          TABLE 103 MIDDLE EAST & AFRICA: SHELL & TUBE HEAT EXCHANGER MARKET SIZE, BY COUNTRY, 2022–2027 (UNIT)
          TABLE 104 MIDDLE EAST & AFRICA: SHELL & TUBE HEAT EXCHANGER MARKET SIZE, BY COUNTRY, 2018–2021 (USD MILLION)
          TABLE 105 MIDDLE EAST & AFRICA: SHELL & TUBE HEAT EXCHANGER MARKET SIZE, BY COUNTRY, 2022–2027 (USD MILLION)
          TABLE 106 MIDDLE EAST & AFRICA: SHELL & TUBE HEAT EXCHANGER MARKET SIZE, BY MATERIAL, 2018–2021 (USD MILLION)
          TABLE 107 MIDDLE EAST & AFRICA: SHELL & TUBE HEAT EXCHANGER MARKET SIZE, BY MATERIAL, 2022–2027 (USD MILLION)
          TABLE 108 MIDDLE EAST & AFRICA: SHELL & TUBE HEAT EXCHANGER MARKET SIZE, BY APPLICATION, 2018–2021 (UNIT)
          TABLE 109 MIDDLE EAST & AFRICA: SHELL & TUBE HEAT EXCHANGER MARKET SIZE, BY APPLICATION, 2022–2027 (UNIT)
          TABLE 110 MIDDLE EAST & AFRICA: SHELL & TUBE HEAT EXCHANGER MARKET SIZE, BY APPLICATION, 2018–2021 (USD MILLION)
          TABLE 111 MIDDLE EAST & AFRICA: SHELL & TUBE HEAT EXCHANGER MARKET SIZE, BY APPLICATION, 2022–2027 (USD MILLION)
           9.6.1 SAUDI ARABIA
                    9.6.1.1 New pipeline projects to influence market growth
                                TABLE 112 SAUDI ARABIA: SHELL & TUBE HEAT EXCHANGER MARKET SIZE, BY APPLICATION, 2018–2021 (USD MILLION)
                                TABLE 113 SAUDI ARABIA: SHELL & TUBE HEAT EXCHANGER MARKET SIZE, BY APPLICATION, 2022–2027 (USD MILLION)
           9.6.2 UAE
                    9.6.2.1 Changing energy-mix to drive market
                                TABLE 114 UAE: SHELL & TUBE HEAT EXCHANGER MARKET SIZE, BY APPLICATION, 2018–2021 (USD MILLION)
                                TABLE 115 UAE: SHELL & TUBE HEAT EXCHANGER MARKET SIZE, BY APPLICATION, 2022–2027 (USD MILLION)
           9.6.3 SOUTH AFRICA
                    9.6.3.1 Projects to fulfill capacity shortages to create market opportunities
                                TABLE 116 SOUTH AFRICA: SHELL & TUBE HEAT EXCHANGER MARKET SIZE, BY APPLICATION, 2018–2021 (USD MILLION)
                                TABLE 117 SOUTH AFRICA: SHELL & TUBE HEAT EXCHANGER MARKET SIZE, BY APPLICATION, 2022–2027 (USD MILLION)
           9.6.4 REST OF MIDDLE EAST & AFRICA
                    TABLE 118 REST OF MIDDLE EAST & AFRICA: SHELL & TUBE HEAT EXCHANGER MARKET SIZE, BY APPLICATION, 2018–2021 (USD MILLION)
                    TABLE 119 REST OF MIDDLE EAST & AFRICA: SHELL & TUBE HEAT EXCHANGER MARKET SIZE, BY APPLICATION, 2022–2027 (USD MILLION)
 
10 COMPETITIVE LANDSCAPE (Page No. - 131)
     10.1 OVERVIEW 
             FIGURE 32 COMPANIES ADOPTED ACQUISITIONS AND EXPANSIONS AS KEY GROWTH STRATEGIES BETWEEN 2018 AND 2022
     10.2 RANKING ANALYSIS OF KEY MARKET PLAYERS, 2022 
             FIGURE 33 RANKING OF TOP FIVE PLAYERS IN SHELL & TUBE HEAT EXCHANGER MARKET, 2022
     10.3 MARKET SHARE ANALYSIS 
             FIGURE 34 SHELL & TUBE HEAT EXCHANGER MARKET SHARE, BY COMPANY (2022)
             TABLE 120 SHELL & TUBE HEAT EXCHANGER MARKET: DEGREE OF COMPETITION
     10.4 REVENUE ANALYSIS OF TOP PLAYERS 
             TABLE 121 SHELL & TUBE HEAT EXCHANGER MARKET: REVENUE ANALYSIS (USD)
     10.5 MARKET EVALUATION MATRIX 
             TABLE 122 MARKET EVALUATION MATRIX
     10.6 COMPANY EVALUATION MATRIX, 2022 (TIER 1) 
             10.6.1 STARS
             10.6.2 EMERGING LEADERS
                        FIGURE 35 SHELL & TUBE HEAT EXCHANGER MARKET: COMPANY EVALUATION MATRIX, 2022
     10.7 START-UPS AND SMALL AND MEDIUM-SIZED ENTERPRISES (SMES) EVALUATION MATRIX 
             10.7.1 RESPONSIVE COMPANIES
             10.7.2 STARTING BLOCKS
             10.7.3 DYNAMIC COMPANIES
                        FIGURE 36 SHELL & TUBE HEAT EXCHANGER MARKET: START-UPS AND SMES MATRIX, 2022
     10.8 COMPANY APPLICATION FOOTPRINT 
     10.9 COMPANY REGION FOOTPRINT 
     10.10 STRENGTH OF PRODUCT PORTFOLIO 
     10.11 BUSINESS STRATEGY EXCELLENCE 
     10.12 COMPETITIVE SCENARIO 
             10.12.1 PRODUCT LAUNCHES
                        TABLE 123 PRODUCT LAUNCHES, 2018–2022
             10.12.2 DEALS
                        TABLE 124 DEALS, 2018–2022
             10.12.3 OTHER DEVELOPMENTS
                        TABLE 125 OTHER DEVELOPMENTS, 2018–2022
 
11 COMPANY PROFILES (Page No. - 145)
(Business Overview, Products Offered, Recent Developments, Deals, MnM view, Key strengths/right to win, Strategic choices made, Weakness/competitive threats)*
     11.1 KEY PLAYERS 
             11.1.1 ALFA LAVAL AB
                        TABLE 126 ALFA LAVAL AB: COMPANY OVERVIEW
                        FIGURE 37 ALFA LAVAL AB: COMPANY SNAPSHOT
                        TABLE 127 ALFA LAVAL AB: PRODUCTS OFFERED
                        TABLE 128 ALFA LAVAL AB: DEALS
             11.1.2 HRS HEAT EXCHANGERS
                        TABLE 129 HRS HEAT EXCHANGERS: COMPANY OVERVIEW
                        TABLE 130 HRS HEAT EXCHANGERS: PRODUCTS OFFERED
                        TABLE 131 HRS HEAT EXCHANGERS: PRODUCT LAUNCHES
                        TABLE 132 HRS HEAT EXCHANGERS: DEALS
             11.1.3 KELVION
                        TABLE 133 KELVION: COMPANY OVERVIEW
                        TABLE 134 KELVION: PRODUCTS OFFERED
                        TABLE 135 KELVION: PRODUCT LAUNCHES
                        TABLE 136 KELVION: DEALS
                        TABLE 137 KELVION: OTHERS
             11.1.4 XYLEM
                        TABLE 138 XYLEM: COMPANY OVERVIEW
                        FIGURE 38 XYLEM: COMPANY SNAPSHOT
                        TABLE 139 XYLEM: PRODUCTS OFFERED
             11.1.5 API HEAT TRANSFER
                        TABLE 140 API HEAT TRANSFER: COMPANY OVERVIEW
                        TABLE 141 API HEAT TRANSFER: PRODUCTS OFFERED
             11.1.6 KOCH HEAT TRANSFER
                        TABLE 142 KOCH HEAT TRANSFER: COMPANY OVERVIEW
                        TABLE 143 KOCH HEAT TRANSFER: PRODUCTS OFFERED
             11.1.7 MANNING & LEWIS
                        TABLE 144 MANNING & LEWIS: COMPANY OVERVIEW
                        TABLE 145 MANNING & LEWIS: PRODUCTS OFFERED
             11.1.8 MERSEN
                        TABLE 146 MERSEN: COMPANY OVERVIEW
                        FIGURE 39 MERSEN: COMPANY SNAPSHOT
                        TABLE 147 MERSEN: PRODUCTS OFFERED
                        TABLE 148 MERSEN: DEALS
             11.1.9 THERMEX
                        TABLE 149 THERMEX: COMPANY OVERVIEW
                        TABLE 150 THERMEX: PRODUCTS OFFERED
             11.1.10 THERMOFIN
                        TABLE 151 THERMOFIN: COMPANY OVERVIEW
                        TABLE 152 THERMOFIN: PRODUCTS OFFERED
     11.2 OTHER KEY COMPANIES 
             11.2.1 BARRIQUAND
             11.2.2 BRASK INC.
             11.2.3 ELANCO
             11.2.4 ENERFIN
             11.2.5 FBM HUDSON ITALIANA
             11.2.6 FUNKE
             11.2.7 GEA POWER COOLING SYSTEM INC.
             11.2.8 KENNEDY TANK AND MANUFACTURING CO. INC.
             11.2.9 KNM GROUP
             11.2.10 MASON MANUFACTURING
             11.2.11 MEZZO TECHNOLOGIES
             11.2.12 SOUTHERN HEAT EXCHANGER
             11.2.13 TINITA ENGG.
             11.2.14 UNITED HEAT EXCHANGER
             11.2.15 WCR INC.
 
*Details on Business Overview, Products Offered, Recent Developments, Deals, MnM view, Key strengths/right to win, Strategic choices made, Weakness/competitive threats might not be captured in case of unlisted companies.
 
12 APPENDIX (Page No. - 172)
     12.1 INSIGHTS FROM INDUSTRY EXPERTS 
     12.2 DISCUSSION GUIDE 
     12.3 KNOWLEDGESTORE: MARKETSANDMARKETS’ SUBSCRIPTION PORTAL 
     12.4 CUSTOMIZATION OPTIONS 
     12.5 RELATED REPORTS 
     12.6 AUTHOR DETAILS 

The study involved four major activities in estimating the current size of the shell & tube heat exchanger market. Exhaustive secondary research was done to collect information on the market, the peer market, and the parent market. The next step was to validate these findings, assumptions, and sizing with industry experts across the value chain through primary research. Both top-down and bottom-up approaches were employed to estimate the complete market size. After that, the market breakdown and data triangulation methods were used to estimate the size of the segments and subsegments of the overall market.

Secondary Research

This research report involves extensive secondary sources, directories, and databases, such as Bloomberg, BusinessWeek, Factiva, BP statistics, and World Bank, to identify and collect information useful for the technical, market-oriented, and commercial study of the shell & tube heat exchanger market. The secondary sources included annual reports, press releases & investor presentations of companies, white papers, and certified publications.

Primary Research

The shell & tube heat exchanger market comprises several stakeholders, such as raw material suppliers, manufacturers, distributors, buyers, and regulatory organizations. The demand side of this market is characterized by component manufacturers. The supply side included industry experts, such as CEOs, vice presidents, marketing directors, technology and innovation directors, and related key executives from various companies and organizations operating in the market. Various primary sources from both the supply and demand sides of the market were interviewed to obtain qualitative and quantitative information.

Following is the breakdown of primary respondents:
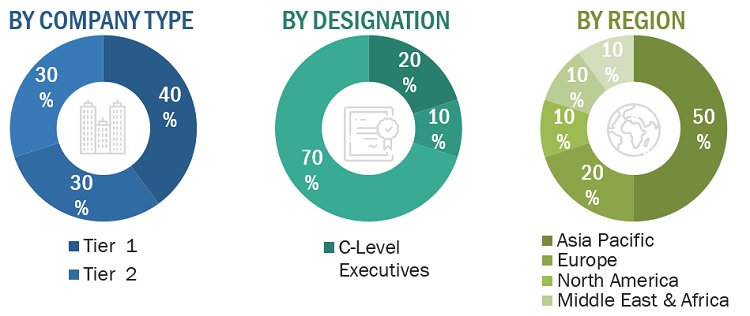
Shell & Tube Heat Exchangers Market Size, and Share

Notes: Companies are classified based on their revenue–Tier 1 = > USD 1 billion, Tier 2 = USD 500 million– USD 1 billion, and Tier 3 = < USD 500 million.

Other designations include sales representatives, production heads, and technicians.

To know about the assumptions considered for the study, download the pdf brochure

Market Size Estimation

The top-down approach was used to estimate and validate the size of the various submarkets for shell & tube heat exchanger for each region. The research methodology used to estimate the market size included the following steps:

  • Global heat exchanger market was identified, and the share for shell & tube heat exchanger was determined through primary and secondary research.
  • The global market was then segmented into five major regions and validated through industry experts.
  • All percentage shares, splits, and breakdowns based on material, application, and country were determined using secondary sources and verified through primary sources.
  • All possible parameters that affect the markets covered in this research study were accounted for, viewed in extensive detail, verified through primary research, and analyzed to get the final quantitative and qualitative data. This data was consolidated and added with detailed inputs and analysis and presented in this report.

Data Triangulation

After arriving at the overall market size—using the estimation processes explained above— shell & tube heat exchanger market was split into several segments. The data triangulation and market breakdown procedures were employed, wherever applicable, to complete the overall market engineering process and arrive at the exact statistics of each market segment. The data was triangulated by studying several factors and trends from both the demand and supply sides.

Report Objectives

  • To define, describe, and forecast the size of the shell & tube heat exchanger market in terms of value and volume
  • To provide detailed information regarding the major factors (drivers, opportunities, restraints, and challenges) influencing market growth
  • To estimate and forecast the market size based on material, application, and region
  • To forecast the size of the market in the major regions, namely, Europe, North America, Asia Pacific (APAC), Middle East & Africa, and South America along with their key countries
  • To strategically analyse micromarkets1 with respect to individual growth trends, prospects, and their contribution to the overall market
  • To analyse opportunities in the market for stakeholders and provide a competitive landscape of market leaders
  • To identify the impact of the COVID-19 pandemic on the market
  • To track and analyse recent developments such as expansions, new product launches, partnerships & agreements, and acquisitions in the market

Available Customizations

MarketsandMarkets offers customizations according to the specific needs of the companies with the given market data.

The following customization options are available for the shell & tube heat exchanger market report:

Product Analysis

  • Product matrix, which provides a detailed comparison of the product portfolio of each company

Regional Analysis

  • A further breakdown of the shell & tube heat exchanger market, by segments

Company Information

  • Detailed analysis and profiling of additional market players (up to ten)
Custom Market Research Services

We will customize the research for you, in case the report listed above does not meet with your exact requirements. Our custom research will comprehensively cover the business information you require to help you arrive at strategic and profitable business decisions.

Request Customization

Instant Answers with GPT - Ask Now!

Ask real questions. Get complete answers !
Report Code
CH 4047
Published ON
Nov, 2022
Choose License Type
BUY NOW
  • SHARE
X
Request Customization
Speak to Analyst
Speak to Analyst
OR FACE-TO-FACE MEETING
PERSONALIZE THIS RESEARCH
  • Triangulate with your Own Data
  • Get Data as per your Format and Definition
  • Gain a Deeper Dive on a Specific Application, Geography, Customer or Competitor
  • Any level of Personalization
REQUEST A FREE CUSTOMIZATION
LET US HELP YOU!
  • What are the Known and Unknown Adjacencies Impacting the Shell & Tube Heat Exchanger Market
  • What will your New Revenue Sources be?
  • Who will be your Top Customer; what will make them switch?
  • Defend your Market Share or Win Competitors
  • Get a Scorecard for Target Partners
CUSTOMIZED WORKSHOP REQUEST
+1-888-600-6441
  • Call Us
  • +1-888-600-6441 (Corporate office hours)
  • +1-888-600-6441 (US/Can toll free)
  • +44-800-368-9399 (UK office hours)
CONNECT WITH US
ABOUT TRUST ONLINE
©2024 MarketsandMarkets Research Private Ltd. All rights reserved
DMCA.com Protection Status Website Feedback