Regenerative Medicine Market: Growth, Size, Share, and Trends

Regenerative Medicine Market by Product (Stem Cell [Autologous, Allogenic], Immunotherapy, Gene Therapy, Tissue Engineering), Application (Musculoskeletal, Cancer, Dermatology, Wound care, Cardiovascular Diseases, Eye Disorders) & Region - Global Forecast to 2028

Report Code: BT 4419 Jan, 2024, by marketsandmarkets.com

Market Growth Outlook Summary

The global regenerative medicine market growth forecasted to transform from USD 16.0 billion in 2023 to USD 49.0 billion by 2028, driven by a CAGR of 25.1%. Market growth is mainly due to various factors such as rising emphasis on personalized medicine, rising partnerships and collaborations by major market players, increased therapeutic area scope and rise in regenerative medicine regulatory approvals. However, the legal and ethical concrns associated with regenerative medicine along with the growing high treatment cost are predicted to cause market growth barriers.

Regenerative Medicine Market Size, Dynamics & Ecosystem

Regenerative Medicine Market Size, Dynamics & Ecosystem

To know about the assumptions considered for the study, Request for Free Sample Report

Global Regenerative Medicine Market Dynamics

Driver: Focus on Personalized Medicine

The global market is expected to benefit from the focus on personalized medicines. Precision medicine is an approach to medical treatment that tailors therapeutics, and interventions for individual patients or a subpopulation based on their unique genetic, environmental, and lifestyle characteristics. In 2022, the FDA approved 12 personalized medications, representing approximately 34% of all newly approved therapeutic molecular entities. Personalized treatments account for at least a quarter of new drug approvals since 2015. Moreover, five new gene or cell-based therapies were approved in 2022. These include treatment of rare genetic disorders with few other treatment options – beta thalassemia, hemophilia B, and cerebral adrenoleukodystrophy, refractory multiple myeloma, and certain types of non-muscle invasive bladder cancer.

Restraint: Ethical and Legal concerns and high cost of regenerative medicines

Several ethical issues are associated with the use of stem cells, as these cells are derived by destroying the human embryo. The human embryo is viewed as a potential life, and destroying it is considered unethical even if it can save a human life. Such concerns related to embryonic stem cells for developing stem cell therapy are factors restraining market growth globally. Furthermore, the adoption of stem cells in Middle Eastern countries raises ethical considerations rooted in cultural, religious, and social perspectives. Religious beliefs, particularly in Islam, may influence opinions on the use of embryonic stem cells, posing a challenge as it involves the destruction of embryos. Additionally, due to budget constraints, various research institutes and small-scale companies find it difficult to afford expensive products. In emerging economies, underdeveloped infrastructure facilities and low healthcare expenditure restrict the use of advanced equipment.

Opportunity: Harnessing the Potential of 3D Printing

Technological advancements play a pivotal role in propelling the growth of the tissue engineering market, fostering innovation and expanding the scope of applications within the field. The continual evolution of materials science, bioengineering techniques, and imaging technologies has enabled researchers and engineers to develop sophisticated tissue-engineered products with enhanced functionalities. 3D bioprinting is used for the development of biostructure for orthopedic tissues, bones, and associated organs. In 3D bioprinting, a small unit of living cells, biomaterials, and biochemicals are positioned with the functional components to form tissue like 3D structures. The 3D bioprinting technology offers various advantages, including accurate cell distribution, scalability, high-resolution cell deposition, and cost-effectiveness.

Challenge: Lack of favorable reimbursement policies across various regions

The global market faces a significant hurdle in its growth trajectory due to inadequate or lack of reimbursement policies. The absence of clear reimbursement frameworks for regenerative therapies poses a challenge for both healthcare providers and patients. The inconsistent and complex nature of reimbursement policies across various regions hampers the widespread adoption of these innovative treatments. This factor is likely to restrain the growth of the market.

Regenerative Medicine Market Segmentation & Geographical Spread

Regenerative Medicine Market Segmentation & Geographical Spread

To know about the assumptions considered for the study, download the pdf brochure

The cell therapy segment of regenerative medicine industry commanded market share.

On the basis of product, the regenerative medicine market is segmented into gene therapy, cell therapy (stem cell therapy [cell transplantations, stem cell therapy products {autologous therapy, allogenic therapy] cell-based immunotherapy products), and tissue engineering products. The cell therapy segment dominated the market in 2022. The rising cell therapy production facilities GMP certification approvals is one of the many factors driving the growth of this segment.

Muskuloskeletal disorders segment of the regenerative medicine industry is likely to grow at significant CAGR during the forecast period.

Based on therapeutic area, the regenerative medicine market is classified into ophthalmology, oncology, neurology, musculoskeletal disorders, cardiovascular diseases, dermatology & wound care and other applications. In 2022, the musculoskeletal disorders segment captured the highest share of the global market due to the increasing prevalence of orthopedic disorders and rise in musculoskeletal regeneration research.

Asia Pacific region of the regenerative medicine industry is predicted to exhibit highest CAGR during the forecast period of 2023-2028.

There are six main regional segmentations for the regenerative medicine market—North America, Europe, the Asia Pacific, Latin America, Middle East and Africa. In 2022, North America dominated the global market with the highest market share. Rising investments in tissue engineering, stem cell banking, and drug discovery, coupled with an expanding healthcare sector and high adoption of cell immunotherapies for cancer and chronic diseases and stem cell therapy, are driving the North American market's robust growth. Additionally, Asia Pacific exhibited the highest CAGR which can be attributed to the rising new technologies demand, increasing per capita income and increasing burden of chronic diseases.

Key players in the regenerative medicine market include Novartis AG (Switzerland), Biogen, Inc. (US), Sarepta Therapeutics, Inc. (US), Gilead Sciences, Inc. (US), Amgen Inc. (US), Smith+Nephew (UK), MEDIPOST Co., Ltd. (Korea), JCR Pharmaceuticals Co., Ltd. (Japan), Takeda Pharmaceutical Company Limited (Japan), and CORESTEM, Inc (South Korea).

Regenerative Medicine Market Report Scope

Report Metric

Details

Market Revenue Size in 2023

USD 16.0 Billion

Projected Revenue Size by 2028

USD 49.0 Billion

Industry Growth Rate

Poised to Grow at a CAGR of 25.1%

Market Driver

Focus on Personalized Medicine

Market Opportunity

Harnessing the Potential of 3D Printing

This report categorizes the regenerative medicine market to forecast revenue and analyze trends in each of the following submarkets:

By Product

  • Cell therapy
  • Stem cell therapy
    • Cell transplantations
    • Stem cell therapy products
      • Autologous therapy
      • Allogenic therapy
  • Cell-based immunotherapy products
  • Gene therapy
  • Tissue engineering

By Therapeutic Area

  • Oncology
  • Musculoskeletal disorders
  • Dermatology & wound care
  • Cardiovascular diseases
  • Ophthalmology
  • Neurology
  • Other applications

By Region

  • North America
    • US
    • Canada
  • Europe
    • Germany
    • France
    • UK
    • Italy
    • Spain
    • Rest of Europe
  • Asia Pacific
    • Japan
    • China
    • India
    • South Korea
    • Australia
    • Rest of Asia Pacific
  • Latin America
    • Brazil
    • Rest of Latin America
  • Middle East
  • Africa

Recent Developments of Regenerative Medicine Market

  • In December 2023, the U.S. FDA greenlit a historic treatment, Casgevy (CRISPR Therapeutics.). This first-ever cell-based gene therapy tackled sickle cell disease in patients 12+ and marked a revolutionary step in gene therapy with its novel genome editing tech.
  • In January 2023, Sarepta and Catalent entered into a commercial supply agreement for Catalent to manufacture delandistrogene moxeparvovec (SRP-9001) (ELEVIDYS), Sarepta’s most advanced gene therapy candidate for the treatment of Duchenne Muscular Dystrophy (DMD).
  • In August 2023, Gilead Sciences and Tentarix Biotherapeutics entered into three multi-year collaborations to leverage Tentarix's Tentacles platform for the discovery and development of innovative, multi-functional protein-based therapies for cancer and inflammatory diseases.
  • In December 2023, Bristol-Myers Squibb received approval for ABECMA for patients with relapsed or refractory multiple myeloma with at least two prior treatments, including specific medications in Japan.

Frequently Asked Questions (FAQ):

To speak to our analyst for a discussion on the above findings, click Speak to Analyst

Exclusive indicates content/data unique to MarketsandMarkets and not available with any competitors.

INTRODUCTION
24
RESEARCH METHODOLOGY
29
EXECUTIVE SUMMARY
43
PREMIUM INSIGHTS
46
MARKET OVERVIEW
49
  • 5.1 INTRODUCTION
  • 5.2 MARKET DYNAMICS
    DRIVERS
    - Growing focus on personalized medicine
    - Emerging applications in new therapeutic areas
    - Increasing collaborations and partnerships by major market players
    - Increasing regulatory approvals in regenerative medicine
    RESTRAINTS
    - Lack of long-term data
    - Ethical and legal concerns and high cost of treatments
    OPPORTUNITIES
    - Harnessing the potential of 3D printing
    - Integration with artificial intelligence and big data
    - Growing number of organ transplants
    CHALLENGES
    - Lack of favorable reimbursement policies across various regions
  • 5.3 TRENDS/DISRUPTIONS IMPACTING CUSTOMERS’ BUSINESSES
  • 5.4 PRICING ANALYSIS
    AVERAGE SELLING PRICE TREND OF KEY PLAYERS, BY PRODUCT
  • 5.5 SUPPLY CHAIN ANALYSIS
  • 5.6 VALUE CHAIN ANALYSIS
  • 5.7 ECOSYSTEM ANALYSIS
  • 5.8 TECHNOLOGY ANALYSIS
  • 5.9 PATENT ANALYSIS
  • 5.10 KEY CONFERENCES & EVENTS IN 2024–2025
    REGENERATIVE MEDICINE CONFERENCES IN 2024–2025
  • 5.11 TARIFF & REGULATORY LANDSCAPE
    FDA APPROVALS
    REGULATORY BODIES, GOVERNMENT AGENCIES, AND OTHER ORGANIZATIONS
  • 5.12 PORTER’S FIVE FORCES ANALYSIS
    THREAT OF NEW ENTRANTS
    THREAT OF SUBSTITUTES
    BARGAINING POWER OF BUYERS
    BARGAINING POWER OF SUPPLIERS
    DEGREE OF COMPETITION
  • 5.13 KEY STAKEHOLDERS & BUYING CRITERIA
    KEY STAKEHOLDERS IN BUYING PROCESS
    BUYING CRITERIA FOR REGENERATIVE MEDICINE PRODUCTS
  • 5.14 PIPELINE ANALYSIS
REGENERATIVE MEDICINE MARKET, BY PRODUCT
83
  • 6.1 INTRODUCTION
  • 6.2 CELL THERAPY
    STEM CELL THERAPY
    - Cell transplantations
    - Stem cell therapy products
    CELL-BASED IMMUNOTHERAPY
    - Growing adoption of T-cell therapy in cancer treatment to support market growth
  • 6.3 GENE THERAPY
    STRONG PRODUCT PIPELINE DUE TO BROADENING APPLICATIONS IN DISEASE TREATMENT TO DRIVE MARKET
  • 6.4 TISSUE ENGINEERING
    HIGH DEMAND FOR TISSUE ENGINEERING PRODUCTS IN DERMATOLOGY & WOUND CARE APPLICATIONS TO DRIVE MARKET
REGENERATIVE MEDICINE MARKET, BY THERAPEUTIC AREA
112
  • 7.1 INTRODUCTION
  • 7.2 ONCOLOGY
    INCREASING STEM CELL TRANSPLANTS TO DRIVE MARKET
  • 7.3 MUSCULOSKELETAL DISORDERS
    RISING RESEARCH ON MUSCULOSKELETAL REGENERATION AND PREVALENCE OF ORTHOPEDIC DISORDERS TO DRIVE MARKET
  • 7.4 DERMATOLOGY & WOUND CARE
    RISING USE OF WOUND CARE BIOLOGICS TO DRIVE MARKET
  • 7.5 CARDIOVASCULAR DISEASES
    INCREASING USE OF MSCS FOR CLINICAL RESEARCH ON IHD TO SUPPORT MARKET GROWTH
  • 7.6 OPHTHALMOLOGY
    REGENERATION OF EYE TISSUES FOR AMD TO SUPPORT MARKET GROWTH
  • 7.7 NEUROLOGY
    GROWING NUMBER OF GENE THERAPY PRODUCTS APPROVED FOR NEUROLOGICAL DISEASE TREATMENT TO DRIVE MARKET GROWTH
  • 7.8 OTHER THERAPEUTIC AREAS
REGENERATIVE MEDICINE MARKET, BY REGION
139
  • 8.1 INTRODUCTION
  • 8.2 NORTH AMERICA
    US
    - Rising number of pipeline products for regenerative medicine to drive market
    CANADA
    - Rising government initiatives for regenerative medicine research to drive market
    NORTH AMERICA: RECESSION IMPACT
  • 8.3 EUROPE
    GERMANY
    - Rising focus on clinical research and patent approvals to drive market
    UK
    - Incorporating regenerative medicine into commercial healthcare services under NHS to drive market
    FRANCE
    - Structured regulatory framework to drive regenerative medicine product pipeline
    ITALY
    - Rising prevalence of neurological and cardiovascular disorders to drive market
    SPAIN
    - Favorable regulatory environment to drive product pipeline
    REST OF EUROPE
    EUROPE: RECESSION IMPACT
  • 8.4 ASIA PACIFIC
    CHINA
    - Favorable government support for development of regenerative medicine to drive market
    JAPAN
    - Regulatory amendments to pharmaceutical legislation to drive commercialization of therapies
    INDIA
    - Introduction of novel therapies for CVD and cancer to support market growth
    SOUTH KOREA
    - Strong research base and availability of funds to support market growth
    AUSTRALIA
    - Increasing incidence of sports injuries to support market growth
    REST OF ASIA PACIFIC
    ASIA PACIFIC: RECESSION IMPACT
  • 8.5 LATIN AMERICA
    BRAZIL
    - Gradual increase in pharmaceutical R&D to support market growth
    REST OF LATIN AMERICA
    LATIN AMERICA: RECESSION IMPACT
  • 8.6 MIDDLE EAST
    GROWING FOCUS ON GENETIC MEDICINE DEVELOPMENT PROJECTS TO DRIVE MARKET GROWTH IN COMING YEARS
    MIDDLE EAST: RECESSION IMPACT
  • 8.7 AFRICA
    GROWING COLLABORATIONS TO SUPPORT GROWTH IN COMING YEARS
    AFRICA: RECESSION IMPACT
COMPETITIVE LANDSCAPE
205
  • 9.1 INTRODUCTION
  • 9.2 RIGHT-TO-WIN APPROACHES ADOPTED BY KEY PLAYERS
  • 9.3 REVENUE SHARE ANALYSIS
  • 9.4 MARKET SHARE ANALYSIS
  • 9.5 COMPANY EVALUATION MATRIX
    STARS
    EMERGING LEADERS
    PERVASIVE PLAYERS
    PARTICIPANTS
    COMPANY FOOTPRINT ANALYSIS
  • 9.6 START-UP/SME EVALUATION MATRIX
    PROGRESSIVE COMPANIES
    RESPONSIVE COMPANIES
    DYNAMIC COMPANIES
    STARTING BLOCKS
    COMPETITIVE BENCHMARKING
  • 9.7 COMPETITIVE SCENARIO & TRENDS
    PRODUCT LAUNCHES
    DEALS
    OTHER DEVELOPMENTS
COMPANY PROFILES
228
  • 10.1 KEY MARKET PLAYERS
    NOVARTIS AG
    - Business overview
    - Products offered
    - Recent developments
    - MnM view
    BIOGEN INC.
    - Business overview
    - Products offered
    - Recent developments
    - MnM view
    GILEAD SCIENCES, INC.
    - Business overview
    - Products offered
    - Recent developments
    - MnM view
    SAREPTA THERAPEUTICS, INC.
    - Business overview
    - Products offered
    - Recent developments
    AMGEN, INC.
    - Business overview
    - Products offered
    - Recent developments
    SMITH+NEPHEW
    - Business overview
    - Products offered
    - Recent developments
    MEDIPOST CO., LTD.
    - Business overview
    - Products offered
    - Recent developments
    JCR PHARMACEUTICALS CO., LTD.
    - Business overview
    - Products offered
    TAKEDA PHARMACEUTICAL COMPANY LIMITED
    - Business overview
    - Products offered
    - Recent developments
    CORESTEM, INC.
    - Business overview
    - Products offered
    - Product pipeline
    VERICEL CORPORATION
    - Business overview
    - Products offered
    MIMEDX GROUP, INC.
    - Business overview
    - Products offered
    - Recent developments
    ORGANOGENESIS INC.
    - Business overview
    - Products offered
    - Recent developments
    MEDTRONIC
    - Business overview
    - Products offered
    - Recent developments
    BRISTOL-MYERS SQUIBB COMPANY
    - Business overview
    - Products offered
  • 10.2 OTHER PLAYERS
    ORTHOCELL LTD.
    MESOBLAST LTD.
    BIORESTORATIVE THERAPIES, INC.
    PLURISTEM THERAPEUTICS INC.
    TEGOSCIENCE
    ANTEROGEN.CO.,LTD.
    BLUEBIRD BIO, INC.
    STEMPEUTICS RESEARCH PVT. LTD.
    SIBIONO GENETECH CO. LTD.
    ASPECT BIOSYSTEMS
APPENDIX
286
  • 11.1 DISCUSSION GUIDE
  • 11.2 KNOWLEDGESTORE: MARKETSANDMARKETS’ SUBSCRIPTION PORTAL
  • 11.3 CUSTOMIZATION OPTIONS
  • 11.4 RELATED REPORTS
  • 11.5 AUTHOR DETAILS
LIST OF TABLES
 
  • TABLE 1 GLOBAL INFLATION RATE PROJECTION, 2024–2028 (% GROWTH)
  • TABLE 2 US HEALTH EXPENDITURE, 2019–2022 (USD MILLION)
  • TABLE 3 US HEALTH EXPENDITURE, 2023–2027 (USD MILLION)
  • TABLE 4 REGENERATIVE MEDICINE MARKET: EMERGING APPLICATIONS
  • TABLE 5 LIST OF KEY PRODUCT APPROVALS IN REGENERATIVE MEDICINE MARKET, 2021–2023
  • TABLE 6 REGENERATIVE MEDICINE PRICE TREND
  • TABLE 7 ROLE IN ECOSYSTEM
  • TABLE 8 STEM CELL THERAPIES AND GENE THERAPIES
  • TABLE 9 REGENERATIVE MEDICINE MARKET: INDICATIVE LIST OF PATENTS
  • TABLE 10 REGENERATIVE MEDICINE CONFERENCES IN 2024–2025
  • TABLE 11 NORTH AMERICA: REGULATORY BODIES, GOVERNMENT AGENCIES, AND OTHER ORGANIZATIONS
  • TABLE 12 EUROPE: REGULATORY BODIES, GOVERNMENT AGENCIES, AND OTHER ORGANIZATIONS
  • TABLE 13 ASIA PACIFIC: REGULATORY BODIES, GOVERNMENT AGENCIES, AND OTHER ORGANIZATIONS
  • TABLE 14 REST OF THE WORLD: REGULATORY BODIES, GOVERNMENT AGENCIES, AND OTHER ORGANIZATIONS
  • TABLE 15 REGENERATIVE MEDICINE MARKET: PORTER’S FIVE FORCES ANALYSIS
  • TABLE 16 GENE THERAPY PRODUCTS UNDER CLINICAL TRIAL
  • TABLE 17 CELL THERAPY PRODUCTS UNDER CLINICAL TRIAL
  • TABLE 18 REGENERATIVE MEDICINE MARKET, BY PRODUCT, 2021–2028 (USD MILLION)
  • TABLE 19 REGENERATIVE MEDICINE MARKET FOR CELL THERAPY, BY TYPE, 2021–2028 (USD MILLION)
  • TABLE 20 REGENERATIVE MEDICINE MARKET FOR CELL THERAPY, BY REGION, 2021–2028 (USD MILLION)
  • TABLE 21 NORTH AMERICA: REGENERATIVE MEDICINE MARKET FOR CELL THERAPY, BY COUNTRY, 2021–2028 (USD MILLION)
  • TABLE 22 EUROPE: REGENERATIVE MEDICINE MARKET FOR CELL THERAPY, BY COUNTRY, 2021–2028 (USD MILLION)
  • TABLE 23 ASIA PACIFIC: REGENERATIVE MEDICINE MARKET FOR CELL THERAPY, BY COUNTRY, 2021–2028 (USD MILLION)
  • TABLE 24 LATIN AMERICA: REGENERATIVE MEDICINE MARKET FOR CELL THERAPY, BY COUNTRY, 2021–2028 (USD MILLION)
  • TABLE 25 REGENERATIVE MEDICINE MARKET FOR STEM CELL THERAPY, BY TYPE, 2021–2028 (USD MILLION)
  • TABLE 26 REGENERATIVE MEDICINE MARKET FOR STEM CELL THERAPY, BY REGION, 2021–2028 (USD MILLION)
  • TABLE 27 NORTH AMERICA: REGENERATIVE MEDICINE MARKET FOR STEM CELL THERAPY, BY COUNTRY, 2021–2028 (USD MILLION)
  • TABLE 28 EUROPE: REGENERATIVE MEDICINE MARKET FOR STEM CELL THERAPY, BY COUNTRY, 2021–2028 (USD MILLION)
  • TABLE 29 ASIA PACIFIC: REGENERATIVE MEDICINE MARKET FOR STEM CELL THERAPY, BY COUNTRY, 2021–2028 (USD MILLION)
  • TABLE 30 LATIN AMERICA: REGENERATIVE MEDICINE MARKET FOR STEM CELL THERAPY, BY COUNTRY, 2021–2028 (USD MILLION)
  • TABLE 31 REGENERATIVE MEDICINE MARKET FOR CELL TRANSPLANTATIONS, BY REGION, 2021–2028 (USD MILLION)
  • TABLE 32 NORTH AMERICA: REGENERATIVE MEDICINE MARKET FOR CELL TRANSPLANTATIONS, BY COUNTRY, 2021–2028 (USD MILLION)
  • TABLE 33 EUROPE: REGENERATIVE MEDICINE MARKET FOR CELL TRANSPLANTATIONS, BY COUNTRY, 2021–2028 (USD MILLION)
  • TABLE 34 ASIA PACIFIC: REGENERATIVE MEDICINE MARKET FOR CELL TRANSPLANTATIONS, BY COUNTRY, 2021–2028 (USD MILLION)
  • TABLE 35 LATIN AMERICA: REGENERATIVE MEDICINE MARKET FOR CELL TRANSPLANTATIONS, BY COUNTRY, 2021–2028 (USD MILLION)
  • TABLE 36 REGENERATIVE MEDICINE MARKET FOR STEM CELL THERAPY PRODUCTS, BY TYPE, 2021–2028 (USD MILLION)
  • TABLE 37 REGENERATIVE MEDICINE MARKET FOR STEM CELL THERAPY PRODUCTS, BY REGION, 2021–2028 (USD MILLION)
  • TABLE 38 NORTH AMERICA: REGENERATIVE MEDICINE MARKET FOR STEM CELL THERAPY PRODUCTS, BY COUNTRY, 2021–2028 (USD MILLION)
  • TABLE 39 EUROPE: REGENERATIVE MEDICINE MARKET FOR STEM CELL THERAPY PRODUCTS, BY COUNTRY, 2021–2028 (USD MILLION)
  • TABLE 40 ASIA PACIFIC: REGENERATIVE MEDICINE MARKET FOR STEM CELL THERAPY PRODUCTS, BY COUNTRY, 2021–2028 (USD MILLION)
  • TABLE 41 LATIN AMERICA: REGENERATIVE MEDICINE MARKET FOR STEM CELL THERAPY PRODUCTS, BY COUNTRY, 2021–2028 (USD MILLION)
  • TABLE 42 REGENERATIVE MEDICINE MARKET FOR AUTOLOGOUS THERAPY, BY REGION, 2021–2028 (USD MILLION)
  • TABLE 43 NORTH AMERICA: REGENERATIVE MEDICINE MARKET FOR AUTOLOGOUS THERAPY, BY COUNTRY, 2021–2028 (USD MILLION)
  • TABLE 44 EUROPE: REGENERATIVE MEDICINE MARKET FOR AUTOLOGOUS THERAPY, BY COUNTRY, 2021–2028 (USD MILLION)
  • TABLE 45 ASIA PACIFIC: REGENERATIVE MEDICINE MARKET FOR AUTOLOGOUS THERAPY, BY COUNTRY, 2021–2028 (USD MILLION)
  • TABLE 46 LATIN AMERICA: REGENERATIVE MEDICINE MARKET FOR AUTOLOGOUS THERAPY, BY COUNTRY, 2021–2028 (USD MILLION)
  • TABLE 47 REGENERATIVE MEDICINE MARKET FOR ALLOGENEIC THERAPY, BY REGION, 2021–2028 (USD MILLION)
  • TABLE 48 NORTH AMERICA: REGENERATIVE MEDICINE MARKET FOR ALLOGENEIC THERAPY, BY COUNTRY, 2021–2028 (USD MILLION)
  • TABLE 49 EUROPE: REGENERATIVE MEDICINE MARKET FOR ALLOGENEIC THERAPY, BY COUNTRY, 2021–2028 (USD MILLION)
  • TABLE 50 ASIA PACIFIC: REGENERATIVE MEDICINE MARKET FOR ALLOGENEIC THERAPY, BY COUNTRY, 2021–2028 (USD MILLION)
  • TABLE 51 LATIN AMERICA: REGENERATIVE MEDICINE MARKET FOR ALLOGENEIC THERAPY, BY COUNTRY, 2021–2028 (USD MILLION)
  • TABLE 52 REGENERATIVE MEDICINE MARKET FOR CELL-BASED IMMUNOTHERAPY, BY REGION, 2021–2028 (USD MILLION)
  • TABLE 53 NORTH AMERICA: REGENERATIVE MEDICINE MARKET FOR CELL-BASED IMMUNOTHERAPY, BY COUNTRY, 2021–2028 (USD MILLION)
  • TABLE 54 EUROPE: REGENERATIVE MEDICINE MARKET FOR CELL-BASED IMMUNOTHERAPY, BY COUNTRY, 2021–2028 (USD MILLION)
  • TABLE 55 ASIA PACIFIC: REGENERATIVE MEDICINE MARKET FOR CELL-BASED IMMUNOTHERAPY, BY COUNTRY, 2021–2028 (USD MILLION)
  • TABLE 56 LATIN AMERICA: REGENERATIVE MEDICINE MARKET FOR CELL-BASED IMMUNOTHERAPY, BY COUNTRY, 2021–2028 (USD MILLION)
  • TABLE 57 APPROVED GENE THERAPIES, 2022
  • TABLE 58 REGENERATIVE MEDICINE MARKET FOR GENE THERAPY, BY REGION, 2021–2028 (USD MILLION)
  • TABLE 59 NORTH AMERICA: REGENERATIVE MEDICINE MARKET FOR GENE THERAPY, BY COUNTRY, 2021–2028 (USD MILLION)
  • TABLE 60 EUROPE: REGENERATIVE MEDICINE MARKET FOR GENE THERAPY, BY COUNTRY, 2021–2028 (USD MILLION)
  • TABLE 61 ASIA PACIFIC: REGENERATIVE MEDICINE MARKET FOR GENE THERAPY, BY COUNTRY, 2021–2028 (USD MILLION)
  • TABLE 62 LATIN AMERICA: REGENERATIVE MEDICINE MARKET FOR GENE THERAPY, BY COUNTRY, 2021–2028 (USD MILLION)
  • TABLE 63 REGENERATIVE MEDICINE MARKET FOR TISSUE ENGINEERING, BY REGION, 2021–2028 (USD MILLION)
  • TABLE 64 NORTH AMERICA: REGENERATIVE MEDICINE MARKET FOR TISSUE ENGINEERING, BY COUNTRY, 2021–2028 (USD MILLION)
  • TABLE 65 EUROPE: REGENERATIVE MEDICINE MARKET FOR TISSUE ENGINEERING, BY COUNTRY, 2021–2028 (USD MILLION)
  • TABLE 66 ASIA PACIFIC: REGENERATIVE MEDICINE MARKET FOR TISSUE ENGINEERING, BY COUNTRY, 2021–2028 (USD MILLION)
  • TABLE 67 LATIN AMERICA: REGENERATIVE MEDICINE MARKET FOR TISSUE ENGINEERING, BY COUNTRY, 2021–2028 (USD MILLION)
  • TABLE 68 NUMBER OF CLINICAL TRIALS FOR REGENERATIVE MEDICINE PRODUCTS, BY THERAPEUTIC AREA, 2021 VS. 2022
  • TABLE 69 REGENERATIVE MEDICINE MARKET, BY THERAPEUTIC AREA, 2021–2028 (USD MILLION)
  • TABLE 70 INDICATIVE LIST OF COMMERCIALIZED REGENERATIVE CELL THERAPIES FOR ONCOLOGY APPLICATIONS
  • TABLE 71 REGENERATIVE MEDICINE MARKET FOR ONCOLOGY, BY REGION, 2021–2028 (USD MILLION)
  • TABLE 72 NORTH AMERICA: REGENERATIVE MEDICINE MARKET FOR ONCOLOGY, BY COUNTRY, 2021–2028 (USD MILLION)
  • TABLE 73 EUROPE: REGENERATIVE MEDICINE MARKET FOR ONCOLOGY, BY COUNTRY, 2021–2028 (USD MILLION)
  • TABLE 74 ASIA PACIFIC: REGENERATIVE MEDICINE MARKET FOR ONCOLOGY, BY COUNTRY, 2021–2028 (USD MILLION)
  • TABLE 75 LATIN AMERICA: REGENERATIVE MEDICINE MARKET FOR ONCOLOGY, BY COUNTRY, 2021–2028 (USD MILLION)
  • TABLE 76 REGENERATIVE MEDICINE MARKET FOR MUSCULOSKELETAL DISORDERS, BY REGION, 2021–2028 (USD MILLION)
  • TABLE 77 NORTH AMERICA: REGENERATIVE MEDICINE MARKET FOR MUSCULOSKELETAL DISORDERS, BY COUNTRY, 2021–2028 (USD MILLION)
  • TABLE 78 EUROPE: REGENERATIVE MEDICINE MARKET FOR MUSCULOSKELETAL DISORDERS, BY COUNTRY, 2021–2028 (USD MILLION)
  • TABLE 79 ASIA PACIFIC: REGENERATIVE MEDICINE MARKET FOR MUSCULOSKELETAL DISORDERS, BY COUNTRY, 2021–2028 (USD MILLION)
  • TABLE 80 LATIN AMERICA: REGENERATIVE MEDICINE MARKET FOR MUSCULOSKELETAL DISORDERS, BY COUNTRY, 2021–2028 (USD MILLION)
  • TABLE 81 INDICATIVE LIST OF REGENERATIVE MEDICINE PRODUCTS COMMERCIALIZED FOR TREATMENT OF ACUTE & CHRONIC WOUNDS
  • TABLE 82 REGENERATIVE MEDICINE MARKET FOR DERMATOLOGY & WOUND CARE, BY REGION, 2021–2028 (USD MILLION)
  • TABLE 83 NORTH AMERICA: REGENERATIVE MEDICINE MARKET FOR DERMATOLOGY & WOUND CARE, BY COUNTRY, 2021–2028 (USD MILLION)
  • TABLE 84 EUROPE: REGENERATIVE MEDICINE MARKET FOR DERMATOLOGY & WOUND CARE, BY COUNTRY, 2021–2028 (USD MILLION)
  • TABLE 85 ASIA PACIFIC: REGENERATIVE MEDICINE MARKET FOR DERMATOLOGY & WOUND CARE, BY COUNTRY, 2021–2028 (USD MILLION)
  • TABLE 86 LATIN AMERICA: REGENERATIVE MEDICINE MARKET FOR DERMATOLOGY & WOUND CARE, BY COUNTRY, 2021–2028 (USD MILLION)
  • TABLE 87 REGENERATIVE MEDICINE MARKET FOR CARDIOVASCULAR DISEASES, BY REGION, 2021–2028 (USD MILLION)
  • TABLE 88 NORTH AMERICA: REGENERATIVE MEDICINE MARKET FOR CARDIOVASCULAR DISEASES, BY COUNTRY, 2021–2028 (USD MILLION)
  • TABLE 89 EUROPE: REGENERATIVE MEDICINE MARKET FOR CARDIOVASCULAR DISEASES, BY COUNTRY, 2021–2028 (USD MILLION)
  • TABLE 90 ASIA PACIFIC: REGENERATIVE MEDICINE MARKET FOR CARDIOVASCULAR DISEASES, BY COUNTRY, 2021–2028 (USD MILLION)
  • TABLE 91 LATIN AMERICA: REGENERATIVE MEDICINE MARKET FOR CARDIOVASCULAR DISEASES, BY COUNTRY, 2021–2028 (USD MILLION)
  • TABLE 92 LIST OF PIPELINE PRODUCTS FOR REGENERATIVE MEDICINE IN OPHTHALMOLOGY
  • TABLE 93 REGENERATIVE MEDICINE MARKET FOR OPHTHALMOLOGY, BY REGION, 2021–2028 (USD MILLION)
  • TABLE 94 NORTH AMERICA: REGENERATIVE MEDICINE MARKET FOR OPHTHALMOLOGY, BY COUNTRY, 2021–2028 (USD MILLION)
  • TABLE 95 EUROPE: REGENERATIVE MEDICINE MARKET FOR OPHTHALMOLOGY, BY COUNTRY, 2021–2028 (USD MILLION)
  • TABLE 96 ASIA PACIFIC: REGENERATIVE MEDICINE MARKET FOR OPHTHALMOLOGY, BY COUNTRY, 2021–2028 (USD MILLION)
  • TABLE 97 LATIN AMERICA: REGENERATIVE MEDICINE MARKET FOR OPHTHALMOLOGY, BY COUNTRY, 2021–2028 (USD MILLION)
  • TABLE 98 REGENERATIVE MEDICINE MARKET FOR NEUROLOGY, BY REGION, 2021–2028 (USD MILLION)
  • TABLE 99 NORTH AMERICA: REGENERATIVE MEDICINE MARKET FOR NEUROLOGY, BY COUNTRY, 2021–2028 (USD MILLION)
  • TABLE 100 EUROPE: REGENERATIVE MEDICINE MARKET FOR NEUROLOGY, BY COUNTRY, 2021–2028 (USD MILLION)
  • TABLE 101 ASIA PACIFIC: REGENERATIVE MEDICINE MARKET FOR NEUROLOGY, BY COUNTRY, 2021–2028 (USD MILLION)
  • TABLE 102 LATIN AMERICA: REGENERATIVE MEDICINE MARKET FOR NEUROLOGY, BY COUNTRY, 2021–2028 (USD MILLION)
  • TABLE 103 REGENERATIVE MEDICINE MARKET FOR OTHER THERAPEUTIC AREAS, BY REGION, 2021–2028 (USD MILLION)
  • TABLE 104 NORTH AMERICA: REGENERATIVE MEDICINE MARKET FOR OTHER THERAPEUTIC AREAS, BY COUNTRY, 2021–2028 (USD MILLION)
  • TABLE 105 EUROPE: REGENERATIVE MEDICINE MARKET FOR OTHER THERAPEUTIC AREAS, BY COUNTRY, 2021–2028 (USD MILLION)
  • TABLE 106 ASIA PACIFIC: REGENERATIVE MEDICINE MARKET FOR OTHER THERAPEUTIC AREAS, BY COUNTRY, 2021–2028 (USD MILLION)
  • TABLE 107 LATIN AMERICA: REGENERATIVE MEDICINE MARKET FOR OTHER THERAPEUTIC AREAS, BY COUNTRY, 2021–2028 (USD MILLION)
  • TABLE 108 NUMBER OF CLINICAL TRIALS FOR REGENERATIVE MEDICINE (2022)
  • TABLE 109 REGENERATIVE MEDICINE MARKET, BY REGION, 2021–2028 (USD MILLION)
  • TABLE 110 NORTH AMERICA: REGENERATIVE MEDICINE MARKET, BY COUNTRY, 2021–2028 (USD MILLION)
  • TABLE 111 NORTH AMERICA: REGENERATIVE MEDICINE MARKET, BY PRODUCT, 2021–2028 (USD MILLION)
  • TABLE 112 NORTH AMERICA: REGENERATIVE MEDICINE MARKET FOR CELL THERAPY, BY TYPE, 2021–2028 (USD MILLION)
  • TABLE 113 NORTH AMERICA: REGENERATIVE MEDICINE MARKET FOR STEM CELL THERAPY, BY TYPE, 2021–2028 (USD MILLION)
  • TABLE 114 NORTH AMERICA: REGENERATIVE MEDICINE MARKET FOR STEM CELL THERAPY PRODUCTS, BY TYPE, 2021–2028 (USD MILLION)
  • TABLE 115 NORTH AMERICA: REGENERATIVE MEDICINE MARKET, BY THERAPEUTIC AREA, 2021–2028 (USD MILLION)
  • TABLE 116 US: REGENERATIVE MEDICINE MARKET, BY PRODUCT, 2021–2028 (USD MILLION)
  • TABLE 117 US: REGENERATIVE MEDICINE MARKET FOR CELL THERAPY, BY TYPE, 2021–2028 (USD MILLION)
  • TABLE 118 US: REGENERATIVE MEDICINE MARKET FOR STEM CELL THERAPY, BY TYPE, 2021–2028 (USD MILLION)
  • TABLE 119 US: REGENERATIVE MEDICINE MARKET FOR STEM CELL THERAPY PRODUCTS, BY TYPE, 2021–2028 (USD MILLION)
  • TABLE 120 US: REGENERATIVE MEDICINE MARKET, BY THERAPEUTIC AREA, 2021–2028 (USD MILLION)
  • TABLE 121 CANADA: REGENERATIVE MEDICINE MARKET, BY PRODUCT, 2021–2028 (USD MILLION)
  • TABLE 122 CANADA: REGENERATIVE MEDICINE MARKET FOR CELL THERAPY, BY TYPE, 2021–2028 (USD MILLION)
  • TABLE 123 CANADA: REGENERATIVE MEDICINE MARKET FOR STEM CELL THERAPY, BY TYPE, 2021–2028 (USD MILLION)
  • TABLE 124 CANADA: REGENERATIVE MEDICINE MARKET FOR STEM CELL THERAPY PRODUCTS, BY TYPE, 2021–2028 (USD MILLION)
  • TABLE 125 CANADA: REGENERATIVE MEDICINE MARKET, BY THERAPEUTIC AREA, 2021–2028 (USD MILLION)
  • TABLE 126 EUROPE: REGENERATIVE MEDICINE MARKET, BY COUNTRY, 2021–2028 (USD MILLION)
  • TABLE 127 EUROPE: REGENERATIVE MEDICINE MARKET, BY PRODUCT, 2021–2028 (USD MILLION)
  • TABLE 128 EUROPE: REGENERATIVE MEDICINE MARKET FOR CELL THERAPY, BY TYPE, 2021–2028 (USD MILLION)
  • TABLE 129 EUROPE: REGENERATIVE MEDICINE MARKET FOR STEM CELL THERAPY, BY TYPE, 2021–2028 (USD MILLION)
  • TABLE 130 EUROPE: REGENERATIVE MEDICINE MARKET FOR STEM CELL THERAPY PRODUCTS, BY TYPE, 2021–2028 (USD MILLION)
  • TABLE 131 EUROPE: REGENERATIVE MEDICINE MARKET, BY THERAPEUTIC AREA, 2021–2028 (USD MILLION)
  • TABLE 132 GERMANY: REGENERATIVE MEDICINE MARKET, BY PRODUCT, 2021–2028 (USD MILLION)
  • TABLE 133 GERMANY: REGENERATIVE MEDICINE MARKET FOR CELL THERAPY, BY TYPE, 2021–2028 (USD MILLION)
  • TABLE 134 GERMANY: REGENERATIVE MEDICINE MARKET FOR STEM CELL THERAPY, BY TYPE, 2021–2028 (USD MILLION)
  • TABLE 135 GERMANY: REGENERATIVE MEDICINE MARKET FOR STEM CELL THERAPY PRODUCTS, BY TYPE, 2021–2028 (USD MILLION)
  • TABLE 136 GERMANY: REGENERATIVE MEDICINE MARKET, BY THERAPEUTIC AREA, 2021–2028 (USD MILLION)
  • TABLE 137 UK: REGENERATIVE MEDICINE MARKET, BY PRODUCT, 2021–2028 (USD MILLION)
  • TABLE 138 UK: REGENERATIVE MEDICINE MARKET FOR CELL THERAPY, BY TYPE, 2021–2028 (USD MILLION)
  • TABLE 139 UK: REGENERATIVE MEDICINE MARKET FOR STEM CELL THERAPY, BY TYPE, 2021–2028 (USD MILLION)
  • TABLE 140 UK: REGENERATIVE MEDICINE MARKET FOR STEM CELL THERAPY PRODUCTS, BY TYPE, 2021–2028 (USD MILLION)
  • TABLE 141 UK: REGENERATIVE MEDICINE MARKET, BY THERAPEUTIC AREA, 2021–2028 (USD MILLION)
  • TABLE 142 FRANCE: REGENERATIVE MEDICINE MARKET, BY PRODUCT, 2021–2028 (USD MILLION)
  • TABLE 143 FRANCE: REGENERATIVE MEDICINE MARKET FOR CELL THERAPY, BY TYPE, 2021–2028 (USD MILLION)
  • TABLE 144 FRANCE: REGENERATIVE MEDICINE MARKET FOR STEM CELL THERAPY, BY TYPE, 2021–2028 (USD MILLION)
  • TABLE 145 FRANCE: REGENERATIVE MEDICINE MARKET FOR STEM CELL THERAPY PRODUCTS, BY TYPE, 2021–2028 (USD MILLION)
  • TABLE 146 FRANCE: REGENERATIVE MEDICINE MARKET, BY THERAPEUTIC AREA, 2021–2028 (USD MILLION)
  • TABLE 147 ITALY: REGENERATIVE MEDICINE MARKET, BY PRODUCT, 2021–2028 (USD MILLION)
  • TABLE 148 ITALY: REGENERATIVE MEDICINE MARKET FOR CELL THERAPY, BY TYPE, 2021–2028 (USD MILLION)
  • TABLE 149 ITALY: REGENERATIVE MEDICINE MARKET FOR STEM CELL THERAPY, BY TYPE, 2021–2028 (USD MILLION)
  • TABLE 150 ITALY: REGENERATIVE MEDICINE MARKET FOR STEM CELL THERAPY PRODUCTS, BY TYPE, 2021–2028 (USD MILLION)
  • TABLE 151 ITALY: REGENERATIVE MEDICINE MARKET, BY THERAPEUTIC AREA, 2021–2028 (USD MILLION)
  • TABLE 152 SPAIN: REGENERATIVE MEDICINE MARKET, BY PRODUCT, 2021–2028 (USD MILLION)
  • TABLE 153 SPAIN: REGENERATIVE MEDICINE MARKET FOR CELL THERAPY, BY TYPE, 2021–2028 (USD MILLION)
  • TABLE 154 SPAIN: REGENERATIVE MEDICINE MARKET FOR STEM CELL THERAPY, BY TYPE, 2021–2028 (USD MILLION)
  • TABLE 155 SPAIN: REGENERATIVE MEDICINE MARKET FOR STEM CELL THERAPY PRODUCTS, BY TYPE, 2021–2028 (USD MILLION)
  • TABLE 156 SPAIN: REGENERATIVE MEDICINE MARKET, BY THERAPEUTIC AREA, 2021–2028 (USD MILLION)
  • TABLE 157 REST OF EUROPE: REGENERATIVE MEDICINE MARKET, BY PRODUCT, 2021–2028 (USD MILLION)
  • TABLE 158 REST OF EUROPE: REGENERATIVE MEDICINE MARKET FOR CELL THERAPY, BY TYPE, 2021–2028 (USD MILLION)
  • TABLE 159 REST OF EUROPE: REGENERATIVE MEDICINE MARKET FOR STEM CELL THERAPY, BY TYPE, 2021–2028 (USD MILLION)
  • TABLE 160 REST OF EUROPE: REGENERATIVE MEDICINE MARKET FOR STEM CELL THERAPY PRODUCTS, BY TYPE, 2021–2028 (USD MILLION)
  • TABLE 161 REST OF EUROPE: REGENERATIVE MEDICINE MARKET, BY THERAPEUTIC AREA, 2021–2028 (USD MILLION)
  • TABLE 162 ASIA PACIFIC: REGENERATIVE MEDICINE MARKET, BY COUNTRY, 2021–2028 (USD MILLION)
  • TABLE 163 ASIA PACIFIC: REGENERATIVE MEDICINE MARKET, BY PRODUCT, 2021–2028 (USD MILLION)
  • TABLE 164 ASIA PACIFIC: REGENERATIVE MEDICINE MARKET FOR CELL THERAPY, BY TYPE, 2021–2028 (USD MILLION)
  • TABLE 165 ASIA PACIFIC: REGENERATIVE MEDICINE MARKET FOR STEM CELL THERAPY, BY TYPE, 2021–2028 (USD MILLION)
  • TABLE 166 ASIA PACIFIC: REGENERATIVE MEDICINE MARKET FOR STEM CELL THERAPY PRODUCTS, BY TYPE, 2021–2028 (USD MILLION)
  • TABLE 167 ASIA PACIFIC: REGENERATIVE MEDICINE MARKET, BY THERAPEUTIC AREA, 2021–2028 (USD MILLION)
  • TABLE 168 CHINA: REGENERATIVE MEDICINE MARKET, BY PRODUCT, 2021–2028 (USD MILLION)
  • TABLE 169 CHINA: REGENERATIVE MEDICINE MARKET FOR CELL THERAPY, BY TYPE, 2021–2028 (USD MILLION)
  • TABLE 170 CHINA: REGENERATIVE MEDICINE MARKET FOR STEM CELL THERAPY, BY TYPE, 2021–2028 (USD MILLION)
  • TABLE 171 CHINA: REGENERATIVE MEDICINE MARKET FOR STEM CELL THERAPY PRODUCTS, BY TYPE, 2021–2028 (USD MILLION)
  • TABLE 172 CHINA: REGENERATIVE MEDICINE MARKET, BY THERAPEUTIC AREA, 2021–2028 (USD MILLION)
  • TABLE 173 JAPAN: REGENERATIVE MEDICINE MARKET, BY PRODUCT, 2021–2028 (USD MILLION)
  • TABLE 174 JAPAN: REGENERATIVE MEDICINE MARKET FOR CELL THERAPY, BY TYPE, 2021–2028 (USD MILLION)
  • TABLE 175 JAPAN: REGENERATIVE MEDICINE MARKET FOR STEM CELL THERAPY, BY TYPE, 2021–2028 (USD MILLION)
  • TABLE 176 JAPAN: REGENERATIVE MEDICINE MARKET FOR STEM CELL THERAPY PRODUCTS, BY TYPE, 2021–2028 (USD MILLION)
  • TABLE 177 JAPAN: REGENERATIVE MEDICINE MARKET, BY THERAPEUTIC AREA, 2021–2028 (USD MILLION)
  • TABLE 178 INDIA: REGENERATIVE MEDICINE MARKET, BY PRODUCT, 2021–2028 (USD MILLION)
  • TABLE 179 INDIA: REGENERATIVE MEDICINE MARKET FOR CELL THERAPY, BY TYPE, 2021–2028 (USD MILLION)
  • TABLE 180 INDIA: REGENERATIVE MEDICINE MARKET FOR STEM CELL THERAPY, BY TYPE, 2021–2028 (USD MILLION)
  • TABLE 181 INDIA: REGENERATIVE MEDICINE MARKET FOR STEM CELL THERAPY PRODUCTS, BY TYPE, 2021–2028 (USD MILLION)
  • TABLE 182 INDIA: REGENERATIVE MEDICINE MARKET, BY THERAPEUTIC AREA, 2021–2028 (USD MILLION)
  • TABLE 183 SOUTH KOREA: REGENERATIVE MEDICINE MARKET, BY PRODUCT, 2021–2028 (USD MILLION)
  • TABLE 184 SOUTH KOREA: REGENERATIVE MEDICINE MARKET FOR CELL THERAPY, BY TYPE, 2021–2028 (USD MILLION)
  • TABLE 185 SOUTH KOREA: REGENERATIVE MEDICINE MARKET FOR STEM CELL THERAPY, BY TYPE, 2021–2028 (USD MILLION)
  • TABLE 186 SOUTH KOREA: REGENERATIVE MEDICINE MARKET FOR STEM CELL THERAPY PRODUCTS, BY TYPE, 2021–2028 (USD MILLION)
  • TABLE 187 SOUTH KOREA: REGENERATIVE MEDICINE MARKET, BY THERAPEUTIC AREA, 2021–2028 (USD MILLION)
  • TABLE 188 AUSTRALIA: REGENERATIVE MEDICINE MARKET, BY PRODUCT, 2021–2028 (USD MILLION)
  • TABLE 189 AUSTRALIA: REGENERATIVE MEDICINE MARKET FOR CELL THERAPY, BY TYPE, 2021–2028 (USD MILLION)
  • TABLE 190 AUSTRALIA: REGENERATIVE MEDICINE MARKET FOR STEM CELL THERAPY, BY TYPE, 2021–2028 (USD MILLION)
  • TABLE 191 AUSTRALIA: REGENERATIVE MEDICINE MARKET FOR STEM CELL THERAPY PRODUCTS, BY TYPE, 2021–2028 (USD MILLION)
  • TABLE 192 AUSTRALIA: REGENERATIVE MEDICINE MARKET, BY THERAPEUTIC AREA, 2021–2028 (USD MILLION)
  • TABLE 193 REST OF ASIA PACIFIC: REGENERATIVE MEDICINE MARKET, BY PRODUCT, 2021–2028 (USD MILLION)
  • TABLE 194 REST OF ASIA PACIFIC: REGENERATIVE MEDICINE MARKET FOR CELL THERAPY, BY TYPE, 2021–2028 (USD MILLION)
  • TABLE 195 REST OF ASIA PACIFIC: REGENERATIVE MEDICINE MARKET FOR STEM CELL THERAPY, BY TYPE, 2021–2028 (USD MILLION)
  • TABLE 196 REST OF ASIA PACIFIC: REGENERATIVE MEDICINE MARKET FOR STEM CELL THERAPY PRODUCTS, BY TYPE, 2021–2028 (USD MILLION)
  • TABLE 197 REST OF ASIA PACIFIC: REGENERATIVE MEDICINE MARKET, BY THERAPEUTIC AREA, 2021–2028 (USD MILLION)
  • TABLE 198 LATIN AMERICA: REGENERATIVE MEDICINE MARKET, BY COUNTRY, 2021–2028 (USD MILLION)
  • TABLE 199 LATIN AMERICA: REGENERATIVE MEDICINE MARKET, BY PRODUCT, 2021–2028 (USD MILLION)
  • TABLE 200 LATIN AMERICA: REGENERATIVE MEDICINE MARKET FOR CELL THERAPY, BY TYPE, 2021–2028 (USD MILLION)
  • TABLE 201 LATIN AMERICA: REGENERATIVE MEDICINE MARKET FOR STEM CELL THERAPY, BY TYPE, 2021–2028 (USD MILLION)
  • TABLE 202 LATIN AMERICA: REGENERATIVE MEDICINE MARKET FOR STEM CELL THERAPY PRODUCTS, BY TYPE, 2021–2028 (USD MILLION)
  • TABLE 203 LATIN AMERICA: REGENERATIVE MEDICINE MARKET, BY THERAPEUTIC AREA, 2021–2028 (USD MILLION)
  • TABLE 204 BRAZIL: REGENERATIVE MEDICINE MARKET, BY PRODUCT, 2021–2028 (USD MILLION)
  • TABLE 205 BRAZIL: REGENERATIVE MEDICINE MARKET FOR CELL THERAPY, BY TYPE, 2021–2028 (USD MILLION)
  • TABLE 206 BRAZIL: REGENERATIVE MEDICINE MARKET FOR STEM CELL THERAPY, BY TYPE, 2021–2028 (USD MILLION)
  • TABLE 207 BRAZIL: REGENERATIVE MEDICINE MARKET FOR STEM CELL THERAPY PRODUCTS, BY TYPE, 2021–2028 (USD MILLION)
  • TABLE 208 BRAZIL: REGENERATIVE MEDICINE MARKET, BY THERAPEUTIC AREA, 2021–2028 (USD MILLION)
  • TABLE 209 REST OF LATIN AMERICA: REGENERATIVE MEDICINE MARKET, BY PRODUCT, 2021–2028 (USD MILLION)
  • TABLE 210 REST OF LATIN AMERICA: REGENERATIVE MEDICINE MARKET FOR CELL THERAPY, BY TYPE, 2021–2028 (USD MILLION)
  • TABLE 211 REST OF LATIN AMERICA: REGENERATIVE MEDICINE MARKET FOR STEM CELL THERAPY, BY TYPE, 2021–2028 (USD MILLION)
  • TABLE 212 REST OF LATIN AMERICA: REGENERATIVE MEDICINE MARKET FOR STEM CELL THERAPY PRODUCTS, BY TYPE, 2021–2028 (USD MILLION)
  • TABLE 213 REST OF LATIN AMERICA: REGENERATIVE MEDICINE MARKET, BY THERAPEUTIC AREA, 2021–2028 (USD MILLION)
  • TABLE 214 MIDDLE EAST: REGENERATIVE MEDICINE MARKET, BY PRODUCT, 2021–2028 (USD MILLION)
  • TABLE 215 MIDDLE EAST: REGENERATIVE MEDICINE MARKET FOR CELL THERAPY, BY TYPE, 2021–2028 (USD MILLION)
  • TABLE 216 MIDDLE EAST: REGENERATIVE MEDICINE MARKET FOR STEM CELL THERAPY, BY TYPE, 2021–2028 (USD MILLION)
  • TABLE 217 MIDDLE EAST: REGENERATIVE MEDICINE MARKET FOR STEM CELL THERAPY PRODUCTS, BY TYPE, 2021–2028 (USD MILLION)
  • TABLE 218 MIDDLE EAST: REGENERATIVE MEDICINE MARKET, BY THERAPEUTIC AREA, 2021–2028 (USD MILLION)
  • TABLE 219 AFRICA: REGENERATIVE MEDICINE MARKET, BY PRODUCT, 2021–2028 (USD MILLION)
  • TABLE 220 AFRICA: REGENERATIVE MEDICINE MARKET FOR CELL THERAPY, BY TYPE, 2021–2028 (USD MILLION)
  • TABLE 221 AFRICA: REGENERATIVE MEDICINE MARKET FOR STEM CELL THERAPY, BY TYPE, 2021–2028 (USD MILLION)
  • TABLE 222 AFRICA: REGENERATIVE MEDICINE MARKET FOR STEM CELL THERAPY PRODUCTS, BY TYPE, 2021–2028 (USD MILLION)
  • TABLE 223 AFRICA: REGENERATIVE MEDICINE MARKET, BY THERAPEUTIC AREA, 2021–2028 (USD MILLION)
  • TABLE 224 REGENERATIVE MEDICINE MARKET: STRATEGIES ADOPTED BY KEY PLAYERS
  • TABLE 225 REGENERATIVE MEDICINE MARKET: DEGREE OF COMPETITION
  • TABLE 226 REGENERATIVE MEDICINE MARKET: PRODUCT FOOTPRINT ANALYSIS OF KEY PLAYERS
  • TABLE 227 REGENERATIVE MEDICINE MARKET: REGIONAL FOOTPRINT ANALYSIS OF KEY PLAYERS
  • TABLE 228 REGENERATIVE MEDICINE MARKET: DETAILED LIST OF KEY START-UP/ SME PLAYERS
  • TABLE 229 REGENERATIVE MEDICINE MARKET: COMPETITIVE BENCHMARKING OF START-UP/SME PLAYERS
  • TABLE 230 REGENERATIVE MEDICINE MARKET: PRODUCT APPROVALS/LAUNCHES, JANUARY 2020 TO DECEMBER 2023
  • TABLE 231 REGENERATIVE MEDICINE MARKET: DEALS, JANUARY 2020 TO DECEMBER 2023
  • TABLE 232 REGENERATIVE MEDICINE MARKET: OTHER DEVELOPMENTS, JANUARY 2020 TO DECEMBER 2023
  • TABLE 233 NOVARTIS AG: COMPANY OVERVIEW
  • TABLE 234 BIOGEN INC.: COMPANY OVERVIEW
  • TABLE 235 GILEAD SCIENCES, INC.: COMPANY OVERVIEW
  • TABLE 236 SAREPTA THERAPEUTICS, INC.: COMPANY OVERVIEW
  • TABLE 237 AMGEN, INC.: COMPANY OVERVIEW
  • TABLE 238 SMITH+NEPHEW: COMPANY OVERVIEW
  • TABLE 239 MEDIPOST CO., LTD.: COMPANY OVERVIEW
  • TABLE 240 JCR PHARMACEUTICALS CO., LTD.: COMPANY OVERVIEW
  • TABLE 241 TAKEDA PHARMACEUTICAL COMPANY LIMITED: COMPANY OVERVIEW
  • TABLE 242 CORESTEM, INC.: COMPANY OVERVIEW
  • TABLE 243 VERICEL CORPORATION: COMPANY OVERVIEW
  • TABLE 244 MIMEDX GROUP, INC.: COMPANY OVERVIEW
  • TABLE 245 ORGANOGENESIS INC.: COMPANY OVERVIEW
  • TABLE 246 MEDTRONIC: COMPANY OVERVIEW
  • TABLE 247 BRISTOL-MYERS SQUIBB COMPANY: COMPANY OVERVIEW
  • TABLE 248 ORTHOCELL LTD.: COMPANY OVERVIEW
  • TABLE 249 MESOBLAST LTD.: COMPANY OVERVIEW
  • TABLE 250 BIORESTORATIVE THERAPIES, INC.: COMPANY OVERVIEW
  • TABLE 251 PLURISTEM THERAPEUTICS INC.: COMPANY OVERVIEW
  • TABLE 252 TEGOSCIENCE: COMPANY OVERVIEW
  • TABLE 253 ANTEROGEN.CO.,LTD.: COMPANY OVERVIEW
  • TABLE 254 BLUEBIRD BIO, INC.: COMPANY OVERVIEW
  • TABLE 255 STEMPEUTICS RESEARCH PVT. LTD.: COMPANY OVERVIEW
  • TABLE 256 SIBIONO GENETECH CO. LTD.: COMPANY OVERVIEW
  • TABLE 257 ASPECT BIOSYSTEMS: COMPANY OVERVIEW
  • TABLE 258 ATHERSYS, INC.: COMPANY OVERVIEW
LIST OF FIGURES
 
  • FIGURE 1 RESEARCH DESIGN
  • FIGURE 2 BREAKDOWN OF PRIMARIES: REGENERATIVE MEDICINE MARKET
  • FIGURE 3 MARKET SIZE ESTIMATION FOR SUPPLY-SIDE ANALYSIS: REGENERATIVE MEDICINE MARKET, 2022
  • FIGURE 4 MARKET SIZE ESTIMATION: REVENUE SHARE ANALYSIS, 2022
  • FIGURE 5 NOVARTIS AG: REVENUE SHARE ANALYSIS, 2022
  • FIGURE 6 PRODUCT-BASED REVENUE ANALYSIS, 2022
  • FIGURE 7 VALIDATION FROM PRIMARY EXPERTS
  • FIGURE 8 MARKET SIZE ESTIMATION METHODOLOGY: TOP-DOWN APPROACH
  • FIGURE 9 CAGR PROJECTIONS: REGENERATIVE MEDICINE MARKET
  • FIGURE 10 GROWTH ANALYSIS OF DRIVERS, RESTRAINTS, CHALLENGES, AND OPPORTUNITIES IN REGENERATIVE MEDICINE MARKET
  • FIGURE 11 DATA TRIANGULATION METHODOLOGY
  • FIGURE 12 REGENERATIVE MEDICINE MARKET, BY PRODUCT, 2023 VS. 2028 (USD MILLION)
  • FIGURE 13 REGENERATIVE MEDICINE MARKET, BY THERAPEUTIC AREA, 2023 VS. 2028 (USD MILLION)
  • FIGURE 14 GEOGRAPHICAL SNAPSHOT OF REGENERATIVE MEDICINE MARKET
  • FIGURE 15 FOCUS ON PERSONALISED MEDICINE TO DRIVE MARKET GROWTH
  • FIGURE 16 CELL THERAPY TO COMMAND LARGEST SHARE OF NORTH AMERICAN REGENERATIVE MEDICINE MARKET
  • FIGURE 17 CHINA TO REGISTER HIGHEST GROWTH DURING FORECAST PERIOD
  • FIGURE 18 REGENERATIVE MEDICINE MARKET: DRIVERS, RESTRAINTS, OPPORTUNITIES, AND CHALLENGES
  • FIGURE 19 PERCENTAGE OF FDA APPROVALS FOR PERSONALIZED MEDICINE PRODUCTS (2018–2022)
  • FIGURE 20 REVENUE SHIFT TOWARD REGENERATIVE MEDICINE COMPANIES
  • FIGURE 21 SUPPLY CHAIN ANALYSIS: REGENERATIVE MEDICINE MARKET
  • FIGURE 22 VALUE CHAIN ANALYSIS: REGENERATIVE MEDICINE MARKET
  • FIGURE 23 REGENERATIVE MEDICINE MARKET: ECOSYSTEM ANALYSIS
  • FIGURE 24 KEY STEPS IN GENE THERAPY
  • FIGURE 25 INFLUENCE OF STAKEHOLDERS ON BUYING PROCESS OF REGENERATIVE MEDICINE PRODUCTS
  • FIGURE 26 KEY BUYING CRITERIA FOR END USERS
  • FIGURE 27 NUMBER OF PLAYERS IN REGENERATIVE MEDICINE MARKET, BY REGION, 2020–2022
  • FIGURE 28 NORTH AMERICA: REGENERATIVE MEDICINE MARKET SNAPSHOT
  • FIGURE 29 ASIA PACIFIC: REGENERATIVE MEDICINE MARKET SNAPSHOT
  • FIGURE 30 REVENUE ANALYSIS OF KEY PLAYERS (2020–2022)
  • FIGURE 31 MARKET SHARE ANALYSIS OF KEY PLAYERS (2022)
  • FIGURE 32 REGENERATIVE MEDICINE MARKET: COMPANY EVALUATION MATRIX, 2022
  • FIGURE 33 REGENERATIVE MEDICINE MARKET: START-UP/SME EVALUATION MATRIX, 2022
  • FIGURE 34 NOVARTIS AG: COMPANY SNAPSHOT (2022)
  • FIGURE 35 BIOGEN INC.: COMPANY SNAPSHOT (2022)
  • FIGURE 36 GILEAD SCIENCES, INC.: COMPANY SNAPSHOT (2022)
  • FIGURE 37 SAREPTA THERAPEUTICS: COMPANY SNAPSHOT (2022)
  • FIGURE 38 AMGEN, INC.: COMPANY SNAPSHOT (2022)
  • FIGURE 39 SMITH+NEPHEW: COMPANY SNAPSHOT (2022)
  • FIGURE 40 MEDIPOST CO., LTD.: COMPANY SNAPSHOT
  • FIGURE 41 JCR PHARMACEUTICALS CO., LTD.: COMPANY SNAPSHOT (2022)
  • FIGURE 42 TAKEDA PHARMACEUTICAL COMPANY LIMITED: COMPANY SNAPSHOT (2022)
  • FIGURE 43 CORESTEM, INC.: COMPANY SNAPSHOT (2021)
  • FIGURE 44 VERICEL CORPORATION: COMPANY SNAPSHOT (2022)
  • FIGURE 45 MIMEDX GROUP, INC.: COMPANY SNAPSHOT (2022)
  • FIGURE 46 ORGANOGENESIS INC.: COMPANY SNAPSHOT (2022)
  • FIGURE 47 MEDTRONIC: COMPANY SNAPSHOT (2022)
  • FIGURE 48 BRISTOL-MYERS SQUIBB COMPANY: COMPANY SNAPSHOT (2022)

This study involved four major activities in estimating the current size of the regenerative medicine market. Exhaustive secondary research was carried out to collect information on the market, its peer markets, and its parent market. These findings, assumptions, and sizing were then validated with industry experts across the value chain through primary research. Both top-down and bottom-up approaches were employed to estimate the complete market size. After that, market breakdown and data triangulation procedures were used to estimate the market size of segments and subsegments.

Secondary Research

Secondary research was used mainly to identify and collect information for the extensive technical, market-oriented, and commercial study of the regenerative medicine market. The secondary sources used for this study include the Alliance for Regenerative Medicine (ARM), American Society for Cell Biology (ASCB), Centre for Commercialization of Regenerative Medicine (CCRM), European Society of Gene & Cell Therapy (ESGCT), National Center for Biotechnology Information (NCBI), Annual Reports, SEC Filings, Investor Presentations, Expert Interviews, and MarketsandMarkets Analysis. These sources were also used to obtain key information about major players, global product revenues, market classification, and segmentation according to industry trends, regional/country-level markets, market developments, and technology perspectives. Secondary data was collected and analyzed to arrive at the overall size of the global regenerative medicine market, which was validated through primary research.

Primary Research

In-depth interviews were conducted with various primary respondents, including key industry participants, subject-matter experts (SMEs), C-level executives of key market players, and industry consultants, among other experts, to obtain and verify the critical qualitative and quantitative information as well as assess future prospects of the market. Various primary sources from both the supply and demand sides of the market were interviewed to obtain qualitative and quantitative information. The following is a breakdown of the primary respondents:

Regenerative  medicine Market Size, and Share

Note: Tiers are defined based on a company’s total revenue. As of 2022, Tier 1 = >USD 1 Bn, Tier 2 = USD 500 Mn to USD 1 Bn, and Tier 3 <USD 500 Mn.

To know about the assumptions considered for the study, download the pdf brochure

Market Size Estimation

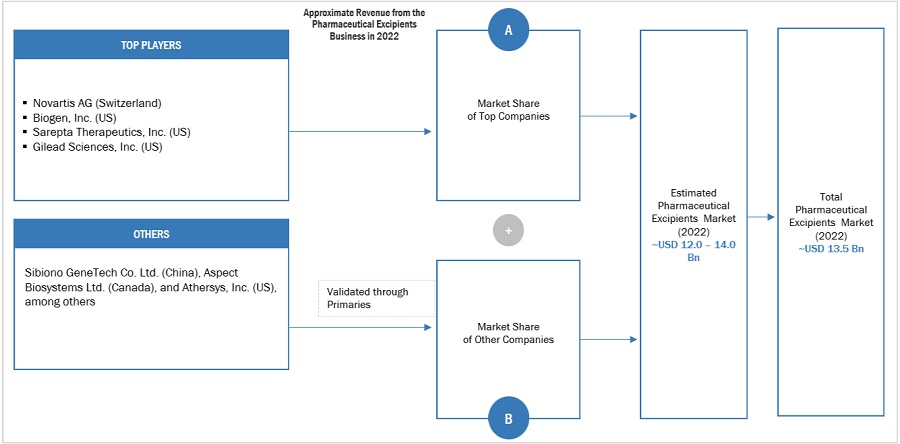
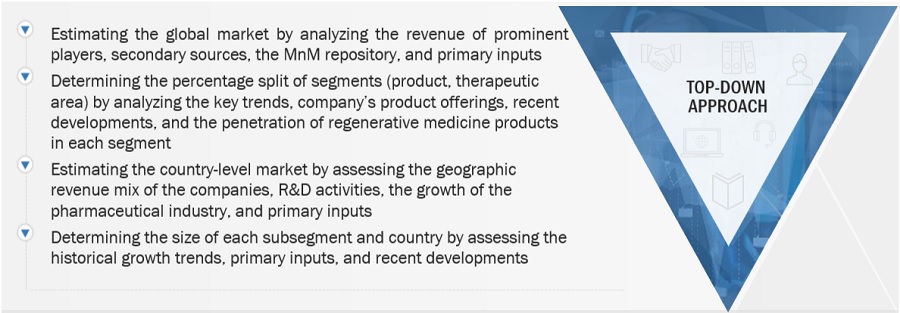
The global size of the regenerative medicine market was estimated through multiple approaches. A detailed market estimation approach was followed to estimate and validate the value of the market and other dependent submarkets. These methods were also used extensively to estimate the size of various subsegments in the market. The research methodology used to estimate the market size includes the following:

  • The major players in the industry and market have been identified through extensive primary and secondary research.
  • The product and company revenues generated from the regenerative medicine business of players operating in the market have been determined through secondary research and primary analysis.
  • All percentage shares, splits, and breakdowns have been determined using secondary sources and verified through primary sources.

Market Size Estimation Methodology-Bottom-up approach
Regenerative  medicine Market Size, and Share

To know about the assumptions considered for the study, Request for Free Sample Report

Top-down Approach-
Regenerative  medicine Market Size, and Share

Data Triangulation

After estimating the overall market size from the market size estimation process, the total market was split into several segments and subsegments. To complete the overall market engineering process and arrive at the exact statistics for all segments and subsegments, data triangulation and market breakdown procedures were employed, wherever applicable. The data was triangulated by studying various factors and trends from both the demand and supply sides.

Market Definition

Regenerative medicine refers to a branch of medical science that focuses on repairing, replacing, or regenerating damaged or diseased cells, tissues, or organs to restore normal function. This field employs various approaches, including stem cell therapy, gene therapy, tissue engineering, and other advanced techniques, to promote the body's natural healing processes.

Key Stakeholders

  • Regenerative medicine product manufacturing companies
  • Healthcare service providers (including hospitals & specialty clinics)
  • National and regional research boards and organizations
  • Research & development organizations
  • Clinical research organizations (CROs)
  • Research laboratories & academic institutes
  • Market research & consulting firms

The main objectives of this study are as follows:

  • To define, describe, and forecast the regenerative medicine market by product, therapeutic area, and region
  • To provide detailed information regarding the major factors influencing the market growth (such as drivers, restraints, opportunities, and challenges)
  • To analyze the micromarkets with respect to individual growth trends, prospects, and contributions to the overall regenerative medicine market
  • To provide detailed information about global product revenues.
  • To analyze the opportunities for stakeholders and provide details of the competitive landscape for market leaders
  • To forecast the size of the market segments with respect to five regions: North America (U.S., Canada), Europe (Germany, UK, France, Italy, Spain, Rest of Europe), the Asia Pacific (China, Japan, India, Australia, South Korea, Rest of Asia Pacific), Latin America (Brazil, Rest of Latin America), the Middle East and Africa
  • To profile the key players and analyze their market shares and core competencies
  • To track and analyze competitive developments, such as product launches, pipeline products (Phase 3 Regenerative medicines clinical trials molecules), partnerships, agreements, collaborations, expansions, and strategic alliances
  • To benchmark players within the market using the proprietary “Company Evaluation Matrix” framework, which analyzes market players on various parameters within the broad categories of business and product excellence strategy.

Available Customizations

With the given market data, MarketsandMarkets offers customizations as per the company’s specific needs. The following customization options are available for this report with additional efforts:

  • Product-Level Information

Country-wise Information:

  • Analysis for additional countries (up to five)

Company Information:

  • Detailed analysis and profiling of additional key market players across the globe
Custom Market Research Services

We will customize the research for you, in case the report listed above does not meet with your exact requirements. Our custom research will comprehensively cover the business information you require to help you arrive at strategic and profitable business decisions.

Request Customization

Instant Answers with GPT - Ask Now!

Ask real questions. Get complete answers !
Report Code
BT 4419
Published ON
Jan, 2024
Choose License Type
BUY NOW
  • SHARE
X
Request Customization
Speak to Analyst
Speak to Analyst
OR FACE-TO-FACE MEETING
PERSONALIZE THIS RESEARCH
  • Triangulate with your Own Data
  • Get Data as per your Format and Definition
  • Gain a Deeper Dive on a Specific Application, Geography, Customer or Competitor
  • Any level of Personalization
REQUEST A FREE CUSTOMIZATION
LET US HELP YOU!
  • What are the Known and Unknown Adjacencies Impacting the Regenerative Medicine Market
  • What will your New Revenue Sources be?
  • Who will be your Top Customer; what will make them switch?
  • Defend your Market Share or Win Competitors
  • Get a Scorecard for Target Partners
CUSTOMIZED WORKSHOP REQUEST
knowledgestore logo

Want to explore hidden markets that can drive new revenue in Regenerative Medicine Market?

Find Hidden Markets
  • Call Us
  • +1-888-600-6441 (Corporate office hours)
  • +1-888-600-6441 (US/Can toll free)
  • +44-800-368-9399 (UK office hours)
CONNECT WITH US
ABOUT TRUST ONLINE
©2024 MarketsandMarkets Research Private Ltd. All rights reserved
DMCA.com Protection Status
Website Feedback