Rare Gases Market By Type (Neon, Xenon, Krypton), End-Use (Manufacturing & Construction, Electronics, Automotive, Healthcare), by Transportation Mode (Cylinders, Tonnage Distribution, Bulk Delivery), by Function (Illumination, Insulation) & by Region - Forecast to 2020


[220 Pages Report] The rare gases market was valued at USD 245.9 Million in 2014, and is projected to grow worth USD 380.9 Million by 2020,to register a CAGR of 7.68% from 2015 to 2020. The increasing demand for lighting and laser applications, and the growing automobile and health care industries are the major factors driving the growth of the rare gases market. The market for xenon is projected to witness the highest growth between 2015 and 2020. In the end use segment, electronic application for rare gases are projected to grow at the highest rate. In terms of functions, the illumination segment accounted for the largest share of the total rare gases market in 2014.
This report provides a full analysis of key companies and competitive analysis of developments recorded in the industry during the last five years. Market drivers, restraints, opportunities, and challenges have also been discussed in detail. Leading players of the market, which include Praxair Inc. (U.S.), Airgas Inc. (U.S.), The Linde Group (Germany), Air Liquide S.A. (France), Air Products and Chemicals Inc. (U.S.), Messer Group (Germany), and Iceblick Ltd. (Ukraine), and Iwatani Corporation (Japan) have been profiled to provide an insight into the competitive scenario in the market.
Scope of the Report
This research categorizes the rare gases market based on type, end use, transportation mode, function, and region.
On the basis of type, the rare gases market has been segmented as follows:
- Neon
- Krypton
- Xenon
On the basis of end use, the rare gases market has been segmented as follows:
- Manufacturing & Construction
- Electronics
- Automotive and Transportation Equipment
- Health care
On the basis of functions, the rare gases market has been segmented as follows:
- Illumination
- Insulation
- Others (scanning, anesthesia, semiconductors, and satellites)
On the basis of transportation mode, the rare gases market has been segmented as follows:
- Cylinders & liquid containers
- Tonnage distribution
- Bulk and micro bulk delivery
On the basis of region, the rare gases market has been segmented as follows:
- Asia-Pacific
- Europe
- North America
- Rest of the World (RoW)
Value Addition for the Buyer:
- This report provides five year market forecasts with important statistical and analytical information on the type, end-use, transportation mode, and function.
- This report provides a list of regulations relevant to rare gases at the regional level.
- This report illustrates industry structure, driving parameters, major players, market shares, industry dynamics, and international developments relevant to rare gases markets.
- This report provides detailing of each segment, on country basis for a holistic view.
- This report provides a competitive landscape, which is a presentation of the companies� products and services.
The rare gases market is projected to reach USD 380.9 Million by 2020, at a CAGR of 7.68%, from 2015. Growth in construction, lighting, and laser applications, increasing energy prices, and rapid urbanization has fueled the growth of the rare gases market. The illumination segment held the largest share of the total rare gases market in 2014, especially in emerging markets such as China, Brazil, and India.
The rare gases market is purely application-driven and demand depends on various end users of rare gases such as electronics, manufacturing & construction, automotive & transportation equipment, and health care. The electronics segment is projected to dominate the rare gases market, by end user, from 2015 to 2020. The market is dominated by key players such as Praxair Inc. (U.S.), Airgas Inc. (U.S.), The Linde Group (Germany), Air Liquide S.A. (France), Air Products and Chemicals Inc. (U.S.), Messer Group (Germany), and Iceblick Ltd. (Ukraine). The market in this report is segmented on the basis of type, end use, transportation mode, function, and region.
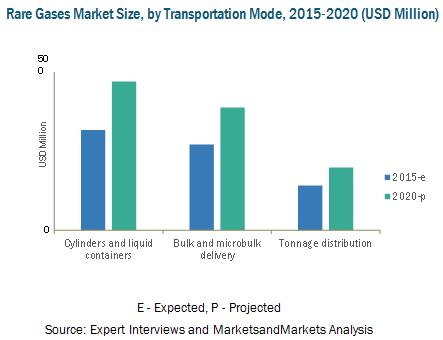
The cylinders and liquid containers segment is projected to grow at the highest CAGR of 8.18% from 2015 to 2020. Key players of the rare gases market implement different strategies such as expansions, agreements, contracts, joint ventures, and partnerships to gain a larger share in the market.
Rare gases are a global commodity as they are not based on local production and supply; however, the pricing is highly dependent on the balance of global demand, supply, and speculation. One of the main strategies adopted by rare gas manufacturing companies is mergers & acquisitions. Companies are constantly investing in research & development activities to generate new ways to expand the market of rare gases to suit the growing technological requirements in various applications. Companies are adopting inorganic growth strategies such as acquisitions to cope with the increasing demand for rare gases in key emerging markets. These strategies have helped companies to create a large customer and partner base in key markets.
 Exclusive indicates content/data unique to MarketsandMarkets and not available with any competitors.
Table of Contents
1 Introduction (Page No. - 22)
1.1 Objectives of the Study
1.2 Market Definition
1.3 Study Scope
1.3.1 Years Considered
1.4 Currency Considered
1.5 Volume Considered
1.6 Stakeholders
2 Research Methodology (Page No. - 25)
2.1 Research Data
2.1.1 Secondary Data
2.1.1.1 Key Data From Secondary Sources
2.1.2 Primary Data
2.1.2.1 Key Data From Primary Sources
2.1.2.2 Breakdown of Primary Interviews
2.2 Factor Analysis
2.2.1 Introduction
2.2.2 Demand-Side Analysis
2.2.2.1 Rising Population
2.2.2.2 Increasing Income and Spending Capacity
2.2.2.3 Industrialization
2.2.3 Supply-Side Analysis
2.2.3.1 Industry Regulations
2.2.3.2 Fluctuations in Fuel Prices
2.3 Market Size Estimation
2.4 Market Breakdown and Data Triangulation
2.5 Research Assumptions and Limitations
2.5.1 Assumptions
2.5.2 Limitations
3 Executive Summary (Page No. - 37)
3.1 Growth in the Automotive and Lighting Industry Drives the Rare Gases Market
3.2 Evolution of Rare Gases
3.3 Factors Driving the Rare Gases Market
3.4 Xenon is Projected to Hold the Largest Share By 2020
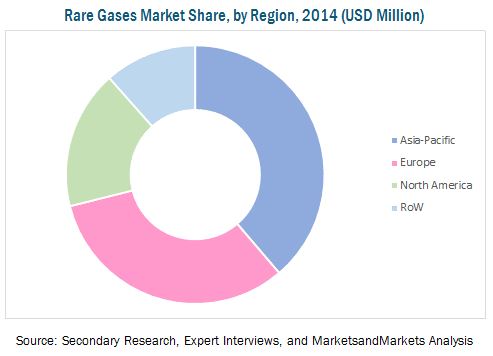
3.5 Asia-Pacific is Projected to Dominate the Global Rare Gases Market By 2020
3.6 China is Projected to Grow at the Highest Rate Between 2015 & 2020
3.7 Leading Market Players Adopted Mergers & Acquisitions as the Key Strategy From 2011 to 2015
4 Premium Insights (Page No. - 42)
4.1 Attractive Market Opportunities in the Rare Gases Market
4.2 Manufacturing and Construction Segment Occupies the Largest Share Among All End-Users of Rare Gases
4.3 Rare Gases Market in the Asia-Pacific Region
4.4 China is Projected to Exhibit the Highest CAGR From 2015 to 2020
4.5 Asia-Pacific Occupied the Largest Market Share Among All Regions in 2014
4.6 Emerging Markets are Estimated to Grow at A Faster Rate Than Developed Markets
4.7 Cylinders and Liquid Containers Held the Largest Share in 2014 Among All Transportation Modes of Rare Gases
4.8 Rare Gases Market Life Cycle Analysis, By Region
5 Market Overview (Page No. - 50)
5.1 Introduction
5.2 Evolution of Rare Gases
5.3 Rare Gases Market Segmentation
5.4 Market Dynamics
5.4.1 Drivers
5.4.1.1 Growing Demand for Energy-Efficient Lighting and Laser Solutions
5.4.1.2 Energy-Efficient Building Codes and Requirement for Insulated Windows
5.4.1.3 Increasing Health Consciousness Coupled With Rising Spending Capacity
5.4.1.4 Government Mandate Rules and Regulations
5.4.2 Restraints
5.4.2.1 Inception of Alternative Technologies in Several Industries
5.4.3 Opportunities
5.4.3.1 Proliferation of New Technologies
5.4.3.2 High Demand in Automotive Industry
5.4.3.3 Expected High Demand Growth in Asia�s Health Care Industry
5.4.4 Challenges
5.4.4.1 Intricate Manufacturing Process
6 Industry Trends (Page No. - 61)
6.1 Introduction
6.2 Value Chain
6.3 Porter�s Five Forces Analysis
6.3.1 Threat of New Entrants
6.3.2 Threats of Substitutes
6.3.3 Bargaining Power of Suppliers
6.3.4 Bargaining Power of Buyers
6.3.5 Intensity of Competitive Rivalry
7 Rare Gases Market, By Type (Page No. - 67)
7.1 Introduction
7.1.1 Rare Gases Market, By Type
7.1.1.1 Neon Gas Dominated the Global Rare Gases Market in 2014
7.2 Neon
7.2.1 Pure
7.2.2 Mixture
7.2.2.1 Neon Market, By End Use
7.2.2.1.1 Electronics Held the Largest Share in the Neon Gas Market, By End Use, in 2014
7.2.2.2 Neon Market, By Transportation Mode
7.2.2.2.1 Cylinders and Liquid Containers Dominated the Neon Market in 2014
7.2.2.3 Neon Market, By Function
7.2.2.3.1 Illumination Held the Largest Share in the Neon Market in 2014
7.3 Krypton
7.3.1 Pure
7.3.2 Mixture
7.3.2.1 Krypton Market, By End Use
7.3.2.1.1 Electronics Projected to Have the Highest CAGR in the Krypton Market By 2020
7.3.2.2 Krypton Market, By Transportation Mode
7.3.2.2.1 Bulk and Micro Bulk Delivery Dominated the Krypton Market in 2014
7.3.2.3 Krypton Market, By Function
7.3.2.3.1 Insulation Projected to Be the Fastest-Growing Market for Krypton By 2020
7.4 Xenon
7.4.1 Pure
7.4.2 Mixture
7.4.2.1 Xenon Market, By End Use
7.4.2.1.1 Automotive and Transportation Equipment Projected to Have the Second-Highest CAGR in the Xenon Market By 2020
7.4.2.2 Xenon Market, By Transportation Mode
7.4.2.2.1 Cylinders and Liquid Containers Dominated the Xenon Market in 2014
7.4.2.3 Xenon Market, By Function
7.4.2.3.1 Insulation Projected to Be the Fastest-Growing Function in the Xenon Market By 2020
8 Rare Gases Market, By End Use (Page No. - 83)
8.1 Introduction
8.1.1 Rare Gases Market, By End Use
8.1.1.1 Electronics Dominated the Global Rare Gases Market in 2014
8.2 Manufacturing and Construction
8.2.1 Manufacturing and Construction Market, By Transportation Mode
8.2.1.1 Cylinders and Liquid Containers Held the Largest Share in the Manufacturing and Construction Market, By Transportation Mode, in 2014
8.2.2 Manufacturing and Construction Market, By Function
8.2.2.1 Insulation Dominated the Manufacturing and Construction Market in 2014
8.3 Electronics
8.3.1 Electronics Market, By Transportation Mode
8.3.1.1 Cylinders and Liquid Containers Projected to Have the Highest CAGR in the Electronics Market By 2020
8.3.2 Electronics Market, By Function
8.3.2.1 Illumination Held the Largest Market Share in the Electronics Market in 2014
8.4 Automotive and Transportation Equipment
8.4.1 Automotive and Transportation Equipment Market, By Transportation Mode
8.4.1.1 Cylinders and Liquid Containers Dominated the Automotive and Transportation Equipment Market in 2014
8.4.2 Automotive and Transportation Equipment Market, By Function
8.4.2.1 Illumination Held the Largest Market Share in the Automotive and Transportation Equipment Market in 2014
8.5 Health Care
8.5.1 Health Care Market, By Transportation Mode
8.5.1.1 Cylinders and Liquid Containers Dominated the Health Care Market in 2014
8.5.2 Health Care Market, By Function
8.5.2.1 Illumination Projected to Be the Fastest-Growing Function in the Health Care Market By 2020
9 Rare Gases Market, By Transportation Mode (Page No. - 94)
9.1 Introduction
9.1.1 Rare Gases Market, By Transportation Mode
9.1.1.1 Illumination Dominated the Global Rare Gases Market in 2014
9.2 Cylinders & Liquid Containers
9.3 Tonnage Distribution
9.4 Bulk and Micro Bulk Delivery
10 Rare Gases Market, By Function (Page No. - 98)
10.1 Introduction
10.1.1 Rare Gases Market, By Function
10.1.1.1 Illumination Dominated the Global Rare Gases Market in 2014
10.2 Illumination
10.3 Insulation
10.4 Others
11 Rare Gases Market, By Region (Page No. - 102)
11.1 Introduction
11.1.1 Rare Gases Market Size, By Region
11.1.1.1 Asia-Pacific Dominated the Global Rare Gases Market in 2014
11.2 Asia-Pacific
11.2.1 Asia-Pacific: Rare Gases Market Size, By Country
11.2.1.1 China Dominated the Asia-Pacific Rare Gases Market in 2014
11.2.2 Asia-Pacific: Rare Gases Market Size, By Type
11.2.2.1 Neon Accounted for the Largest Market Share in 2014
11.2.3 Asia-Pacific: Rare Gases Market Size, By End-Use
11.2.3.1 Electronics is Projected to Grow at the Highest CAGR
11.2.4 Asia-Pacific: Rare Gases Market Size, By Transportation Mode
11.2.4.1 Bulk and Micro Bulk Delivery to Grow at the Second-Highest Rate
11.2.5 Asia-Pacific: Rare Gases Market Size, By Function
11.2.5.1 Insulation Was the Second-Largest Market in 2014
11.2.6 China
11.2.6.1 China: Rare Gases Market Size, By Type
11.2.6.1.1 Growth in Construction and Automobile Industries is Driving the Neon Market in China
11.2.6.2 China: Rare Gases Market Size, By End-Use
11.2.6.2.1 Electronics Dominated the Chinese Rare Gases Market
11.2.6.3 China: Rare Gases Market Size, By Transportation Mode
11.2.6.3.1 Cylinders and Liquid Containers Projected to Grow at the Highest Rate
11.2.7 Japan
11.2.7.1 Japan: Rare Gases Market Size, By Type
11.2.7.1.1 Xenon is Projected to Grow at the Highest CAGR
11.2.7.2 Japan: Rare Gases Market Size, By End-Use
11.2.7.2.1 Manufacturing and Construction to Grow at the Second-Highest Rate
11.2.7.3 Japan: Rare Gases Market Size, By Transportation Mode
11.2.7.3.1 Tonnage Distribution is Projected to Grow at the Second-Highest Rate
11.2.8 India
11.2.8.1 India: Rare Gases Market Size, By Type
11.2.8.1.1 Neon Was the Most Widely Used Rare Gas in 2014 in India
11.2.8.2 India: Rare Gases Market Size, By End-Use
11.2.8.2.1 Demand for Rare Gases Was the Highest in the Electronics Sector
11.2.8.3 India: Rare Gases Market Size, By Transportation Mode
11.2.8.3.1 Bulk and Micro Bulk Delivery to Grow at the Second-Highest Rate
11.2.9 Australia
11.2.9.1 Australia: Rare Gases Market Size, By Type
11.2.9.1.1 Neon is Projected to Grow at the Second-Highest CAGR
11.2.9.2 Australia: Rare Gases Market Size, By End-Use
11.2.9.2.1 Electronics Accounted for the Largest Market Share in 2014
11.2.9.3 Australia: Rare Gases Market Size, By Transportation Mode
11.2.9.3.1 Transportation Through Cylinders and Liquid Containers Was the Highest in 2014
11.2.10 Rest of Asia-Pacific
11.2.10.1 Rest of Asia-Pacific: Rare Gases Market Size, By Type
11.2.10.1.1 Xenon to Grow at the Highest Rate in the Rest of Asia-Pacific Region
11.2.10.2 Rest of Asia-Pacific: Rare Gases Market Size, By End-Use
11.2.10.2.1 Manufacturing and Construction Was the Second-Largest Market in 2014
11.2.10.3 Rest of Asia-Pacific: Rare Gases Market Size, By Transportation Mode
11.2.10.3.1 Transportation Mode Was Dominated By Cylinders and Liquid Containers in 2014
11.3 Europe
11.3.1 Europe: Rare Gases Market Size, By Country
11.3.1.1 France Accounted for the Largest Share in the European Rare Gases Market in 2014
11.3.1.2 Europe: Rare Gases Market Size, By Type
11.3.1.2.1 Xenon is Projected to Grow at the Highest CAGR
11.3.1.3 Europe: Rare Gases Market Size, By End-Use
11.3.1.3.1 Growing Demand for Energy Efficient Lighting and Electronics is Projected to Drive the Rare Gases Market
11.3.1.4 Europe: Rare Gases Market Size, By Transportation Mode
11.3.1.4.1 Cylinders and Liquid Containers Occupied the Largest Share in 2014
11.3.1.5 Europe: Rare Gases Market Size, By Function
11.3.1.5.1 Illumination Dominated the European Rare Gases Market in 2014
11.3.2 France
11.3.2.1 France: Rare Gases Market Size, By Type
11.3.2.1.1 Neon to Grow at the Second-Highest Rate
11.3.2.2 France: Rare Gases Market Size, By Process
11.3.2.2.1 Manufacturing and Construction is Projected to Grow at the Second-Highest Rate
11.3.2.3 France: Rare Gases Market Size, By Transportation Mode
11.3.2.3.1 Demands From Industries Such as Lighting and Automotive Have Driven the Market in France
11.3.3 Germany
11.3.3.1 Germany: Rare Gases Market Size, By Type
11.3.3.1.1 Neon Accounted for the Largest Market Share in 2014
11.3.3.2 Germany: Rare Gases Market Size, By End-Use
11.3.3.2.1 Electronics Accounted for the Largest Market Share in 2014
11.3.3.3 Germany: Rare Gases Market Size, By Transportation Mode
11.3.3.3.1 Bulk and Micro Bulk Delivery Was the Second-Largest Market in 2014 in Germany
11.3.4 U.K.
11.3.4.1 U.K.: Rare Gases Market Size, By Type
11.3.4.1.1 Xenon to Grow at the Highest Rate in the U.K.
11.3.4.2 U.K.: Rare Gases Market Size, By End-Use
11.3.4.2.1 Electronics Dominated the Market in 2014
11.3.4.3 U.K.: Rare Gases Market Size, By Transportation Mode
11.3.4.3.1 Cylinders and Liquid Containers Dominated the U.K. Market for Rare Gases
11.3.5 Russia
11.3.5.1 Russia: Rare Gases Market Size, By Type
11.3.5.1.1 Rising Demand From the Manufacturing and Construction Sectors is Driving the Demand for Rare Gases in Russia
11.3.5.2 Russia: Rare Gases Market Size, By End-Use
11.3.5.2.1 Manufacturing and Construction Was the Second-Largest Market in Russia in 2014
11.3.5.3 Russia: Rare Gases Market Size, By Transportation Mode
11.3.5.3.1 Cylinders and Liquid Containers Accounted for the Largest Share in the Russian Rare Gases Market
11.3.6 Rest of Europe
11.3.6.1 Rest of Europe: Rare Gases Market Size, By Type
11.3.6.1.1 Xenon is Projected to Grow at the Highest CAGR
11.3.6.2 Rest of Europe: Rare Gases Market Size, By End-Use
11.3.6.2.1 Manufacturing and Construction to Grow at the Second-Highest Rate
11.3.6.3 Rest of Europe: Rare Gases Market Size, By Transportation Mode
11.3.6.3.1 Cylinders and Liquid Containers Accounted for the Largest Share in 2014 and is Projected to Grow at the Highest CAGR
11.4 North America
11.4.1 North America: Rare Gases Market Size, By Country
11.4.1.1 U.S. is Projected to Be the Fastest-Growing Market
11.4.1.2 North America: Rare Gases Market Size, By Type
11.4.1.2.1 North American Rare Gases Market is Driven By Rapid Growth in Semiconductor and Automotive Industries
11.4.1.3 North America: Rare Gases Market Size, By End-Use
11.4.1.3.1 Electronics is Projected to Grow at the Highest Rate
11.4.1.4 North America: Rare Gases Market Size, By Transportation Mode
11.4.1.4.1 Cylinders and Liquid Containers Accounted for the Largest Share in 2014
11.4.1.5 North America: Rare Gases Market Size, By Function
11.4.1.5.1 Insulation Accounted for the Largest Share in 2014
11.4.2 U.S.
11.4.2.1 U.S.: Rare Gases Market Size, By Type
11.4.2.1.1 Xenon is Projected to Grow at the Highest Rate
11.4.2.2 U.S.: Rare Gases Market Size, By End-Use
11.4.2.2.1 Manufacturing and Construction Occupied the Second-Largest Share in 2014
11.4.2.3 U.S.: Rare Gases Market Size, By Transportation Mode
11.4.2.3.1 Cylinders and Liquid Containers Dominated the Market in 2014
11.4.3 Canada
11.4.3.1 Canada: Rare Gases Market Size, By Type
11.4.3.1.1 Neon Dominated the Market in 2014
11.4.3.2 Canada: Rare Gases Market Size, By End-Use
11.4.3.2.1 Electronics to Grow at the Highest CAGR in the Canadian Rare Gases Market
11.4.3.3 Canada: Rare Gases Market Size, By Transportation Mode
11.4.3.3.1 Bulk and Micro Bulk Delivery Accounted for the Second-Largest Share in 2014
11.4.4 Mexico
11.4.4.1 Mexico: Rare Gases Market Size, By Type
11.4.4.1.1 Mexican Rare Gases Market, By Type, Was Dominated By Neon in 2014
11.4.4.2 Mexico: Rare Gases Market Size, By End-Use
11.4.4.2.1 Electronics Dominated the Market in 2014
11.4.4.3 Mexico: Rare Gases Market Size, By Transportation Mode
11.4.4.3.1 Cylinders and Liquid Containers Accounted for the Largest Share in Mexico in 2014
11.5 Rest of the World (RoW)
11.5.1 RoW: Rare Gases Market Size, By Country
11.5.1.1 Brazil Dominated the RoW Rare Gases Market in 2014
11.5.1.2 RoW: Rare Gases Market Size, By Type
11.5.1.2.1 Krypton Accounted for the Second-Largest Share in the RoW Rare Gases Market in 2014
11.5.1.3 RoW: Rare Gases Market Size, By End-Use
11.5.1.3.1 Electronics Sector is Projected to Grow at the Highest Rate
11.5.1.4 RoW: Rare Gases Market Size, By Transportation Mode
11.5.1.4.1 Cylinders and Liquid Containers is the Most Popular Transportation Mode
11.5.1.5 RoW: Rare Gases Market Size, By Function
11.5.1.5.1 Insulation is Projected to Grow at the Highest Rate
11.5.2 Brazil
11.5.2.1 Brazil: Rare Gases Market Size, By Type
11.5.2.1.1 Rare Gases Market in Brazil Was Dominated By Neon in 2014
11.5.2.2 Brazil: Rare Gases Market Size, By End-Use
11.5.2.2.1 Electronics is Projected to Grow at the Highest CAGR
11.5.2.3 Brazil: Rare Gases Market Size, By Transportation Mode
11.5.2.3.1 Cylinders and Liquid Containers Dominated the Brazilian Market for Rare Gases
11.5.3 South Africa
11.5.3.1 South Africa: Rare Gases Market Size, By Type
11.5.3.1.1 Neon is Estimated to Have the Highest Demand for Rare Gases in South Africa
11.5.3.2 South Africa: Rare Gases Market Size, By End-Use
11.5.3.2.1 Electronics Led the South African Rare Gases Market in 2014
11.5.3.3 South Africa: Rare Gases Market Size, By Transportation Mode
11.5.3.3.1 Cylinder and Liquid Container Transportation Mode is Estimated to Have Potential Growth Opportunities
11.5.4 Others in RoW
11.5.4.1 Others in RoW: Rare Gases Market Size, By Type
11.5.4.1.1 Xenon Projected to Be the Fastest-Growing Market for Rare Gases
11.5.4.2 Others in RoW: Rare Gases Market Size, By Process
11.5.4.2.1 Electronics Accounted for the Largest Market Share in 2014
11.5.4.3 Others in RoW: Rare Gases Market Size, By Transportation Mode
11.5.4.3.1 Bulk and Micro Bulk Delivery is Projected to Grow at the Second-Highest CAGR
12 Competitive Landscape (Page No. - 179)
12.1 Overview
12.2 Competitive Situations & Trends
12.3 Key Growth Strategies, 2011�2015
12.3.1 Mergers & Acquisitions
12.3.2 Expansions & Investements
12.3.3 Agreements, Collaborations & Joint Ventures
12.3.4 New Product Launches
13 Company Profiles (Page No. - 187)
(Company at A Glance, Recent Financials, Products & Services, Strategies & Insights, & Recent Developments)*
13.1 Introduction
13.2 Praxair Inc.
13.3 Airgas Inc.
13.4 The Linde Group
13.5 Air Liquide S.A.
13.6 Air Products and Chemicals Inc.
13.7 Iwatani Corporation
13.8 Messer Group GmbH
13.9 Matheson Tri-Gas Inc.
13.10 Iceblick Ltd.
13.11 Advanced Specialty Gases Inc.
*Details on Company at A Glance, Recent Financials, Products & Services, Strategies & Insights, & Recent Developments Might Not Be Captured in Case of Unlisted Companies.
14 Appendix (Page No. - 211)
14.1 Insights of Industry Experts
14.2 Discussion Guide
14.3 Company Developments
14.3.1 Mergers & Acquisitions
14.3.2 Expansions & Investments
14.3.3 Agreements, Collaboration & Joint Ventures
14.4 Introducing RT: Real-Time Market Intelligence
14.5 Available Customizations
14.6 Related Repoerts
List of Tables (191 Tables)
Table 1 Industry Regulations
Table 2 Growing Demand for Energy-Efficient Technologies is the Major Driver of the Rare Gases Market
Table 3 Inception of Alternative Technology May Restrain Market Growth
Table 4 Factors Leading to Rise in Demand for Rare Gases
Table 5 Rare Gases Market Size, By Type, 2013�2020 (USD Million)
Table 6 Rare Gases Market Size, By Type, 2013�2020 (ML)
Table 7 Neon Market Size, By End Use, 2013�2020 (USD Million)
Table 8 Neon Market Size, By End Use, 2013�2020 (ML)
Table 9 Neon Market Size, By Transportation Mode, 2013�2020 (USD Million)
Table 10 Neon Market Size, By Transportation Mode, 2013�2020 (ML)
Table 11 Neon Market Size, By Function, 2013�2020 (USD Million)
Table 12 Neon Market Size, By Function, 2013�2020 (ML)
Table 13 Krypton Market Size, By End Use, 2013�2020 (USD Million)
Table 14 Krypton Market Size, By End Use, 2013�2020 (ML)
Table 15 Krypton Market Size, By Transportation Mode, 2013�2020 (USD Million)
Table 16 Krypton Market Size, By Transportation Mode, 2013�2020 (ML)
Table 17 Krypton Market Size, By Function, 2013�2020 (USD Million)
Table 18 Krypton Market Size, By Function, 2013�2020 (ML)
Table 19 Xenon Market Size, By Type, 2013�2020 (USD Million)
Table 20 Xenon Market Size, By End Use, 2013�2020 (ML)
Table 21 Xenon Market Size, By Transportation Mode, 2013�2020 (USD Million)
Table 22 Xenon Market Size, By Transportation Mode, 2013�2020 (ML)
Table 23 Xenon Market Size, By Function, 2013�2020 (USD Million)
Table 24 Xenon Market Size, By Function, 2013�2020 (ML)
Table 25 Rare Gases Market Size, By End Use, 2013�2020 (USD Million)
Table 26 Rare Gases Market Size, By End Use, 2013�2020 (ML)
Table 27 Manufacturing and Construction Market Size, By Transportation Mode, 2013�2020 (USD Million)
Table 28 Manufacturing and Construction Market Size, By Transportation Mode, 2013�2020 (ML)
Table 29 Manufacturing and Construction Market Size, By Function, 2013�2020 (USD Million)
Table 30 Manufacturing and Construction Market Size, By Function, 2013�2020 (ML)
Table 31 Electronics Market Size, By Transportation Mode, 2013�2020 (USD Million)
Table 32 Electronics Market Size, By Transportation Mode, 2013�2020 (ML)
Table 33 Electronics Market Size, By Function, 2013�2020 (USD Million)
Table 34 Electronics Market Size, By Function, 2013�2020 (ML)
Table 35 Automotive and Transportation Equipment Market Size, By Transportation Mode, 2013�2020 (USD Million)
Table 36 Automotive and Transportation Equipment Market Size, By Transportation Mode, 2013�2020 (ML)
Table 37 Automotive and Transportation Equipment Market Size, By Function, 2013�2020 (USD Million)
Table 38 Automotive and Transportation Equipment Market Size, By Function, 2013�2020 (ML)
Table 39 Health Care Market Size, By Transportation Mode, 2013�2020 (USD Million)
Table 40 Health Care Market Size, By Transportation Mode, 2013�2020 (ML)
Table 41 Health Care Market Size, By Function, 2013�2020 (USD Million)
Table 42 Health Care Market Size, By Function, 2013�2020 (ML)
Table 43 Rare Gases Market Size, By Transportation Mode, 2013�2020 (USD Million)
Table 44 Rare Gases Market Size, By Transportation Mode, 2013�2020 (ML)
Table 45 Rare Gases Market Size, By Function, 2013�2020 (USD Million)
Table 46 Rare Gases Market Size, By Function, 2013�2020 (ML)
Table 47 Rare Gases Market Size, By Region, 2013�2020 (USD Million)
Table 48 Rare Gases Market Size, By Region, 2013�2020 (ML)
Table 49 Asia-Pacific: Rare Gases Market Size, By Country, 2013�2020 (USD Million)
Table 50 Asia-Pacific: Rare Gases Market Size, By Country, 2013�2020 (ML)
Table 51 Asia-Pacific: Rare Gases Market Size, By Type, 2013�2020 (USD Million)
Table 52 Asia-Pacific: Rare Gases Market Size, By Type, 2013�2020 (ML)
Table 53 Asia-Pacific: Rare Gases Market Size, By End-Use, 2013�2020 (USD Million)
Table 54 Asia-Pacific: Rare Gases Market Size, By End-Use, 2013�2020 (ML)
Table 55 Asia-Pacific: Rare Gases Market Size, By Transportation Mode, 2013�2020 (USD Million)
Table 56 Asia-Pacific: Rare Gases Market Size, By Transportation Mode, 2013�2020 (ML)
Table 57 Asia-Pacific: Rare Gases Market Size, By Function, 2013�2020 (USD Million)
Table 58 Asia-Pacific: Rare Gases Market Size, By Function, 2013�2020 (ML)
Table 59 China: Rare Gases Market Size, By Type, 2013�2020 (USD Million)
Table 60 China: Rare Gases Market Size, By Type, 2013�2020 (ML)
Table 61 China: Rare Gases Market Size, By End-Use, 2013�2020 (USD Million)
Table 62 China: Rare Gases Market Size, By End-Use, 2013�2020 (ML)
Table 63 China: Rare Gases Market Size, By Transportation Mode, 2013�2020 (USD Million)
Table 64 China: Rare Gases Market Size, By Transportation Mode, 2013�2020 (ML)
Table 65 Japan: Rare Gases Market Size, By Type, 2013�2020 (USD Million)
Table 66 Japan: Market Size, By Type, 2013�2020 (ML)
Table 67 Japan: Market Size, By End-Use, 2013�2020 (USD Million)
Table 68 Japan: Market Size, By End-Use, 2013�2020 (ML)
Table 69 Japan: Market Size, By Transportation Mode, 2013�2020 (USD Million)
Table 70 Japan: Market Size, By Transportation Mode, 2013�2020 (ML)
Table 71 India: Rare Gases Market Size, By Type, 2013�2020 (USD Million)
Table 72 India: Market Size, By Type, 2013�2020 (ML)
Table 73 India: Market Size, By End-Use, 2013�2020 (USD Million)
Table 74 India: Market Size, By End-Use, 2013�2020 (ML)
Table 75 India: Market Size, By Transportation Mode, 2013�2020 (USD Million)
Table 76 India: Market Size, By Transportation Mode, 2013�2020 (ML)
Table 77 Australia: Rare Gases Market Size, By Type, 2013�2020 (USD Million)
Table 78 Australia: Market Size, By Type, 2013�2020 (ML)
Table 79 Australia: Market Size, By End-Use, 2013�2020 (USD Million)
Table 80 Australia: Market Size, By End-Use, 2013�2020 (ML)
Table 81 Australia: Market Size, By Transportation Mode, 2013�2020 (USD Million)
Table 82 Australia: Market Size, By Transportation Mode, 2013�2020 (ML)
Table 83 Rest of Asia-Pacific: Rare Gases Market Size, By Type, 2013�2020 (USD Million)
Table 84 Rest of Asia-Pacific: Market Size, By Type, 2013�2020 (ML)
Table 85 Rest of Asia-Pacific: Market Size, By End-Use, 2013�2020 (USD Million)
Table 86 Rest of Asia-Pacific: Market Size, By End-Use, 2013�2020 (ML)
Table 87 Rest of Asia-Pacific: Market Size, By Transportation Mode, 2013�2020 (USD Million)
Table 88 Rest of Asia-Pacific: Market Size, By Transportation Mode, 2013�2020 (ML)
Table 89 Europe: Rare Gases Market Size, By Country, 2013�2020 (USD Million)
Table 90 Europe: Rare Gases Market Size, By Country, 2013�2020 (ML)
Table 91 Europe: Rare Gases Market Size, By Type, 2013�2020 (USD Million)
Table 92 Europe: Rare Gases Market Size, By Type, 2013�2020 (ML)
Table 93 Europe: Rare Gases Market Size, By End-Use, 2013�2020 (USD Million)
Table 94 Europe: Rare Gases Market Size, By End-Use, 2013�2020 (ML)
Table 95 Europe: Rare Gases Market Size, By Transportation Mode, 2013�2020 (USD Million)
Table 96 Europe: Rare Gases Market Size, By Transportation Mode, 2013�2020 (ML)
Table 97 Europe: Rare Gases Market Size, By Function, 2013�2020 (USD Million)
Table 98 Europe: Rare Gases Market Size, By Function, 2013�2020 (ML)
Table 99 France: Rare Gases Market Size, By Type, 2013�2020 (USD Million)
Table 100 France: Rare Gases Market Size, By Type, 2013�2020 (ML)
Table 101 France: Rare Gases Market Size, By End-Use, 2013�2020 (USD Million)
Table 102 France: Rare Gases Market Size, By End-Use, 2013�2020 (ML)
Table 103 France: Rare Gases Market Size, By Transportation Mode, 2013�2020 (USD Million)
Table 104 France: Rare Gases Market Size, By Transportation Mode, 2013�2020 (ML)
Table 105 Germany: Rare Gases Market Size, By Type, 2013�2020 (USD Million)
Table 106 Germany: By Market Size, By Type, 2013�2020 (ML)
Table 107 Germany: By Market Size, By End-Use, 2013�2020 (USD Million)
Table 108 Germany: By Market Size, By End-Use, 2013�2020 (ML)
Table 109 Germany: By Market Size, By Transportation Mode, 2013�2020 (USD Million)
Table 110 Germany: By Market Size, By Transportation Mode, 2013�2020 (ML)
Table 111 U.K.: Rare Gases Market Size, By Type, 2013�2020 (USD Million)
Table 112 U.K.: Market Size, By Type, 2013�2020 (ML)
Table 113 U.K.: Market Size, By End-Use, 2013�2020 (USD Million)
Table 114 U.K.: Market Size, By End-Use, 2013�2020 (ML)
Table 115 U.K.: Market Size, By Transportation Mode, 2013�2020 (USD Million)
Table 116 U.K.: Market Size, By Transportation Mode, 2013�2020 (ML)
Table 117 Russia: Rare Gases Market Size, By Type, 2013�2020 (USD Million)
Table 118 Russia: Market Size, By Type, 2013�2020 (ML)
Table 119 Russia: Market Size, By End-Use, 2013�2020 (USD Million)
Table 120 Russia: Market Size, By End-Use, 2013�2020 (ML)
Table 121 Russia: Market Size, By Transportation Mode, 2013�2020 (USD Million)
Table 122 Russia: Market Size, By Transportation Mode, 2013�2020 (ML)
Table 123 Rest of Europe: Rare Gases Market Size, By Type, 2013�2020 (USD Million)
Table 124 Rest of Europe: Market Size, By Type, 2013�2020 (ML)
Table 125 Rest of Europe: Market Size, By End-Use, 2013�2020 (USD Million)
Table 126 Rest of Europe: Market Size, By End-Use, 2013�2020 (ML)
Table 127 Rest of Europe: Market Size, By Transportation Mode, 2013�2020 (USD Million)
Table 128 Rest of Europe: Market Size, By Transportation Mode, 2013�2020 (ML)
Table 129 North America: Rare Gases Market Size, By Country, 2013�2020 (USD Million)
Table 130 North America: Market Size, By Country, 2013�2020 (ML)
Table 131 North America: Market Size, By Type, 2013�2020 (USD Million)
Table 132 North America: Market Size, By Type, 2013�2020 (ML)
Table 133 North America: Market Size, By End-Use, 2013�2020 (USD Million)
Table 134 North America: Market Size, By End-Use, 2013�2020 (ML)
Table 135 North America: Market Size, By Transportation Mode, 2013�2020 (USD Million)
Table 136 North America: Market Size, By Transportation Mode, 2013�2020 (ML)
Table 137 North America: Market Size, By Function, 2013�2020 (USD Million)
Table 138 North America: Market Size, By Function, 2013�2020 (ML)
Table 139 U.S.: Rare Gases Market Size, By Type, 2013�2020 (USD Million)
Table 140 U.S.: Market Size, By Type, 2013�2020 (ML)
Table 141 U.S.: Market Size, By End-Use, 2013�2020 (USD Million)
Table 142 U.S.: Market Size, By End-Use, 2013�2020 (ML)
Table 143 U.S.: Market Size, By Transportation Mode, 2013�2020 (USD Million)
Table 144 U.S.: Market Size, By Transportation Mode, 2013�2020 (ML)
Table 145 Canada: Rare Gases Market Size, By Type, 2013�2020 (USD Million)
Table 146 Canada: Market Size, By Type, 2013�2020 (ML)
Table 147 Canada: Market Size, By End-Use, 2013�2020 (USD Million)
Table 148 Canada: Market Size, By End-Use, 2013�2020 (ML)
Table 149 Canada: Market Size, By Transportation Mode, 2013�2020 (USD Million)
Table 150 Canada: Market Size, By Transportation Mode, 2013�2020 (ML)
Table 151 Mexico: Rare Gases Market Size, By Type, 2013�2020 (USD Million)
Table 152 Mexico: Market Size, By Type, 2013�2020 (ML)
Table 153 Mexico: Market Size, By End-Use, 2013�2020 (USD Million)
Table 154 Mexico: Market Size, By End-Use, 2013�2020 (ML)
Table 155 Mexico: Market Size, By Transportation Mode, 2013�2020 (USD Million)
Table 156 Mexico: Market Size, By Transportation Mode, 2013�2020 (ML)
Table 157 RoW: Rare Gases Market Size, By Country, 2013�2020 (USD Million)
Table 158 RoW: Market Size, By Country, 2013�2020 (ML)
Table 159 RoW: Market Size, By Type, 2013�2020 (USD Million)
Table 160 RoW: Market Size, By Type, 2013�2020 (ML)
Table 161 RoW: Market Size, By End-Use, 2013�2020 (USD Million)
Table 162 RoW: Market Size, By End-Use, 2013�2020 (ML)
Table 163 RoW: Market Size, By Transportation Mode, 2013�2020 (USD Million)
Table 164 RoW: Market Size, By Transportation Mode, 2013�2020 (ML)
Table 165 RoW: Market Size, By Function, 2013�2020 (USD Million)
Table 166 RoW: Market Size, By Function, 2013�2020 (ML)
Table 167 Brazil: Rare Gases Market Size, By Type, 2013�2020 (USD Million)
Table 168 Brazil: By Market Size, By Material, 2013�2020 (ML)
Table 169 Brazil: By Market Size, By End-Use, 2013�2020 (USD Million)
Table 170 Brazil: By Market Size, By End-Use, 2013�2020 (ML)
Table 171 Brazil: By Market Size, By Transportation Mode, 2013�2020 (USD Million)
Table 172 Brazil: By Market Size, By Transportation Mode, 2013�2020 (ML)
Table 173 South Africa: Rare Gases Market Size, By Type, 2013�2020 (USD Million)
Table 174 South Africa: Market Size, By Type, 2013�2020 (ML)
Table 175 South Africa: Market Size, By End-Use, 2013�2020 (USD Million)
Table 176 South Africa: Market Size, By End-Use, 2013�2020 (ML)
Table 177 South Africa: Market Size, By Transportation Mode, 2013�2020 (USD Million)
Table 178 South Africa: Market Size, By Transportation Mode, 2013�2020 (ML)
Table 179 Others in RoW: Rare Gases Market Size, By Type, 2013�2020 (USD Million)
Table 180 Others in RoW: Market Size, By Type, 2013�2020 (ML)
Table 181 Others in RoW: Market Size, By End-Use, 2013�2020 (USD Million)
Table 182 Others in RoW: Market Size, By End-Use, 2013�2020 (ML)
Table 183 Others in RoW: Market Size, By Transportation Mode, 2013�2020 (USD Million)
Table 184 Others in RoW: Market Size, By Transportation Mode, 2013�2020 (ML)
Table 185 Mergers & Acquisitions, 2015
Table 186 Expansions & Investments, 2014�2015
Table 187 Partnerships, Agreements & Joint Ventures, 2015
Table 188 New Product Launches, 2012�2013
Table 189 Mergers & Acquisitions, 2011�2015
Table 190 Expansions & Investments, 2011�2014
Table 191 Partnerships, Agreements & Joint Ventures, 2012
List of Figures (60 Figures)
Figure 1 Rare Gases Market Segmentation
Figure 2 Rare Gases Market: Research Design
Figure 3 Population Growth has Increased By 3 Billion in Three Decades
Figure 4 Increase in the Total Expenditure of Middle-Class Families
Figure 5 Growth in Manufacturing & Service Sectors
Figure 6 Crude Oil Spot Prices, 2004-2014
Figure 7 Natural Gas Prices, 2004-2014
Figure 8 Market Size Estimation Methodology: Top-Down Approach
Figure 9 Data Triangulation Methodology
Figure 10 Rare Gases Market Size, By Type, 2015 vs 2020 (USD Billion)
Figure 11 Rare Gases Market Size, By Region, 2015 vs 2020 (USD Billion)
Figure 12 China is Projected to Be the Fastest-Growing Market for Rare Gases From 2015 to 2020
Figure 13 Leading Market Players Adopted Mergers & Acquisitions as the Key Strategy From 2011 to 2015
Figure 14 Emerging Economies Offer Attractive Opportunities in the Rare Gases Market
Figure 15 Manufacturing and Construction Segment Occupies the Largest Share Among All End Users of Rare Gases
Figure 16 Illumination Function Captured the Largest Share in the Emerging Asia-Pacific Market in 2014
Figure 17 China Projected to Be the Fastest-Growing Country for Rare Gases, 2015-2020
Figure 18 Asia-Pacific Region Dominated the Rare Gases Market in 2014
Figure 19 Emerging Markets to Grow Faster Than Developed Markets (2015-2020)
Figure 20 Cylinders and Liquid Containers Held the Largest Share
Figure 21 Rare Gases Market in Asia-Pacific Region is Experiencing High Growth
Figure 22 Rare Gases are Majorly Used in Lighting Applications
Figure 23 Rare Gases Were Discovered By William Ramsay in 1898
Figure 24 Rare Gases Market Segmentation
Figure 25 Growing Demand for Energy-Efficient Technologies is the Major Driver of the Rare Gases Market
Figure 26 Semiconductors Market Analysis
Figure 27 Flat Panel Display Market Forecast
Figure 28 Growth in Automotive Industry Worldwide
Figure 29 Rare Gases Value Chain
Figure 30 Porter�s Five Forces Analysis
Figure 31 Neon Held the Largest Market Share Worldwide in 2014
Figure 32 Neon Was Discovered By William Ramsay in 1898
Figure 33 Krypton Difluoride Was Formed in the Year 1963
Figure 34 Xenon Was First Used as an Anesthetic By Stuart Cullen in the Year 1951
Figure 35 Electronics Projected to Grow at the Highest Rate in the Global Rare Gases Market By 2020
Figure 36 Cylinders and Liquid Containers are Projected to Grow at the Highest CAGR in the Global Rare Gases Market By 2020
Figure 37 Illumination Function to Dominate the Market By 2020
Figure 38 Geographical Snapshot: Rare Gases Market Growth Rate (2015-2020)
Figure 39 China is Expected to Grow at the Highest CAGR By 2020
Figure 40 Asia-Pacific: Market Snapshot
Figure 41 Europe: Market Snapshot
Figure 42 North America: Market Snapshot
Figure 43 RoW: Market Snapshot
Figure 44 Companies Adopted Acquisitions as Their Key Growth Strategy Over the Last Five Years (2011�2015)
Figure 45 Growth Comparison of Key Players in the Rare Gas Market, 2012�2014
Figure 46 2015: the Most Active Year in the Rare Gas Market in Terms of Developments
Figure 47 New Product Development: the Key Strategy, 2011�2015
Figure 48 Geographic Revenue Mix of Top 5 Players
Figure 49 Praxair Inc.:Company Snapshot
Figure 50 SWOT Analysis: Praxair Inc.
Figure 51 Airgas Inc.: Company Snapshot
Figure 52 SWOT Analysis: Airgas Inc.
Figure 53 The Linde Group: Company Snapshot
Figure 54 WOT Analysis: the Linde Group
Figure 55 Air Liquide S.A.: Company Snapshot
Figure 56 SWOT Analysis: Air Liquide S.A.
Figure 57 Air Products and Chemicals Inc.: Company Snapshot
Figure 58 SWOT Analysis: Air Products and Chemicals Inc.
Figure 59 Iwatani Corporation: Company Snapshot
Figure 60 Messer Group GmbH: Company Snapshot


Growth opportunities and latent adjacency in Rare Gases Market