Propionic Acid Market & Derivatives by Applications (Animal Feed & Grain Preservatives, Food Preservatives, Herbicides, Cellulose Acetate Propionate) & Geography � Global Trends & Forecasts To 2018


[228 Pages Report] Propionic acid is a three-carbon carboxylic acid with a molecular formula of CH3CH2COOH. It is a clear, colorless liquid with a pungent odor. It is commercially manufactured by the hydrocarboxylation of ethylene in the presence of nickel carbonyl catalyst. Propionic acid and derivatives are largely used as feed and food preservatives. It inhibits the growth of molds and bacteria. It is also used to make some specialized propionates, such as cellulose acetate propionate (CAP), which is a useful thermoplastic. The other applications include herbicides, pharmaceuticals, and solvents. It may cause irritation to the human body in case of contact, so various health organizations are involved in continuously monitoring its exposure levels.
The global propionic acid market has grown significantly during the past few years and is expected to grow at a more rapid pace in the next five years, mainly driven by the growing demand from feed preservatives, grain preservatives, and food preservatives. Europe emerged as the largest market of propionic acid & derivatives mostly driven by the ban imposed on the antibiotics in some applications since 2006. The demand in the European region is likely to remain healthy due to huge demand for the feed and grain preservatives segment. The U.S. is the largest single market across the globe. Its consumption in other countries had improved over the past few years and is expected increase further over the near term. The major market production facilities are located in developed markets, such as in Germany, the U.S., the Netherlands, Sweden, and Canada. Thus, these countries will remain major exporters of propionic acid and derivatives. Countries like Spain, France, India, Brazil, South Africa, Russia, etc. will remain major importers.
This study basically aims to estimate the global Propionic acid market for 2012, and to project the expected demand of the same from 2013 to 2018. This market research study provides detailed qualitative and quantitative analysis of the global market. It provides a comprehensive review of major market drivers, restraints, opportunities, winning imperatives, challenges, and key issues in the market. The market is further segmented and forecasted for major countries like the U.S., Canada, the Netherlands, Germany, Spain, China, U.K., etc. The market is also segmented on the basis of applications of propionic acid. We have used various secondary sources such as encyclopedia, directories, and databases to identify and collect information useful for this extensive commercial study of the market. The primary sources—experts from related industries and suppliers—have been interviewed to obtain and verify critical information as well as to assess the future prospects.
Competitive scenarios of the top players in the propionic acid market & derivatives are discussed in detail. We have also profiled leading players of this industry with their recent developments and other strategic industry activities. These include: BASF SE (Germany), The Dow Chemical Company (U.S.), Perstorp (Sweden), Eastman Chemical (U.S.), Niacet Corporation (U.S.), etc.
Scope of the report:
This research report categorizes the global propionic acid market & derivatives on the basis of applications and geography, forecasting volumes, value, and analyzing trends in each of the submarkets.
On the basis of applications:
The market is segmented on the basis of industry applications, such as animal feed & grain preservatives, food preservatives, herbicides, cellulose acetate propionate, and others. Each application is further described in detail in the report with their volumes and value forecasts.
On the basis of geography:
Key countries including Spain, France, Germany, Italy, the Netherlands, China, Japan, the U.S., Canada, etc.
Propionic acid & derivatives are widely used in feed preservatives, grain preservatives, and food preservatives as they regarded as one of the safest additives available in the market. In addition, it is also used in herbicides, cellulose acetate propionate, esters, fragrances, etc.
The global demand for propionic acid & derivatives is increasing on the back of growing consumption for animal feed and grain preservatives. In addition, propionates’ demand in the food preservative segments is also likely to jump in the coming years due to rising demand to increase the shelf life of the food on the global level. However, demand is likely to get affected due to limited production capacity and lack of technological innovation.
The global propionic acid market in terms of revenue was estimated to be worth $935.7 million in 2012 and is expected to reach $1,608.8 million by 2018, growing at a CAGR of 7.8% from 2013 to 2018. Europe dominated the global market in 2012. Emerging markets are likely to fuel the future growth of propionic acid & derivatives.
Propionic Acid Market & Derivatives: Market Share, By Geography, 2012 (Volume)
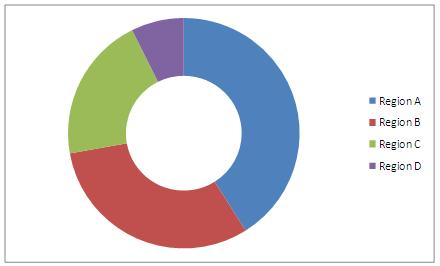
Source: MarketsandMarkets Analysis
Its consumption in the developed markets is more than the developing markets. There are a handful of propionic acid producers which dominate the market. Majority of these companies’ propionic acid plants are located in the developed markets. However, demand from the emerging markets is increasing due to rising awareness about the benefits.
This report analyzes the propionic acid market & derivatives by key countries at present and expected key countries in the future. It also provides detailed segmentation of the market on the basis of its major applications and on the basis of raw materials employed for producing it, along with its forecast till 2018. The report discusses in detail the major supply and demand factors affecting the market at the global, regional, and country level.
The dominant producers of propionic acid are BASF SE (Germany), The Dow Chemical Company (U.S.), Perstorp (Sweden), and Eastman Chemical (U.S.), while Niacet Corporation (U.S.) and Macco (Canada) are among the major players of propionates.
 Exclusive indicates content/data unique to MarketsandMarkets and not available with any competitors.
Table Of Contents
1 Introduction (Page No. - 20)
1.1 Key Take-Aways
1.2 Report Description
1.3 Stakeholders
1.4 Research Methodology
1.4.1 Market Size
1.4.2 Major Secondary Sources Used
1.4.3 Key Data Points Taken From Secondary Sources
1.4.4 Key Data Points Taken From Primary Sources
1.4.5 Assumptions Made For This Report
2 Executive Summary (Page No. - 25)
3 Premium Insights (Page No. - 27)
3.1 Market Segments
3.2 Market Dynamics
3.3 Market Global Outlook
3.4 Applications Market
3.5 Major Players In The Propionic Acid Market & Derivatives
4 Propionic Acid Market Overview (Page No. - 40)
4.1 Introduction
4.2 Value Chain Analysis
4.3 Market Dynamics
4.3.1 Drivers
4.3.1.1 Increasing Demand From Animal Feed And Grain Preservatives Is Fueling The Market Growth
4.3.1.2 Global Low Per Capita Consumption In Food Preservatives, Except In U.S., Provides The Potential For Global Growth
4.3.1.3 Increasing Penetration In Developing Economies Will Enhance The Geographic Coverage
4.3.2 Restraints
4.3.2.1 Lack Of Production Facilities Across Geographies Limits The Market Growth
4.3.2.2 Lack Of Technological Innovation Restricts The Production Capacity
4.3.2.3 Environmental Concerns Impacting The Herbicides Market
4.3.3 Opportunities
4.3.3.1 Currently Untapped And Developing Markets Provide Scope For Further Growth
4.3.3.2 Potential Market Presently Covered By Antibiotics
4.4 Burning Issue
4.4.1 Reducing Margins Are Increasing Manufacturers’ Worries
4.5 Winning Imperatives
4.5.1 Focused Research And Development Initiative To Produce Innovative Products
4.5.2 Forward Integration
4.6 Regulation
4.7 Raw Material Analysis
4.8 Porter’s Five Forces Analysis
4.8.1 Bargaining Power Of Supplier
4.8.2 Threat Of New Entrants
4.8.3 Bargaining Power Of Buyers
4.8.4 Threat Of Substitute
4.8.5 Degree Of Competition
4.9 Patent Analysis
5 Global Propionic Acid Market (Page No. - 60)
5.1 Introduction
5.2 Market Estimates
5.3 Market Estimates By Geography
6 Propionic Acid Market, by Applications (Page No. - 64)
6.1 Introduction
6.2 Market Estimates, By Applications
6.3 Animal Feed & Grain Preservatives
6.4 Food Preservative
6.5 Herbicides
6.6 Cellulose Acetate Propionate (CAP)
7 Propionic Acid Market, by Geography (Page No. - 77)
7.1 Introduction
7.2 Europe
7.2.1 Overview
7.2.1.1 Market Share, By Countries
7.2.1.2 Market Estimates, By Volume And Value
7.2.1.3 Propionic Acid And Derivatives Plant Capacity Estimates, By Companies
7.2.2 France
7.2.2.1 Major Propionic Acid And Derivatives Trade Markets
7.2.2.2 France Market Volume Estimates, By Applications
7.2.2.3 France Market Value Estimates, By Applications
7.2.3 Spain
7.2.3.1 Major Propionic Acid And Derivatives Trade Markets
7.2.3.2 Spain Market Volume Estimates, By Applications
7.2.3.3 Spain Market Value Estimates, By Applications
7.2.4 Germany
7.2.4.1 Major Propionic Acid and Derivatives Trade Markets
7.2.4.2 Germany Market Volume Estimates, By Applications
7.2.4.3 Germany Market Value Estimates, By Applications
7.2.5 Italy
7.2.5.1 Major Propionic Acid and Derivatives Trade Markets
7.2.5.2 Italy Market Volume Estimates, By Applications
7.2.5.3 Italy Market Value Estimates, By Applications
7.2.6 U.K.
7.2.6.1 Major Propionic Acid and Derivatives Trade Markets
7.2.6.2 U.K. Market Volume Estimates, By Applications
7.2.6.3 U.K. Market Value Estimates, By Applications
7.2.7 The Netherlands
7.2.7.1 Major Propionic Acid and Derivatives Trade Markets
7.2.7.2 The Netherlands Market Volume Estimates, By Applications
7.2.7.3 The Netherlands Market Value Estimates, By Applications
7.2.8 Rest Of Europe
7.2.8.1 Major Propionic Acid and Derivatives Trade Markets
7.2.8.2 Rest Of Europe Market Volume Estimates, By Applications
7.2.8.3 Rest Of Europe Market Value Estimates, By Applications
7.3 North America
7.3.1 Overview
7.3.1.1 Propionic Acid Market and Derivatives: Share, By Countries
7.3.1.2 Market Estimates, By Volume And Value
7.3.1.3 Plant Capacity Estimates, By Companies
7.3.2 U.S.
7.3.2.1 Major Propionic Acid And Derivatives Trade Markets
7.3.2.2 U.S. Market Volume Estimates, By Applications
7.3.2.3 U.S. Market Value Estimates, By Applications
7.3.3 Canada
7.3.3.1 Major Propionic Acid And Derivatives Trade Markets
7.3.3.2 Canada Market Volume Estimates, By Applications
7.3.3.3 Canada Market Value Estimates, By Applications
7.4 Asia-Pacific
7.4.1 Overview
7.4.1.1 Propionic Acid And Derivatives Market Share, By Countries
7.4.1.2 Market Estimates, By Volume And Value
7.4.1.3 Plant Capacity Estimates, By Companies
7.4.2 China
7.4.2.1 Major Trade Markets
7.4.2.2 China Market Volume Estimates, By Applications
7.4.2.3 China Market Value Estimates, By Applications
7.4.3 Japan
7.4.3.1 Major Trade Markets
7.4.3.2 Japan Market Volume Estimates, By Applications
7.4.3.3 Japan Market Value Estimates, By Applications
7.4.4 Rest Of Asia-Pacific
7.4.4.1 Major Trade Markets
7.4.4.2 Rest Of Asia-Pacific Propionic Acid Market and Derivatives: Volume Estimates, By Applications
7.4.4.3 Rest Of Asia-Pacific Market Value Estimates, By Applications
7.5 Rest Of World
7.5.1 Overview
7.5.1.1 Market Volume Estimates, By Applications
7.5.1.2 Propionic Market Value Estimates, By Applications
7.5.1.3 Major Propionic Acid And Derivatives Trade Markets
8 Competitive Landscape (Page No. - 156)
8.1 Introduction
8.2 New Product Launch: The Most Popular Growth Strategy
8.3 Maximum Developments In 2011
8.4 North America: Region With Maximum Developments
8.5 BASF SE, Kemin Industries Inc, Macco Organiques Inc., Perstorp Holding Ab & Impextraco Nv: The Most Active Participants
8.6 New Products Launch/Development
8.7 Product Showcase
8.8 Expansion
8.9 Agreements & Collaboration
8.10 Mergers & Acquisitions
9 Company Profiles (Overview, Financials, Products & Services, Strategy, And Developments)* (Page No. - 169)
9.1 A.M. Food Chemicals Co. Ltd
9.2 Addcon Group Gmbh
9.3 BASF SE
9.4 BASF-YPC Company Limited
9.5 Biomin Holding Gmbh
9.6 Daicel Corporation
9.7 The Dow Chemical Company
9.8 Eastman Chemical Company
9.9 Impextraco Nv
9.10 KEMIN Industries Inc
9.11 Krishna Chemicals
9.12 MACCO Organiques Inc.
9.13 Niacet Corporation
9.14 Perstorp Holding Ab
9.15 Prathista Industries Ltd
*Details On Overview, Financials, Product & Services, Strategy, And Developments Might Not Be Captured In Case Of Unlisted Companies.
Appendix (Page No. - 217)
U.S. Patents
Europe Patents
Japan Patents
List Of Tables (90 Tables)
Table 1 Propionic Acid Market Volume, By Geography, 2011 – 2018 (Kt)
Table 2 Propionic Acid Market Value, By Geography, 2011 – 2018 ($Million)
Table 3 Physical & Chemical Properties
Table 4 Impact Of Major Drivers On Global Market, 2013 – 2018
Table 5 Impact Of Major Restraints On Global Market, 2013 – 2018
Table 6 Major Opportunities Analysis In Global Market, 2013 – 2018
Table 7 Typical Level Of Propionic Acid & Derivative Recommended, By Applicants
Table 8 Ethylene: Average Prices, 2011 – 2018 ($/Ton)
Table 9 Propionic Acid Market Volume (Kt) And Value ($Million), 2011 – 2018
Table 10 Market Volume, By Geography, 2011 – 2018 (Kt)
Table 11 Market Value, By Geography, 2011 – 2018 ($Million)
Table 12 Market Volume, By Applications, 2011 – 2018 (Kt)
Table 13 Propionic Acid Market Value, By Applications, 2011 – 2018 ($Million)
Table 14 Propionic Acid Based Animal Feed & Grain Preservative Market: Market Volume, By Geography, 2011 – 2018 (Kt)
Table 15 Propionic Acid Market Value, By Geography, 2011 – 2018 ($Million)
Table 16 Propionic Acid Market Volume, By Geography, 2011 – 2018 (Kt)
Table 17 Propionic Acid Market Value, By Geography, 2011 – 2018 ($Million)
Table 18 Propionic Acid Based Herbicides Market: Market Volume, By Geography, 2011 – 2018 (Kt)
Table 19 Propionic Acid Market Value, By Geography, 2011 – 2018 ($Million)
Table 20 Cellulose Acetate Propionate Market: Market Volume, By Geography, 2011 – 2018 (Kt)
Table 21 Cellulose Acetate Propionate Market: Market Value, By Geography, 2011 – 2018 ($Million)
Table 22 Europe: Propionic Acid Market & Derivatives, Volume, By Countries, 2011 – 2018 (Kt)
Table 23 Europe: Market Value, By Countries, 2011 – 2018 ($Million)
Table 24 Europe: Market Volume, By Applications, 2011 – 2018 (Kt)
Table 25 Europe: Market Value, By Applications, 2011 – 2018 ($Million)
Table 26 Europe: Plant Capacities, By Companies, 2012 (Kt)
Table 27 France: Major Propionic Acid & Derivatives Trade Markets, 2012
Table 28 France: Market Volume, By Applications, 2011 – 2018 (Kt)
Table 29 France: Propionic Acid Market & Derivatives: Value, By Applications, 2011 – 2018 ($Million)
Table 30 Spain: Major Trade Markets, 2012
Table 31 Spain: Propionic Acid Market & Derivatives Volume, By Applications, 2011 – 2018 (Kt)
Table 32 Spain: Market Value, By Applications, 2011 – 2018 ($Million)
Table 33 Germany: Major Trade Markets, 2012
Table 34 Germany: Market Volume, By Applications, 2011 – 2018 (Kt)
Table 35 Germany: Market Value, By Applications, 2011 – 2018 ($Million)
Table 36 Italy: Major Trade Markets, 2011
Table 37 Italy: Market Volume, By Applications, 2011 – 2018 (Kt)
Table 38 Italy: Market Value, By Applications, 2011 – 2018 ($Million)
Table 39 U.K.: Major Trade Markets, 2012
Table 40 U.K.: Propionic Acid Market, By Volume, By Applications, 2011 – 2018 (Kt)
Table 41 U.K.: Market Value, By Applications, 2011 – 2018 ($Million)
Table 42 The Netherlands: Major Trade Markets, 2012
Table 43 The Netherlands: Market Volume, By Applications, 2011 – 2018 (Kt)
Table 44 The Netherlands: Propionic Acid Market Value, By Applications, 2011 – 2018 ($Million)
Table 45 Rest Of Europe: Major Trade Market, 2011
Table 46 Rest Of Europe: Market Volume, By Applications, 2011 – 2018 (Kt)
Table 47 Rest Of Europe: Market Value, By Applications, 2011 – 2018 ($Million)
Table 48 North America: Propionic Acid Market & Derivatives Volume, By Countries, 2011 – 2018 (Kt)
Table 49 North America: Market Volume, By Countries, 2011 – 2018 (Kt)
Table 50 North America: Market Volume, By Applications, 2011 – 2018(Kt)
Table 51 North America: Market Value, By Applications, 2011 – 2018 ($Million)
Table 52 North America: Major Plant Capacities, By Companies, 2012 (Kt)
Table 53 U.S.: Major Trade Markets, 2012
Table 54 U.S.: Propionic Acid Market Volume, By Applications, 2011 – 2018 (Kt)
Table 55 U.S.: Market Value, By Applications, 2011 – 2018 ($Million)
Table 56 Canada: Major Trade Markets, 2012
Table 57 Canada: Market Volume, By Applications, 2011 – 2018 (Kt)
Table 58 Canada: Market Value, By Applications, 2011 – 2018 ($Million)
Table 59 Asia-Pacific: Propionic Acid Market & Derivatives Volume, By Countries, 2011 – 2018 (Kt)
Table 60 Asia-Pacific: Market Value, By Countries, 2011 – 2018 ($Million)
Table 61 Asia-Pacific: Market Volume, By Applications, 2011 – 2018 (Kt)
Table 62 Asia-Pacific: Market Value, By Applications, 2011 – 2018 ($Million)
Table 63 Asia-Pacific: Major Plant Capacities, By Companies, 2012 (Kt)
Table 64 China: Major Trade Markets, 2012
Table 65 China: Market Volume, By Applications, 2011 – 2018 (Kt)
Table 66 China: Market Value, By Applications, 2011 – 2018 ($Million)
Table 67 Japan: Major Trade Markets, 2012
Table 68 Japan: Market Volume, By Applications, 2011 – 2018 (Kt)
Table 69 Japan: Market Value, By Applications, 2011 – 2018 ($Million)
Table 70 Rest Of Asia-Pacific: Major Trade Markets, 2012
Table 71 Rest Of Asia-Pacific: Market Volume, By Applications, 2011 – 2018 (Kt)
Table 72 Rest Of Asia-Pacific: Market Value, By Applications, 2011 – 2018 ($Million)
Table 73 Rest Of World: Propionic Acid Market & Derivatives Volume, By Applications, 2011 – 2018 (Kt)
Table 74 Rest Of World: Market Value, By Applications, 2011 – 2018 ($Million)
Table 75 Rest Of World: Major Trade Markets, 2012
Table 76 New Products Launch/Development, 2010 – 2013
Table 77 Product Showcase, 2010 – 2013
Table 78 Expansion, 2010 – 2013
Table 79 Agreements & Collaboration, 2010 – 2013
Table 80 Mergers & Acquisitions, 2010 – 2013
Table 81 BASF: Annual Revenue, By Business Segments, 2011 – 2012 ($Million)
Table 82 BASF: Products & Its Applications
Table 83 BIOMIN: Products & Its Applications
Table 84 DAICE: Annual Revenue, By Business Segments, 2012 – 2013 ($Million)
Table 85 DOW: Annual Revenue, By Business Segments, 2011 – 2012 ($Million)
Table 86 Eastman: Annual Revenue, By Business Segments, 2011 – 2012 ($Million)
Table 87 Eastman: Products & Its Applications
Table 88 KEMIN: Products & Its Applications
Table 89 Niacet: Products & Its Applications
Table 90 Perstorp: Annual Revenue, By Business Segments, 2011 – 2012 ($Million)
List Of Figures (30 Figures)
Figure 1 Propionic Acid Market Segments
Figure 2 Propionic Acid Market Dynamics
Figure 3 Drivers Vs Restraints
Figure 4 Porter’s Five Forces Analysis
Figure 5 Regional Market Life Cycle
Figure 6 Global & Regional Overview
Figure 7 Propionic Acid Market Share, By Applications, 2012 – 2018
Figure 8 Propionic Acid Based Animal Feed & Grain Preservatives Market Share, By Geographies, 2012
Figure 9 Propionic Acid Based Food Preservatives Market Share, By Geographies, 2012
Figure 10 Propionic Acid Based Herbicides Market Share, By Geographies, 2012
Figure 11 Cellulose Acetate Propionate Market Share, By Geographies, 2012
Figure 12 Major Players, Production Capacities (Kt)
Figure 13 Market Share, By Geographies
Figure 14 Overview Of Propionic Acid Value Chain
Figure 15 Porter’s Five Forces Analysis
Figure 16 Patent Analysis, By Geography, 2009 – 2013
Figure 17 Patent Analysis Trends, By Geography, 2009 – 2013
Figure 18 Patent Analysis, By Companies, 2009 – 2013
Figure 19 Propionic Acid Market Share, By Applications, 2012
Figure 20 Propionic Acid Market Share, By Geography, 2012 (%)
Figure 21 Europe: Market Share, By Volume, 2012 (%)
Figure 22 Europe: Market Share, By Value, 2012 (%)
Figure 23 North America: Market Share, By Volume, 2012 (%)
Figure 24 North America: Market Share, By Value, 2012 (%)
Figure 25 Asia-Pacific: Market Share, By Volume, 2012 (%)
Figure 26 Asia-Pacific: Market Share, By Value, 2012 (%)
Figure 27 Market Share, By Growth Strategies, 2010 – 2013
Figure 28 Developments In Global Market, 2010 – 2013
Figure 29 Propionic Acid Market Share, By Geography, 2010 – 2013
Figure 30 Propionic Acid Market Share,By Companies, 2010 – 2013


Growth opportunities and latent adjacency in Propionic Acid Market