Process Instrumentation Market Analysis of Technology & Industries - Global Forecast to 2014 - 2020


The Global Process Instrumentation Market report is segmented by Field Instruments, Communication Protocol, Ex-Proof/Intrinsically safe, Industry applications and by Geography.
Scope of the Report
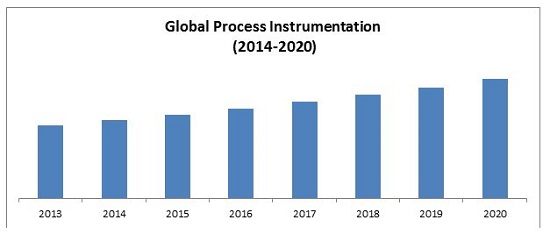
The report primarily deals with different types of Field instruments like Flow, Pressure, Level, Temperature and Humidity. The report also covers field instruments by various communication protocol like Profibus PA, Foundation Fieldbus, HART, Wireless HART, Modbus, ISA-100, SDI-12, BACNet and Standard Analog (4 to 20ma). The Global process Instrumentation market is expected to reach $18.96 Billion by 2020, at a CAGR of 3.34% from 2014 to 2020. Further the Field Instruments are segmented by Transmitters 13.24 Billion(2020), Switches 1.53 Billion(2020)and by Gauges 4.08 billion(2020).
On the basis of application areas
This report segments Global Process Instrumentation market by various industrial applications like water and waste water, controlled environments and pharmaceuticals, agriculture and livestock, mining and metals, oil, gas & petrochemicals, power generation, and other process industries. The market share analysis for all the players in each of the applications has been covered in the report. This report also covers TAM (Total addressable market) 18.96 Billion by 2020 CAGR of 3.34% and SAM (Serviceable addressable market) 7.37 Billion by 2020 CAGR of 5.30% for field instruments.
On the basis of Geography
The market is segmented into four major geographical regions namely Americas (U.S, Canada, Mexico, Brazil, Argentina and Others) EMEA (U.K, Germany, France, Italy, Spain and Others) APAC (China, India, Japan/Korea) and Rest of the World ( Australia, New Zealand and South East Asia).
The current and future trends for each region have been analyzed in this report. Porter’s five force model analysis, market share of major players like (Emerson, Endress+Hauser and many others), competitive landscaping is also included in this report.
Americas is the leading region in the overall process instrumentation market with 35.94% of market share in 2014; followed by EMEA and CHINA with 31.98 % and 12.65 % each in 2014.
The Global Process Instrumentation market research report classifies the market on the basis of different types of technology, communication protocols, applications and geographical analysis, forecasting value, and analyzing trends in the market.
Process instrumentation market is segmented into five broad sections: By Communication Protocols, By Field Instruments, By Ex proof/Intrinsically safe Field Instruments, By Industry Application and By Geography.
The application market is classified based on the industry application segments like chemical manufacturing, water and waste water treatment, pharmaceutical, energy & utilities, metals and mining, oil and gas extraction, and other process industries. The market trends and future projections for these applications are discussed.
On the basis of geography, America, Europe, Asia-Pacific and ROW markets are covered extensively. Each section provides market data, market drivers, trends and opportunities, key players, and competitive outlook. It also provides market tables for covering the sub-segments. In addition, the report provides ten extensive company profiles covering all the sub-segments.
The process instrumentation market is segmented into the major types of instruments used in the process industry. Flow, temperature, level, pressure, and Humidity transmitters, Switches and Gauges are covered in this report.
The Global process Instrumentation market is expected to reach $18.96 Billion by 2020, at a CAGR of 3.34% from 2014 to 2020. Region leads the overall Process Instrumentation market. In the report the drivers, restraints, and opportunities for the process Instrumentation market are covered. The big players are Siemens AG (Germany), ABB Ltd. (Switzerland), Endress+ Hauser AG (Switzerland), Emerson Electric Co. (US), Honeywell International, Inc. (U.S.), and Many others
 Exclusive indicates content/data unique to MarketsandMarkets and not available with any competitors.
Table of Content
1 Introduction
1.1 Objectives
1.2 Report Description
1.3 Markets Covered
1.4 Stakeholders
1.5 Research Methodology
1.5.1 Forecasting Approach
1.5.2 Key Data Points Taken from Secondary Sources
1.5.3 Key Data Points Taken from Primary Sources
1.5.4 Assumptions Made For The Report
1.5.5 List of Companies Covered During Study
2 Executive Summary
3 Cover story: Primary Research Interviews
4 Market Overview
4.1 Introduction
4.2 Market Definition
4.3 Market Dynamics
4.3.1 Market Drivers
4.3.1.1 Need of efficient energy
4.3.1.2 Increase in demand from process industry
4.3.1.3 Government initiatives
4.3.1.4 Modernization and migration services
4.3.1.5 Increasing labor cost
4.3.2 Market Restraints
4.3.2.1 Inadequacy in talent
4.3.2.2 Stagnant growth in developed markets
4.3.3 Market Opportunities
4.3.3.1 Emerging economies
4.4 Value Chain Analysis
4.4.1 Industry Structure
4.4.2 Detailed Value Chain
4.5 Porter’s Five Forces Model
4.5.1 Threat From New Entrants
4.5.2 Threat From Substitutes
4.5.3 Bargaining Power Of Suppliers
4.5.4 Bargaining Power of Customers
4.5.5 Degree of Competition
5 Global Process Instrumentation Market By Type of Instruments
5.1 Introduction
Global Process Instrumentation Market (Gauges, Switches & Transmitters) (2014-2020) ($ Million)
Global market, By Types of Instruments (2014-2020) ($ Million)
5.1.1 Flow
5.1.2 Level
5.1.3 Pressure
5.1.4 Temperature
5.1.5 Humidity
5.2 Global Process Instrumentation Market in Hazardous areas (Explosion proof & Intrinsically safe)
5.2.1 Flow
5.2.2 Level
5.2.3 Pressure
5.2.4 Temperature
5.2.5 Humidity
5.3 Global Process Instrumentation market, by Communication protocols
Global Market, By Type of Protocols (2014-2020) ($ Million)
5.3.1 Profibus PA
5.3.2 Foundation Fieldbus
5.3.3 HART
5.3.4 Wireless HART
5.3.5 Modbus
5.3.6 ISA 100
5.3.7 SDI-12
5.3.8 BACnet
5.3.9 Standard Analog
6 Global Process Instrumentation Market By Application
6.1 Introduction
Global Process Instrumentation Market, By Application (2014-2020) ($ Million)
6.2 Water and Waste Water
6.2.1 Market Share Analysis of Major Players in Water and Waste Water (2014-2020) ($ Million)
6.2.2 Market size by Gauges, Switches and Transmitter Types (2014-2020) ($ Million)
6.2.3 Market size by type of Instruments (Flow, Pressure, Temperature, Level etc.) (2014-2020) ($ Million)
6.2.4 Market size by Communication Protocols (Profibus, HART, FF, Wireless, SDI-12) (2014-2020) ($ Million)
6.2.5 Market Size by Geography (Americas, APAC, EMEA, RoW) (2014-2020) ($ Million)
6.3 Controlled Environments and Pharmaceuticals
6.3.1 Market Share Analysis of Major Players in Environments & Pharmaceuticals (2014-2020) ($ Million)
6.3.2 Market size by Gauges, Switches and Transmitter Types (2014-2020) ($ Million)
6.3.3 Market size by type of Instruments (Flow, Pressure, Temperature, Level etc.) (2014-2020) ($ Million)
6.3.4 Market size by Communication Protocols (Profibus, HART, FF, Wireless, BACnet) (2014-2020) ($ Million)
6.3.5 Market Size by Geography (Americas, APAC, EMEA, RoW) (2014-2020) ($ Million)
6.4 Agriculture and Livestock
6.4.1 Market Share Analysis of Major Players in Agriculture & Livestock (2014-2020) ($ Million)
6.4.2 Market size by Gauges, Switches and Transmitter Types (2014-2020) ($ Million)
6.4.3 Market size by type of Instruments (Flow, Pressure, Temperature, Level etc.) (2014-2020) ($ Million)
6.4.4 Market size by Communication Protocols (Profibus, HART, FF, Wireless) (2014-2020) ($ Million)
6.4.5 Market Size by Geography (Americas, APAC, EMEA, RoW) (2014-2020) ($ Million)
6.5 Mining and Metals
6.5.1 Market Share Analysis of Major Players in Mining and Metals (2014-2020) ($ Million)
6.5.2 Market size by Gauges, Switches and Transmitter Types (2014-2020) ($ Million)
6.5.3 Market size by type of Instruments (Flow, Pressure, Temperature, Level etc.) (2014-2020) ($ Million)
6.5.4 Market size by Communication Protocols (Profibus, HART, FF, Wireless) (2014-2020) ($ Million)
6.5.5 Market Size by Geography (Americas, APAC, EMEA, RoW) (2014-2020) ($ Million)
6.6 Oil & Gas and petrochemical
6.6.1 Market Share Analysis of Major Players in Oil & Gas (2014-2020) ($ Million)
6.6.2 Market size by Gauges, Switches and Transmitter Types (2014-2020) ($ Million)
6.6.3 Market size by type of Instruments (Flow, Pressure, Temperature, Level etc.) (2014-2020) ($ Million)
6.6.4 Market size by Communication Protocols (Profibus, HART, FF, Wireless) (2014-2020) ($ Million)
6.6.5 Market Size by Geography (Americas, APAC, EMEA, RoW) (2014-2020) ($ Million)
6.7 Power Generation
6.7.1 Market Share Analysis of Major Players in Power Generation (2014-2020) ($ Million)
6.7.2 Market size by Gauges, Switches and Transmitter Types (2014-2020) ($ Million)
6.7.3 Market size by type of Instruments (Flow, Pressure, Temperature, Level etc.) (2014-2020) ($ Million)
6.7.4 Market size by Communication Protocols (Profibus, HART, FF, Wireless) (2014-2020) ($ Million)
6.7.5 Market Size by Geography (Americas, APAC, EMEA, RoW) (2014-2020) ($ Million)
6.8 Other Process industries
6.8.1 Market share Analysis of Major Players in Food & Beverages, Utility OEM, Chemical plants etc. (2014-2020) ($ Million)
6.8.2 Market size by Gauges, Switches and Transmitter Types(2014-2020) ($ Million)
6.8.3 Market size by type of Instruments (Flow, Pressure, Temperature, Level etc.) (2014-2020) ($ Million)
6.8.4 Market size by Communication Protocol (Profibus, HART, FF, Wireless) (2014-2020) ($ Million)
6.8.5 Market Size by Geography (Americas, APAC, EMEA, RoW) (2014-2020) ($ Million)
7 Process Instrumentation (TAM ) Total available market
7.1 Process Instrumentation Total Addressable Market (TAM ) by Gauges, Switches and Transmitter types (2014-2020) ($ Million)
7.2 Process Instrumentation Total Addressable Market (TAM) by Communication Protocol (2014-2020) ($ Million)
7.3 Process Instrumentation Total Addressable Market (TAM) by Application (2014-2020) ($ Million)
8 Process Instrumentation (SAM) Serviceable addressable market
8.1 Process Instrumentation Service Market by Gauges, Switches and Transmitter types (2014-2020) ($ Million)
8.2 Process Instrumentation Service Market by Communication protocol (2014-2020) ($ Million)
8.3 Process Instrumentation Service Market by Application (2014-2020) ($ Million)
9 Global growth forecast for 2014 to 2020
9.1 Micro and macro trends
10 Global Process Instrumentation Market By Geography
10.1 Introduction
Global Process Instrumentation Market by Geography (2014-2020) ($ Million)
10.2 Americas
10.2.1 U.S.
10.2.2 Canada
10.2.3 Mexico
10.2.4 Brazil
10.2.5 Argentina
10.2.6 Others
10.3 EMEA
10.3.1 U.K.
10.3.2 Germany
10.3.3 France
10.3.4 Italy
10.3.5 Spain
10.3.6 Rest of Europe
10.3.7 Middle East
10.3.8 Africa
10.4 China
10.5 India
10.6 Japan/Korea
10.7 RoW
10.7.1 Australia
10.7.2 New Zealand
10.7.3 South-East Asia
11 Competition Market Share Analysis
11.1 Market Share Analysis by Gauges, Switches and Transmitter types
11.2 Market Share Analysis by Application
12 Company Profiles
12.1 Yokogawa
12.1.1 Company Snapshot
12.1.2 Key Developments
12.1.3 SWOT Analysis
12.1.4 MnM View
12.2 Siemens AG
12.2.1 Company Snapshot
12.2.2 Key Developments
12.2.3 SWOT Analysis
12.2.4 MnM View
12.3 Endress+Hauser
12.3.1 Company Snapshot
12.3.2 Key Developments
12.3.3 SWOT Analysis
12.3.4 MnM View
12.4 ABB ltd
12.4.1 Company Snapshot
12.4.2 Key Developments
12.4.3 SWOT Analysis
12.4.4 MnM View
12.5 Emerson Process Management
12.5.1 Company Snapshot
12.5.2 Key Developments
12.5.3 SWOT Analysis
12.5.4 MnM View
12.6 Honeywell
12.6.1 Company Snapshot
12.6.2 Key Developments
12.6.3 SWOT Analysis
12.6.4 MnM View
12.7 FOXBORO (INVENSYS)
12.7.1 Company Snapshot
12.7.2 Key Developments
12.7.3 SWOT Analysis
12.7.4 MnM View
12.8 DUON System
12.8.1 Company Snapshot
12.8.2 Key Developments
12.8.3 SWOT Analysis
12.8.4 MnM View
12.9 Fuji electric
12.9.1 Company Snapshot
12.9.2 Key Developments
12.9.3 SWOT Analysis
12.9.4 MnM View
12.10 GE Measurement Control
12.10.1 Company Snapshot
12.10.2 Key Developments
12.10.3 SWOT Analysis
12.10.4 MnM View
12.11 WIKA Alexander Wiegand SE & CO. KG
12.11.1 Company Snapshot
12.11.2 Key Developments
12.11.3 MnM View
12.12 OMEGA Engineering
12.12.1 Company Snapshot
12.12.2 Key Developments
12.12.3 MnM View
12.13 HACH (Danaher Corp.)
12.13.1 Company Snapshot
12.13.2 Key Developments
12.13.3 MnM View
12.14 ROTRONIC AG
12.14.1 Company Snapshot
12.14.2 Key Developments
12.14.3 MnM View
12.15 OAKTON Instruments
12.15.1 Company Snapshot
12.15.2 Key Developments
12.15.3 MnM View
12.16 KROHNE
12.16.1 Company Snapshot
12.16.2 Key Developments
12.16.3 MnM View
12.17 BADGER METER
12.17.1 Company Snapshot
12.17.2 Key Developments
12.17.3 MnM View
12.18 HK Instruments
12.18.1 Company Snapshot
12.18.2 Key Developments
12.18.3 MnM View
12.19 OJ Electronics
12.19.1 Company Snapshot
12.19.2 Key Developments
12.19.3 MnM View
12.20 S+S Regaltechnick
12.20.1 Company Snapshot
12.20.2 Key Developments
12.20.3 MnM View
12.21 Carel
12.21.1 Company Snapshot
12.21.2 Key Developments
12.21.3 MnM View


Growth opportunities and latent adjacency in Process Instrumentation Market