Pressure Control Equipment Market

Pressure Control Equipment Market by Type (Wireline Pressure Control Equipment, Coiled Tubing Pressure Control Equipment), Component, Sales Type (New Purchase, Rental, Services, Spares), Application, Pressure and Region - Global Forecast to 2027

Report Code: EP 6826 Jan, 2023, by marketsandmarkets.com

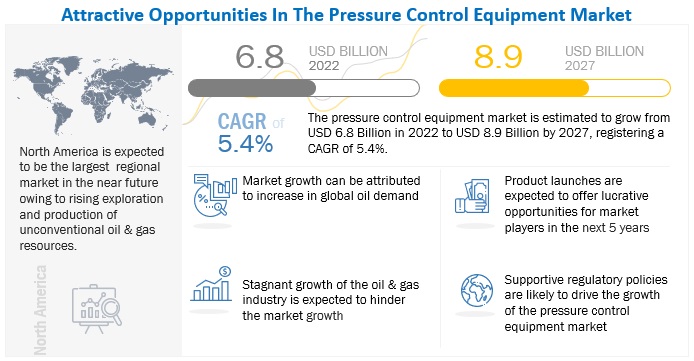
[255 Pages Report] The global pressure control equipment market is estimated to grow from USD 6.8 billion in 2022 to USD 8.9 billion by 2027; it is expected to record a CAGR of 5.4% during the forecast period. Rising exploration and production of unconventional oil & gas resources, especially in North America region, and increasing global oil demand are the major driving factor for the pressure control equipment market .
Pressure Control Equipment Market

To know about the assumptions considered for the study, Request for Free Sample Report

Pressure Control Equipment Market Dynamics

Driver: Rising exploration and production of unconventional oil & gas resources, especially in North America

Since its inception, the oil and gas industry has seen rapid changes in the methods, modes, and materials used for production and delivery.With conventional oil and gas reserves maturing, the demand for substitute resources that can efficiently meet rising energy demand is increasing.The discovery of unconventional oil and gas resources has aided in the development of clean and efficient energy sources. Unconventional oil and gas resources are those that do not occur in traditional formations and necessitate specialised extraction or production techniques.Shale gas, tight gas, coalbed methane (CBM), shale oil, tight oil, and natural gas hydrates are examples of unconventional oil and gas resources.Chemically, these resources are identical to conventional oil and gas resources. The distinction is based on their reservoir rock type, oil and gas origin, occurrence state, underground position, or the unique nature of their reservoirs.

Although the remaining global conventional resources are still abundant and sufficient to meet current needs, unconventional oil and gas resources are gradually becoming valuable and attracting more interest as the oil price rises. Unconventional oil and gas resources are being utilized more and more as decades of oil and natural gas production have resulted in extensive use of conventional resources. As per the World Energy Outlook report by the International Energy Agency (IEA), unconventional oil production is projected to increase from 1.8 mb/d in 2008 to 7.4 mb/d by 2030. By 2035, global unconventional oil production is expected to account for 15.3% of the total oil production. Hence, the increasing production of unconventional oil and gas is expected to lead to extensive exploration and production activities, ultimately fueling the demand for pressure control equipment.

The majority of shale reserves are located in North America, with the United States dominating the regional market, as well as in some parts of Europe and Asia.The International Energy Agency (IEA) predicts that shale production in the United States alone will exceed 100 million barrels per day. According to the US Energy Information Administration (EIA), US oil production from seven major shale formations increased by about 29,000 barrels per day (bpd) in January 2020, bringing total shale oil production to 9.14 million barrels per day. The increasing shale oil and gas production in the North Dakota basin, Montana's Bakken formations, and the Permian basin, as well as rising shale developments, are responsible for the US shale boom, which has propelled the country to the world's largest oil-producing country, ahead of Saudi Arabia and Russia. Furthermore, Argentina's Vaca Meurta shale basin is one of the world's largest shale reservoirs. Argentina has shale gas reserves of 23 trillion cubic metres and shale oil reserves of 27 billion barrels.

Restraint: Decline in capital expenditure of oilfield operators and service providers

Pressure control equipment demand is tied to exploration, development, and production operations, as well as capital investment by oil and gas corporations. Oil and natural gas price fluctuations have a direct influence on these operations. The fluctuations occur as a result of changes in supply and demand for oil and natural gas, governmental regulations, including policies governing the exploration, production, and development of oil and natural gas reserves, weather, natural disasters, and other factors. Because many large-scale development projects are for a long time, oil and gas companies may reduce or postpone major expenditures based on the perception of long-term low oil and natural gas prices.The prolonged reduction in crude oil prices or expectations of such reduction is expected to hamper the growth of the market.

Furthermore, the growth of the market is directly affected by the decline in capital expenditures by oilfield operators and service providers. It may lead to a decrease in demand for pressure control equipment.

Opportunities: Emerging offshore opportunities

Offshore exploration, drilling, and production operations necessitate distinct environmental and technological issues than onshore oil and gas activities. Despite the challenges posed by harsh offshore environmental conditions, advances in exploration and production technology for application in ice prone regions, such as the Grand Banks, Bohai Sea, Caspian Sea, Cook Inlet, and Sakhalin Island, have developed economically feasible solutions for the production in these regions.

The global slowdown in oil prices has resulted in downturn in the drilling activities in the past few years, thereby putting further pressure on offshore drillers and service providers; however, opportunities for offshore drillers is expected to grow as the industry tends to recover moderately. For instance, in Argentina, the Ministry of Energy launched an auction process for about 6–10 offshore exploration blocks at the end of 2017, whereas the Colombian government reduced offshore gas royalties and lowered windfall profit fees to support offshore developments in the country. Other activities such as commercialization of Liza oil discovery in the Stabroek offshore block by ExxonMobil in Guyana and growing contracts for exploration and production of hydrocarbons in the deepwater offshore in Mexico are expected to develop new opportunities for offshore drilling.

Challenges: Transition toward adoption of renewable energy sources

The aim of global economies to reduce their carbon footprint and emission of greenhouse gases has fueled the adoption of clean and green energy alternatives. This has led the economies to use renewable energy sources such as solar, wind (onshore and offshore), biomass, hydroelectric, and geothermal power for power generation. The growing energy demand due to rapid industrialization and urbanization has further accelerated the transition.

Renewable energy is considered to be the fastest-growing sector globally, with a large number of renewable energy projects receiving more funding than ever before. As the need for clean, sustainable energy increases and renewable technologies become more advanced, more and more projects are expected to be initiated. For instance, the Wudongde Hydropower Station, China, has been under construction since 2015 and began producing power in June 2020. The dam started operational by December 2021. It is expected to offset the use of 12.2 million tons of standard coal and reduce CO2 emissions by 30.5 million tons per year and sulfur dioxide emissions by 104,000 tons per year. The Hornsea Project 2, UK, estimated at the cost of USD 7.8 billion, has been in development since August 2015 and completed by 2022. This project boasts a total installed capacity of 1,386 MW on completion. Countries such as Canada, the US, India, and the UAE are actively investing in renewable energy projects, thus fueling the adoption of renewable energy sources.

The transition toward renewable energy sources, fueled by the increased investments by governments worldwide, is expected to result in a decline in upstream, midstream, and downstream activities and the growth of market players to an extent.

Market Trends
Pressure Control Equipment Market Size, and Share

To know about the assumptions considered for the study, download the pdf brochure

Wireline pressure control equipment segment, by type, is expected to be the largest market during the forecast period

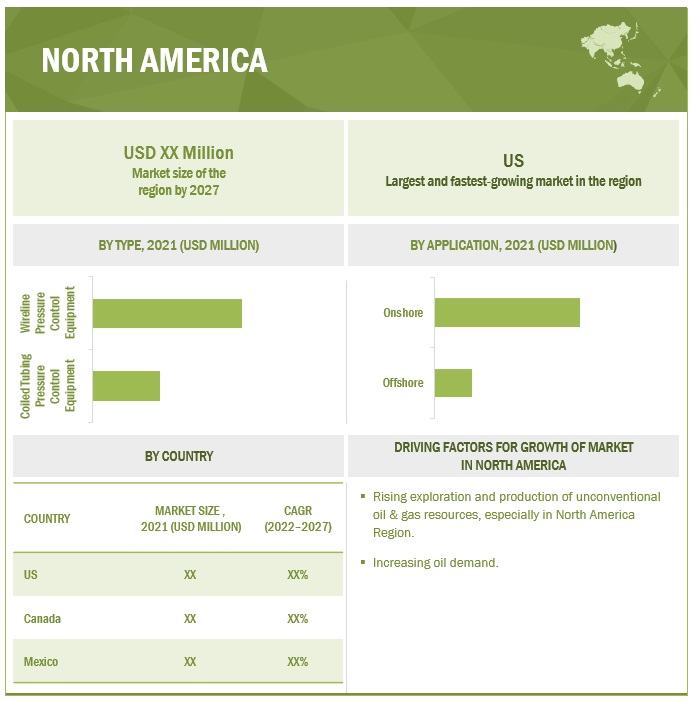
This report segments the pressure control equipment market based on type into two types: wireline pressure control equipment, and coiled tubing pressure control equipment. The wireline pressure control equipment is expected to be the largest market during the forecast period. Increase in drilling activities in key tight and shale basins and inception of several new projects in the federal offshore—Gulf of Mexico—are expected to drive the market for wireline pressure control equipment.

By Component, the control head segment is expected to be the fastest during the forecast period

This report segments the pressure control equipment market based on component into 11 segments: flow control valves, flow control treating iron, flow control adapter & flange, flow control surface crossover, flow control flexible hoses, wellhead equipment, control head, Christmas tree, quick unions, coiled tubing WPCE and others, which includes hydraulic chokes, and crossover adapters. Control head is expected to be the fastest segment during the forecast period. Reduced drilling cost and increases well production is expected to drive the market for control head segment.

“North America”: The largest pressure control equipment market”

North America is expected to dominate the pressure control equipment market between 2022–2027, followed by Europe and Asia Pacific. Rising exploration and production of unconventional oil & gas resources, especially in North America region is driving the gas control equipment market for this region.
Pressure Control Equipment Market Size, and Share

Key Market Players

The market is dominated by a few major players that have a wide regional presence. The major players in the pressure control equipment market are SLB (US), Weatherford (US), NOV Inc (US), Baker Hughes Company (US), and The Weir Group PLC (UK). Between 2018 and 2022, Strategies such as product launches, contracts, agreements, partnerships, collaborations, alliances, acquisitions, and expansions are followed by these companies to capture a larger share of the market.

Want to explore hidden markets that can drive new revenue in Pressure Control Equipment Market?

Scope of the Report

Report Metric

Details

Market size available for years

2020–2027

Base year considered

2021

Forecast period

2022–2027

Forecast units

Value (USD Billion)

Segments covered

Pressure control equipment market by type, component, application, sales type, pressure and region.

Geographies covered

Asia Pacific, North America, Europe, Middle East & Africa, and South America

Companies covered

SLB (US), Weatherford (US), NOV Inc (US), Baker Hughes (US), The Weir Group PLC (UK), Hunting (UK), Emerson Electric Co (US), Flowserve Corporation (US), The IKM Group (Norway), Control Flow Inc (US), Brace Tool (Canada), Sunnda Corporation (US), GKD Industries Ltd (Canada), TIS Manufacturing (UK), NXL Technologies (Canada), IOT Group (Norway), Integrated Equipment (US), Allied Valve Inc (US), Omega (UK), and FHE (US)

This research report categorizes the market by type, component, application, sales type, pressure and region.

On the basis of by type, the pressure control equipment market has been segmented as follows:
  • Wireline Pressure Control Equipment
  • Coiled Tubing Pressure Control Equipment
On the basis of component, the market has been segmented as follows:
  • Flow Control Valves
  • Flow Control Treating Iron
  • Flow Control Adapter & Flange
  • Flow Control Surface Crossover
  • Wellhead Equipment
  • Control Head
  • Christmas Tree
  • Quick Unions
  • Coiled Tubing WPCE
  • Others
On the basis of application, the market has been segmented as follows:
  • Onshore
  • Offshore
On the basis of sales type, the market has been segmented as follows:
  • New Purchase
  • Rental
  • Services
  • Spares
On the basis of pressure, the market has been segmented as follows:
  • High Pressure
  • Low Pressure
On the basis of region, the market has been segmented as follows:
  • Asia Pacific
  • Europe
  • North America
  • Middle East & Africa
  • South America

Recent Developments

  • In October 2022, Weatherford received a five-year contract exceeding $500 million from Petroleum Development Oman (PDO) to deliver Integrated Drilling Services in the Marmul and Grater Saqar fields. As a part of this contract Weatherford will deliver drilling solutions to 700+ wells in the Marmul and Grater Saqar fields in the next years.
  • In October 2022, SLB has entered into an agreement to acquire Gyrodata Incorporated, a global company specializing in gyroscopic wellbore positioning and survey technology. This combination will improve wellbore quality and reduce drilling risk to unlock even the most remote and complex reservoirs.
  • In May 2022, Baker Hughes has launched a new subsea wellhead technology, the MS-2 Annulus Seal, to save substantial operational rig costs by helping lower overall wellhead installation costs due to reduced rig trips.
  • In October 2020, NOV Inc signed a contract for Joint Industry Project (JIP) with Equinor and TotalEnergies for 2 years. This contract focuses on research and developments for deepwater projects.

Frequently Asked Questions (FAQ):

To speak to our analyst for a discussion on the above findings, click Speak to Analyst

Exclusive indicates content/data unique to MarketsandMarkets and not available with any competitors.

TABLE OF CONTENTS
 
1 INTRODUCTION (Page No. - 34)
    1.1 STUDY OBJECTIVES 
    1.2 MARKET DEFINITION 
           1.2.1 PRESSURE CONTROL EQUIPMENT MARKET, BY TYPE: INCLUSIONS AND EXCLUSIONS
           1.2.2 MARKET, BY COMPONENT: INCLUSIONS AND EXCLUSIONS
           1.2.3 MARKET, BY SALES TYPE: INCLUSIONS AND EXCLUSIONS
           1.2.4 MARKET, BY APPLICATION: INCLUSIONS AND EXCLUSIONS
           1.2.5 MARKET, BY PRESSURE: INCLUSIONS AND EXCLUSIONS
           1.2.6 MARKET, BY REGION: INCLUSIONS AND EXCLUSIONS
    1.3 MARKET SCOPE 
           1.3.1 MARKET SEGMENTATION
           1.3.2 REGIONAL SCOPE
           1.3.3 YEARS CONSIDERED
    1.4 CURRENCY CONSIDERED 
    1.5 LIMITATIONS 
    1.6 STAKEHOLDERS 
    1.7 SUMMARY OF CHANGES 
           1.7.1 RECESSION IMPACT
 
2 RESEARCH METHODOLOGY (Page No. - 40)
    2.1 RESEARCH DATA 
           FIGURE 1 PRESSURE CONTROL EQUIPMENT MARKET: RESEARCH DESIGN
    2.2 MARKET BREAKDOWN AND DATA TRIANGULATION 
           FIGURE 2 DATA TRIANGULATION METHODOLOGY
           2.2.1 SECONDARY DATA
                    2.2.1.1 Key data from secondary sources
           2.2.2 PRIMARY DATA
                    2.2.2.1 Key data from primary sources
                    2.2.2.2 Breakdown of primaries
    2.3 RESEARCH SCOPE 
           FIGURE 3 MAIN METRICS CONSIDERED WHILE CONSTRUCTING AND ASSESSING DEMAND FOR PRESSURE CONTROL EQUIPMENT
    2.4 MARKET SIZE ESTIMATION 
           2.4.1 BOTTOM-UP APPROACH
                    FIGURE 4 MARKET SIZE ESTIMATION METHODOLOGY: BOTTOM-UP APPROACH
           2.4.2 TOP-DOWN APPROACH
                    FIGURE 5 MARKET SIZE ESTIMATION METHODOLOGY: TOP-DOWN APPROACH
           2.4.3 DEMAND-SIDE ANALYSIS
                    2.4.3.1 Regional analysis
                    2.4.3.2 Country analysis
                    2.4.3.3 Assumptions for demand side
                    2.4.3.4 Calculations for demand side
           2.4.4 SUPPLY-SIDE ANALYSIS
                    FIGURE 6 KEY STEPS CONSIDERED FOR ASSESSING SUPPLY OF MARKET
                    FIGURE 7 MARKET: SUPPLY-SIDE ANALYSIS
                    2.4.4.1 Assumptions for supply side
                    2.4.4.2 Calculations for supply side
                               FIGURE 8 COMPANY REVENUE ANALYSIS, 2021
           2.4.5 RESEARCH FORECAST
 
3 EXECUTIVE SUMMARY (Page No. - 54)
    TABLE 1 PRESSURE CONTROL EQUIPMENT MARKET SNAPSHOT 
    FIGURE 9 NORTH AMERICA LED MARKET IN 2021 
    FIGURE 10 COILED TUBING PRESSURE CONTROL EQUIPMENT TO BE FASTEST-GROWING MARKET, BY TYPE, DURING 2022–2027 
    FIGURE 11 WELLHEAD EQUIPMENT TO ACCOUNT FOR LARGEST SHARE OF MARKET, BY COMPONENT, IN 2022–2027 
    FIGURE 12 HIGH PRESSURE (ABOVE 10,000 PSI) SEGMENT TO HOLD LARGEST MARKET SHARE OF MARKET, BY PRESSURE TYPE, IN 2022–2027 
    FIGURE 13 OFFSHORE APPLICATIONS TO BE FASTEST-GROWING PRESSURE CONTROL EQUIPMENT END USER, BY APPLICATION, DURING FORECAST PERIOD 
    FIGURE 14 RENTAL SALES TYPE TO HOLD LARGEST SHARE OF MARKET, BY SALES TYPE, IN 2027 
 
4 PREMIUM INSIGHTS (Page No. - 59)
    4.1 ATTRACTIVE OPPORTUNITIES FOR PLAYERS IN PRESSURE CONTROL EQUIPMENT MARKET 
           FIGURE 15 INCREASING INVESTMENTS IN OFFSHORE WELL INTERVENTION IN OIL & GAS SECTOR TO DRIVE MARKET
    4.2 PRESSURE CONTROL EQUIPMENT MARKET, BY REGION 
           FIGURE 16 NORTH AMERICA TO BE FASTEST-GROWING PRESSURE EQUIPMENT MARKET DURING FORECAST PERIOD
    4.3 MARKET IN NORTH AMERICA, BY TYPE & COUNTRY 
           FIGURE 17 WIRELINE PRESSURE CONTROL EQUIPMENT AND US DOMINATED GLOBAL MARKET IN 2021
    4.4 MARKET, BY TYPE 
           FIGURE 18 INCREASING DRILLING ACTIVITIES TO CREATE DEMAND FOR WIRELINE PRESSURE CONTROL EQUIPMENT IN 2027
    4.5 MARKET, BY COMPONENT 
           FIGURE 19 WELLHEAD EQUIPMENT TO HOLD LARGEST MARKET SHARE IN 2027
    4.6 MARKET, BY PRESSURE TYPE 
           FIGURE 20 HIGH PRESSURE (ABOVE 10,000 PSI) SEGMENT TO HOLD LARGEST MARKET SHARE, BY PRESSURE TYPE, IN 2027
    4.7 MARKET, BY APPLICATION 
           FIGURE 21 INCREASING INVESTMENTS IN UNCONVENTIONAL RESOURCES TO DRIVE MARKET FOR ONSHORE APPLICATIONS IN 2027
    4.8 MARKET, BY SALES TYPE 
           FIGURE 22 LOW EQUIPMENT COST AND REDUCED CAPITAL COST TO DRIVE MARKET FOR RENTAL SEGMENT, BY SALES TYPE, IN 2027
 
5 MARKET OVERVIEW (Page No. - 63)
    5.1 INTRODUCTION 
    5.2 MARKET DYNAMICS 
           FIGURE 23 PRESSURE CONTROL EQUIPMENT MARKET: DRIVERS, RESTRAINTS, OPPORTUNITIES, AND CHALLENGES
           5.2.1 DRIVERS
                    5.2.1.1 Rising exploration and production of unconventional oil & gas resources
                               FIGURE 24 PROVEN RESERVES OF CRUDE OIL IN US, 2015–2020
                               FIGURE 25 RECOVERABLE SHALE GAS RESOURCES IN US, 2015–2020 (BCF)
                    5.2.1.2 Increasing global oil demand
                               FIGURE 26 GLOBAL OIL DEMAND, 2019–2026 (BCF)
                               TABLE 2 GLOBAL OIL DEMAND (OECD VS. NON-OECD), 2019–2026
           5.2.2 RESTRAINTS
                    5.2.2.1 Decline in capital expenditure of oilfield operators and service providers
                               FIGURE 27 CAPITAL EXPENDITURE OF OIL & GAS SERVICE PROVIDERS, 2016–2021
                    5.2.2.2 Introduction of stringent government regulations on upstream activities
           5.2.3 OPPORTUNITIES
                    5.2.3.1 Growth in oilfield discoveries
                               FIGURE 28 GLOBAL OIL & GAS DISCOVERIES, 2016–2020 (MILLION BOE)
                    5.2.3.2 Emerging offshore opportunities
                               FIGURE 29 GLOBAL OFFSHORE NATURAL GAS PRODUCTION, 2000–2040 (MILLION BCM)
           5.2.4 CHALLENGES
                    5.2.4.1 Transition toward adoption of renewable energy sources
                               FIGURE 30 RENEWABLE NET CAPACITY ADDITION, 2019 – 2021 (MW)
                    5.2.4.2 Lesser success rate of exploration
    5.3 TRENDS/DISRUPTIONS IMPACTING CUSTOMER BUSINESS 
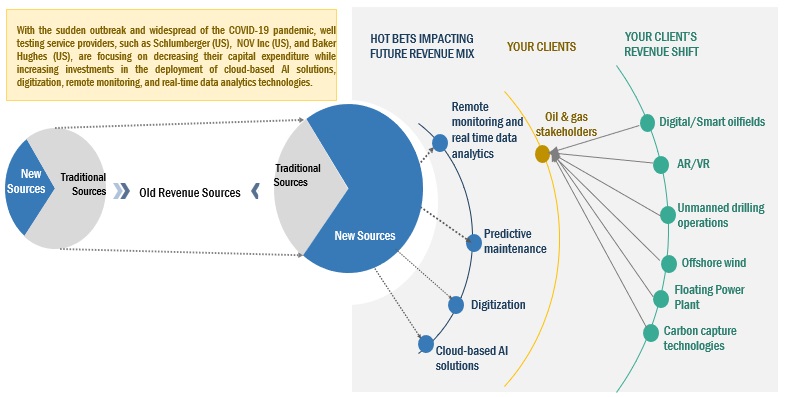
           5.3.1 REVENUE SHIFTS AND NEW REVENUE POCKETS FOR PRESSURE CONTROL EQUIPMENT PROVIDERS
                    FIGURE 31 REVENUE SHIFT FOR PRESSURE CONTROL EQUIPMENT
           5.3.2 MARKET MAP
                    FIGURE 32 MARKET MAP: PRESSURE CONTROL EQUIPMENT IINDUSTRY
           5.3.3 WELL INTERVENTION
           5.3.4 DRILLING SERVICES
           5.3.5 OILFIELD SERVICES
    5.4 SUPPLY CHAIN ANALYSIS 
           FIGURE 33 SUPPLY CHAIN ANALYSIS: MARKET
           TABLE 3 PRESSURE CONTROL EQUIPMENT MARKET: SUPPLY CHAIN
           5.4.1 RAW MATERIAL SUPPLIERS
           5.4.2 PRESSURE CONTROL EQUIPMENT MANUFACTURERS
           5.4.3 PRESSURE CONTROL EQUIPMENT SERVICE PROVIDERS
           5.4.4 OILFIELD OPERATORS
           5.4.5 TRADE DATA
                    FIGURE 34 IMPORT AND EXPORT SCENARIO FOR HS CODE: 843041, 2017–2021 (USD MILLION)
                    TABLE 4 TRADE DATA FOR HS CODE: 843041, 2017–2021 (USD MILLION)
    5.5 KEY CONFERENCES AND EVENTS, 2022–2023 
           TABLE 5 MARKET: LIST OF CONFERENCES AND EVENTS, 2022–2023
    5.6 CODES AND REGULATIONS 
           5.6.1 REGULATORY BODIES, GOVERNMENT AGENCIES, AND OTHER ORGANIZATIONS
                    TABLE 6 GLOBAL: LIST OF REGULATORY BODIES, GOVERNMENT AGENCIES, AND OTHER ORGANIZATIONS
                    TABLE 7 NORTH AMERICA: LIST OF REGULATORY BODIES, GOVERNMENT AGENCIES, AND OTHER ORGANIZATIONS
                    TABLE 8 EUROPE: LIST OF REGULATORY BODIES, GOVERNMENT AGENCIES, AND OTHER ORGANIZATIONS
                    TABLE 9 ASIA PACIFIC: LIST OF REGULATORY BODIES, GOVERNMENT AGENCIES, AND OTHER ORGANIZATIONS
                    TABLE 10 REST OF WORLD: LIST OF REGULATORY BODIES, GOVERNMENT AGENCIES, AND OTHER ORGANIZATIONS
    5.7 PATENT ANALYSIS 
           TABLE 11 PRESSURE CONTROL EQUIPMENT: INNOVATIONS AND PATENT REGISTRATIONS
    5.8 PORTER’S FIVE FORCES ANALYSIS 
           FIGURE 35 PRESSURE CONTROL EQUIPMENT MARKET: PORTER’S FIVE FORCES ANALYSIS
           TABLE 12 MARKET: PORTER’S FIVE FORCES ANALYSIS
           5.8.1 THREAT OF SUBSTITUTES
           5.8.2 BARGAINING POWER OF SUPPLIERS
           5.8.3 BARGAINING POWER OF BUYERS
           5.8.4 THREAT OF NEW ENTRANTS
           5.8.5 INTENSITY OF COMPETITIVE RIVALRY
    5.9 KEY STAKEHOLDERS AND BUYING CRITERIA 
           5.9.1 KEY STAKEHOLDERS IN BUYING PROCESS
                    FIGURE 36 INFLUENCE OF STAKEHOLDERS ON BUYING PROCESS, BY TYPE
                    TABLE 13 INFLUENCE OF STAKEHOLDERS ON BUYING PROCESS, BY END USER (%)
    5.10 BUYING CRITERIA 
           FIGURE 37 KEY BUYING CRITERIA FOR PRESSURE CONTROL EQUIPMENT, BY TYPE
                    TABLE 14 KEY BUYING CRITERIA, BY TYPE
    5.11 AVERAGE SELLING PRICE TREND 
                    FIGURE 38 AVERAGE SELLING PRICE OF DIFFERENT TYPES OF PRESSURE CONTROL EQUIPMENT, BY KEY PLAYERS (USD)
                    TABLE 15 AVERAGE SELLING PRICE OF DIFFERENT TYPES OF PRESSURE CONTROL EQUIPMENT, BY KEY PLAYERS (USD)
    5.12 CASE STUDY ANALYSIS 
           5.12.1 MWD SYSTEM ABLE TO IDENTIFY LOSSES AT EARLY STAGES AND MAINTAIN CONSTANT BOTTOM HOLE PRESSURE
                    5.12.1.1 Problem statement
                    5.12.1.2 Solution
           5.12.2 PERFORMING PRESSURE TEST TO OBTAIN HIGH VOLUME OF SAMPLING DATA DESPITE CHALLENGING GEOLOGICAL CONDITIONS
                    5.12.2.1 Problem statement
                    5.12.2.2 Solution
    5.13 TECHNOLOGY ANALYSIS 
 
6 PRESSURE CONTROL EQUIPMENT MARKET, BY TYPE (Page No. - 88)
    6.1 INTRODUCTION 
           FIGURE 39 MARKET, BY TYPE, 2021
           TABLE 16 PRESSURE CONTROL EQUIPMENT MARKET, BY TYPE, 2020–2027 (USD MILLION)
    6.2 WIRELINE PRESSURE CONTROL EQUIPMENT 
           6.2.1 INCREASE IN DRILLING ACTIVITIES IN SHALE BASINS TO DRIVE MARKET
                    TABLE 17 WIRELINE PRESSURE CONTROL EQUIPMENT: MARKET, BY REGION, 2020–2027 (USD MILLION)
    6.3 COILED TUBING PRESSURE CONTROL EQUIPMENT 
           6.3.1 INCREASE IN HORIZONTAL DRILLING TO CREATE DEMAND FOR PRESSURE CONTROL EQUIPMENT
                    TABLE 18 COILED TUBING PRESSURE CONTROL EQUIPMENT: MARKET, BY REGION, 2020–2027 (USD MILLION)
 
7 PRESSURE CONTROL EQUIPMENT MARKET, BY COMPONENT (Page No. - 92)
    7.1 INTRODUCTION 
           FIGURE 40 MARKET, BY COMPONENT, 2021
           TABLE 19 PRESSURE CONTROL EQUIPMENT MARKET, BY COMPONENT, 2020–2027 (USD MILLION)
    7.2 FLOW CONTROL VALVES 
           7.2.1 KEY PRESSURE CONTROL DEVICES FOR ISOLATION AND THROTTLING FUNCTIONS TO PROPEL MARKET
           7.2.2 PLUG VALVES
           7.2.3 CHECK VALVES
           7.2.4 GATE VALVES
           7.2.5 GLOBE VALVES
           7.2.6 BALL VALVES
                    TABLE 20 FLOW CONTROL VALVES: MARKET, BY REGION, 2020–2027 (USD MILLION)
                    TABLE 21 FLOW CONTROL VALVES: MARKET, BY TYPE, 2020–2027 (USD MILLION)
    7.3 FLOW CONTROL TREATING IRON 
           7.3.1 EXACT SPECIFICATIONS AND RIGOROUS QUALITY STANDARDS TO DRIVE MARKET
           7.3.2 PUP JOINT TREATING IRON
           7.3.3 ELBOWS TREATING IRON
           7.3.4 TEE TREATING IRON
                    TABLE 22 FLOW CONTROL TREATING IRON: MARKET, BY REGION, 2020–2027 (USD MILLION)
                    TABLE 23 FLOW CONTROL TREATING IRON: MARKET, BY TYPE, 2020–2027 (USD MILLION)
    7.4 FLOW CONTROL ADAPTERS & FLANGES 
           7.4.1 NORTH AMERICA TO HOLD LARGEST SHARE OF PRESSURE CONTROL MARKET FOR ADAPTER FLANGES DURING FORECAST PERIOD
                    TABLE 24 FLOW CONTROL ADAPTERS & FLANGES: MARKET, BY REGION, 2020–2027 (USD MILLION)
    7.5 FLOW CONTROL SURFACE CROSSOVERS 
           7.5.1 WIDE APPLICATIONS IN OIL & GAS INDUSTRY TO INCREASE USAGE OF SURFACE CROSSOVERS
                    TABLE 25 FLOW CONTROL SURFACE CROSSOVERS: MARKET, BY REGION, 2020–2027 (USD MILLION)
    7.6 FLOW CONTROL FLEXIBLE HOSES 
           7.6.1 DIFFERENT TYPES OF FLEXIBLE HOSES FOR WELL DRILLING APPLICATIONS TO DRIVE MARKET
                    TABLE 26 FLOW CONTROL FLEXIBLE HOSES: MARKET, BY REGION, 2020–2027 (USD MILLION)
    7.7 WELLHEAD EQUIPMENT 
           7.7.1 WELLHEAD EQUIPMENT TO HOLD LARGEST MARKET SHARE FOR PRESSURE CONTROL EQUIPMENT
           7.7.2 DRILLING BOP WELLHEAD EQUIPMENT
           7.7.3 SURFACE WELLHEAD EQUIPMENT
           7.7.4 FRAC HEAD WELLHEAD EQUIPMENT
           7.7.5 FLOW HEAD WELLHEAD EQUIPMENT
           7.7.6 CEMENT HEAD WELLHEAD EQUIPMENT
                    TABLE 27 WELLHEAD EQUIPMENT: MARKET, BY REGION, 2020–2027 (USD MILLION)
                    TABLE 28 WELLHEAD EQUIPMENT: MARKET, BY TYPE, 2020–2027 (USD MILLION)
    7.8 CONTROL HEADS 
           7.8.1 REDUCED DRILLING COSTS AND INCREASED WELL PRODUCTION TO BOOST MARKET
                    TABLE 29 CONTROL HEADS: MARKET, BY REGION, 2020–2027 (USD MILLION)
    7.9 CHRISTMAS TREES (FLOW TEES) 
           7.9.1 USED TO CONTROL FLOW OF WELL FLUIDS OR GAS DURING PRODUCTION
                    TABLE 30 CHRISTMAS TREES (FLOW TEES): MARKET, BY REGION, 2020–2027 (USD MILLION)
    7.10 QUICK UNIONS 
           7.10.1 MARKET FOR QUICK UNIONS IN AFRICA TO RECORD HIGHEST CAGR DURING FORECAST PERIOD
                    TABLE 31 QUICK UNIONS: MARKET, BY REGION, 2020–2027 (USD MILLION)
    7.11 COILED TUBING WPCE 
           7.11.1 RISE IN USE OF COILED TUBING WPCE IN HIGH-PRESSURE WELLS TO DRIVE MARKET
                    TABLE 32 COILED TUBING WPCE: MARKET, BY REGION, 2020–2027 (USD MILLION)
    7.12 OTHERS 
                    TABLE 33 OTHERS: MARKET, BY REGION, 2020–2027 (USD MILLION)
 
8 PRESSURE CONTROL EQUIPMENT MARKET, BY APPLICATION (Page No. - 105)
    8.1 INTRODUCTION 
           FIGURE 41 MARKET, BY APPLICATION, 2021
           TABLE 34 PRESSURE CONTROL EQUIPMENT MARKET, BY APPLICATION, 2020–2027 (USD MILLION)
    8.2 ONSHORE 
           8.2.1 PRESENCE OF MASSIVE ONSHORE SHALE RESERVES IN DIFFERENT REGIONS TO DRIVE MARKET
                    TABLE 35 ONSHORE: MARKET, BY REGION, 2020–2027 (USD MILLION)
    8.3 OFFSHORE 
           8.3.1 OFFSHORE APPLICATIONS TO WITNESS HIGHER CAGR DURING FORECAST PERIOD
                    TABLE 36 OFFSHORE: MARKET, BY REGION, 2020–2027 (USD MILLION)
 
9 PRESSURE CONTROL EQUIPMENT MARKET, BY SALES TYPE (Page No. - 108)
    9.1 INTRODUCTION 
           FIGURE 42 MARKET, BY SALES TYPE, 2021
           TABLE 37 PRESSURE CONTROL EQUIPMENT MARKET, BY SALES TYPE, 2020–2027 (USD MILLION)
    9.2 NEW PURCHASES 
           9.2.1 EQUIPMENT COST LESS OVER TIME
                    TABLE 38 NEW PURCHASES: MARKET, BY REGION, 2020–2027 (USD MILLION)
    9.3 RENTAL 
           9.3.1 LOWER UP-FRONT COSTS AND NO MAINTENANCE
                    TABLE 39 RENTAL: MARKET, BY REGION, 2020–2027 (USD MILLION)
    9.4 SERVICES 
           9.4.1 BETTER MONITORING AND CONTROL OVER WELL INTERVENTION PROCESSES
                    TABLE 40 SERVICES: MARKET, BY REGION, 2020–2027 (USD MILLION)
    9.5 SPARES 
           9.5.1 AVAILABILITY OF SPARES DURING EQUIPMENT FAILURES CAN SAVE TIME AND COST
                    TABLE 41 SPARES: MARKET, BY REGION, 2020–2027 (USD MILLION)
 
10 PRESSURE CONTROL EQUIPMENT MARKET, BY PRESSURE TYPE (Page No. - 112)
     10.1 INTRODUCTION 
               FIGURE 43 PRESSURE CONTROL EQUIPMENT MARKET, BY PRESSURE TYPE, 2021
               TABLE 42 MARKET, BY PRESSURE TYPE, 2020–2027 (USD MILLION)
     10.2 HIGH PRESSURE (ABOVE 10,000 PSI) 
             10.2.1 CUSTOMIZED PRESSURE EQUIPMENT USED SPECIALLY FOR HIGH-PRESSURE WELL INTERVENTION PROCESSES
                       TABLE 43 HIGH PRESSURE: MARKET, BY REGION, 2020–2027 (USD MILLION)
     10.3 LOW PRESSURE (BELOW 10,000 PSI) 
             10.3.1 NEW LOW-PRESSURE OIL FIELD DEVELOPMENTS IN AFRICAN AND EUROPEAN ECONOMIES
                       TABLE 44 LOW PRESSURE: MARKET, BY REGION, 2020–2027 (USD MILLION)
 
11 PRESSURE CONTROL EQUIPMENT MARKET, BY REGION (Page No. - 116)
     11.1 INTRODUCTION 
               FIGURE 44 MARKET REGIONAL SNAPSHOT
               TABLE 45 MARKET, BY REGION, 2020–2027 (USD MILLION)
               TABLE 46 MARKET, BY REGION: VOLUME, 2020–2027 (THOUSAND UNITS)
     11.2 NORTH AMERICA 
               FIGURE 45 NORTH AMERICA: MARKET SNAPSHOT
             11.2.1 NORTH AMERICA: RECESSION IMPACT
                       TABLE 47 NORTH AMERICA: PRESSURE CONTROL EQUIPMENT MARKET, BY TYPE, 2020–2027 (USD MILLION)
                       TABLE 48 NORTH AMERICA: MARKET, BY COMPONENT, 2020–2027 (USD MILLION)
                       TABLE 49 NORTH AMERICA: MARKET, BY FLOW CONTROL VALVES, 2020–2027 (USD MILLION)
                       TABLE 50 NORTH AMERICA: MARKET, BY FLOW CONTROL TREATING IRON, 2020–2027 (USD MILLION)
                       TABLE 51 NORTH AMERICA: MARKET, BY WELLHEAD EQUIPMENT, 2020–2027 (USD MILLION)
                       TABLE 52 NORTH AMERICA: MARKET, BY APPLICATION, 2020–2027 (USD MILLION)
                       TABLE 53 NORTH AMERICA: MARKET, BY SALES TYPE, 2020–2027 (USD MILLION)
                       TABLE 54 NORTH AMERICA: MARKET, BY NEW PURCHASE, COMPONENT, 2020–2027 (USD MILLION)
                       TABLE 55 NORTH AMERICA: MARKET, BY RENTAL, COMPONENT, 2020–2027 (USD MILLION)
                       TABLE 56 NORTH AMERICA: MARKET, BY SERVICE, COMPONENT, 2020–2027 (USD MILLION)
                       TABLE 57 NORTH AMERICA: MARKET, BY SPARE, COMPONENT, 2020–2027 (USD MILLION)
                       TABLE 58 NORTH AMERICA: MARKET, BY PRESSURE, 2020–2027 (USD MILLION)
             11.2.2 BY COUNTRY
                       TABLE 59 NORTH AMERICA: MARKET, BY COUNTRY, 2020–2027 (USD MILLION)
                       11.2.2.1 US
                                   11.2.2.1.1 Increasing exploration and production of shale and tight oil reserves to drive market
                                   TABLE 60 US: MARKET, BY TYPE, 2020–2027 (USD MILLION)
                                   TABLE 61 US: MARKET, BY APPLICATION, 2020–2027 (USD MILLION)
                       11.2.2.2 Canada
                                   11.2.2.2.1 Increasing oil sands and offshore well exploration and drilling to provide lucrative growth opportunities
                                   TABLE 62 CANADA: MARKET, BY TYPE, 2020–2027 (USD MILLION)
                                   TABLE 63 CANADA: MARKET, BY APPLICATION, 2020–2027 (USD MILLION)
                       11.2.2.3 Mexico
                                   11.2.2.3.1 Development of unconventional shale resources and increasing focus on redeveloping mature fields to propel market
                                   TABLE 64 MEXICO: MARKET, BY TYPE, 2020–2027 (USD MILLION)
                                   TABLE 65 MEXICO: MARKET, BY APPLICATION, 2020–2027 (USD MILLION)
     11.3 ASIA PACIFIC 
               FIGURE 46 ASIA PACIFIC: MARKET SNAPSHOT
               TABLE 66 ASIA PACIFIC: PRESSURE CONTROL EQUIPMENT MARKET, BY TYPE, 2020–2027 (USD MILLION)
               TABLE 67 ASIA PACIFIC: MARKET, BY COMPONENT, 2020–2027 (USD MILLION)
               TABLE 68 ASIA PACIFIC: MARKET, BY FLOW CONTROL VALVES, 2020–2027 (USD MILLION)
               TABLE 69 ASIA PACIFIC: MARKET, BY FLOW CONTROL TREATING IRON, 2020–2027 (USD MILLION)
               TABLE 70 ASIA PACIFIC: MARKET, BY WELLHEAD EQUIPMENT, 2020–2027 (USD MILLION)
               TABLE 71 ASIA PACIFIC: MARKET, BY APPLICATION, 2020–2027 (USD MILLION)
               TABLE 72 ASIA PACIFIC: MARKET, BY SALES TYPE, 2020–2027 (USD MILLION)
               TABLE 73 ASIA PACIFIC: MARKET, BY NEW PURCHASE, COMPONENT, 2020–2027 (USD MILLION)
               TABLE 74 ASIA PACIFIC: MARKET, BY RENTAL, COMPONENT, 2020–2027 (USD MILLION)
               TABLE 75 ASIA PACIFIC: MARKET, BY SERVICE, COMPONENT, 2020–2027 (USD MILLION)
               TABLE 76 ASIA PACIFIC: MARKET, BY SPARE, COMPONENT, 2020–2027 (USD MILLION)
               TABLE 77 ASIA PACIFIC: MARKET, BY PRESSURE, 2020–2027 (USD MILLION)
             11.3.1 BY COUNTRY
                       TABLE 78 ASIA PACIFIC: MARKET, BY COUNTRY, 2020–2027 (USD MILLION)
                       11.3.1.1 China
                                   11.3.1.1.1 Government initiatives to increase oil production from unconventional resources to drive market
                                   TABLE 79 CHINA: MARKET, BY TYPE, 2020–2027 (USD MILLION)
                                   TABLE 80 CHINA: MARKET, BY APPLICATION, 2020–2027 (USD MILLION)
                       11.3.1.2 India
                                   11.3.1.2.1 Redevelopment of legacy oilfields and government initiatives to improve exploration activities to augment market
                                   TABLE 81 INDIA: MARKET, BY TYPE, 2020–2027 (USD MILLION)
                                   TABLE 82 INDIA: MARKET, BY APPLICATION, 2020–2027 (USD MILLION)
                       11.3.1.3 Australia
                                   11.3.1.3.1 Development of unconventional shale resources and rising focus on redeveloping mature fields to create growth opportunities
                                   TABLE 83 AUSTRALIA: MARKET, BY TYPE, 2020–2027 (USD MILLION)
                                   TABLE 84 AUSTRALIA: MARKET, BY APPLICATION, 2020–2027 (USD MILLION)
                       11.3.1.4 Japan
                                   11.3.1.4.1 Japanese LNG projects to drive growth of market
                                   TABLE 85 JAPAN: MARKET, BY TYPE, 2020–2027 (USD MILLION)
                                   TABLE 86 JAPAN: MARKET, BY APPLICATION, 2020–2027 (USD MILLION)
                       11.3.1.5 Indonesia
                                   11.3.1.5.1 Increasing exploration and production activities in offshore regions to propel market
                                   TABLE 87 INDONESIA: MARKET, BY TYPE, 2020–2027 (USD MILLION)
                                   TABLE 88 INDONESIA: MARKET, BY APPLICATION, 2020–2027 (USD MILLION)
                       11.3.1.6 Rest of Asia Pacific
                                   TABLE 89 REST OF ASIA PACIFIC: MARKET, BY TYPE, 2020–2027 (USD MILLION)
                                   TABLE 90 REST OF ASIA PACIFIC: MARKET, BY APPLICATION, 2020–2027 (USD MILLION)
     11.4 MIDDLE EAST & AFRICA 
               TABLE 91 MIDDLE EAST & AFRICA: PRESSURE CONTROL EQUIPMENT MARKET, BY TYPE, 2020–2027 (USD MILLION)
               TABLE 92 MIDDLE EAST & AFRICA: MARKET, BY COMPONENT, 2020–2027 (USD MILLION)
               TABLE 93 MIDDLE EAST & AFRICA: MARKET, BY FLOW CONTROL VALVES, 2020–2027 (USD MILLION)
               TABLE 94 MIDDLE EAST & AFRICA: MARKET, BY FLOW CONTROL TREATING IRON, 2020–2027 (USD MILLION)
               TABLE 95 MIDDLE EAST & AFRICA: MARKET, BY WELLHEAD EQUIPMENT, 2020–2027 (USD MILLION)
               TABLE 96 MIDDLE EAST & AFRICA: MARKET, BY APPLICATION, 2020–2027 (USD MILLION)
               TABLE 97 MIDDLE EAST & AFRICA: MARKET, BY SALES TYPE, 2020–2027 (USD MILLION)
               TABLE 98 MIDDLE EAST & AFRICA: MARKET, BY NEW PURCHASE, COMPONENT, 2020–2027 (USD MILLION)
               TABLE 99 MIDDLE EAST & AFRICA: MARKET, BY RENTAL, COMPONENT, 2020–2027 (USD MILLION)
               TABLE 100 MIDDLE EAST & AFRICA: MARKET, BY SERVICE, COMPONENT, 2020–2027 (USD MILLION)
               TABLE 101 MIDDLE EAST & AFRICA: MARKET, BY SPARE, COMPONENT, 2020–2027 (USD MILLION)
               TABLE 102 MIDDLE EAST & AFRICA: MARKET, BY PRESSURE, 2020–2027 (USD MILLION)
             11.4.1 BY COUNTRY
                       TABLE 103 MIDDLE EAST & AFRICA: MARKET, BY COUNTRY, 2020–2027 (USD MILLION)
                       11.4.1.1 Saudi Arabia
                                   11.4.1.1.1 Increased crude production from onshore fields and surge in offshore exploration to drive market
                                   TABLE 104 SAUDI ARABIA: MARKET, BY TYPE, 2020–2027 (USD MILLION)
                                   TABLE 105 SAUDI ARABIA: MARKET, BY APPLICATION, 2020–2027 (USD MILLION)
                       11.4.1.2 UAE
                                   11.4.1.2.1 Discoveries of unconventional resources to fuel demand for pressure control equipment
                                   TABLE 106 UAE: MARKET, BY TYPE, 2020–2027 (USD MILLION)
                                   TABLE 107 UAE: MARKET, BY APPLICATION, 2020–2027 (USD MILLION)
                       11.4.1.3 South Africa
                                   11.4.1.3.1 Presence of large shale gas reserves in Karoo Basin to drive market
                                   TABLE 108 SOUTH AFRICA: MARKET, BY TYPE, 2020–2027 (USD MILLION)
                                   TABLE 109 SOUTH AFRICA: MARKET, BY APPLICATION, 2020–2027 (USD MILLION)
                       11.4.1.4 Oman
                                   11.4.1.4.1 Rise in upstream activities corresponding to exploration and production of total oil reserves expected to increase demand
                                   TABLE 110 OMAN: MARKET, BY TYPE, 2020–2027 (USD MILLION)
                                   TABLE 111 OMAN: MARKET, BY APPLICATION, 2020–2027 (USD MILLION)
                       11.4.1.5 Kuwait
                                   11.4.1.5.1 Upcoming and recent investments in oilfields likely to boost market growth
                                   TABLE 112 KUWAIT: MARKET, BY TYPE, 2020–2027 (USD MILLION)
                                   TABLE 113 KUWAIT: MARKET, BY APPLICATION, 2020–2027 (USD MILLION)
                       11.4.1.6 Algeria
                                   11.4.1.6.1 Initiatives proposed and executed by upstream oilfield operators to drive demand for pressure control equipment
                                   TABLE 114 ALGERIA: MARKET, BY TYPE, 2020–2027 (USD MILLION)
                                   TABLE 115 ALGERIA: MARKET, BY APPLICATION, 2020–2027 (USD MILLION)
                       11.4.1.7 Nigeria
                                   11.4.1.7.1 Rise in exploration activities and developments in mature oil and gas fields to boost market growth
                                   TABLE 116 NIGERIA: MARKET, BY TYPE, 2020–2027 (USD MILLION)
                                   TABLE 117 NIGERIA: MARKET, BY APPLICATION, 2020–2027 (USD MILLION)
                       11.4.1.8 Egypt
                                   11.4.1.8.1 Upcoming and recent investments in oilfields likely to propel market growth
                                   TABLE 118 EGYPT: MARKET, BY TYPE, 2020–2027 (USD MILLION)
                                   TABLE 119 EGYPT: MARKET, BY APPLICATION, 2020–2027 (USD MILLION)
                       11.4.1.9 Rest of Middle East &Africa
                                   TABLE 120 REST OF MIDDLE EAST & AFRICA: MARKET, BY TYPE, 2020–2027 (USD MILLION)
                                   TABLE 121 REST OF MIDDLE EAST & AFRICA: MARKET, BY APPLICATION, 2020–2027 (USD MILLION)
     11.5 EUROPE 
               TABLE 122 EUROPE: PRESSURE CONTROL EQUIPMENT MARKET, BY TYPE, 2020–2027 (USD MILLION)
               TABLE 123 EUROPE: MARKET, BY COMPONENT, 2020–2027 (USD MILLION)
               TABLE 124 EUROPE: MARKET, BY FLOW CONTROL VALVES, 2020–2027 (USD MILLION)
               TABLE 125 EUROPE: MARKET, BY FLOW CONTROL TREATING IRON, 2020–2027 (USD MILLION)
               TABLE 126 EUROPE: MARKET, BY WELLHEAD EQUIPMENT, 2020–2027 (USD MILLION)
               TABLE 127 EUROPE: MARKET, BY APPLICATION, 2020–2027 (USD MILLION)
               TABLE 128 EUROPE: MARKET, BY SALES TYPE, 2020–2027 (USD MILLION)
               TABLE 129 EUROPE: MARKET, BY NEW PURCHASE, COMPONENT, 2020–2027 (USD MILLION)
               TABLE 130 EUROPE: MARKET, BY RENTAL, COMPONENT, 2020–2027 (USD MILLION)
               TABLE 131 EUROPE: MARKET, BY SERVICE, COMPONENT, 2020–2027 (USD MILLION)
               TABLE 132 EUROPE: MARKET, BY SPARE, COMPONENT, 2020–2027 (USD MILLION)
               TABLE 133 EUROPE: MARKET, BY PRESSURE, 2020–2027 (USD MILLION)
             11.5.1 BY COUNTRY
                       TABLE 134 EUROPE: MARKET, BY COUNTRY, 2020–2027 (USD MILLION)
                       11.5.1.1 UK
                                   11.5.1.1.1 Rising focus on increasing production from mature fields to drive market
                                   TABLE 135 UK: MARKET, BY TYPE, 2020–2027 (USD MILLION)
                                   TABLE 136 UK: MARKET, BY APPLICATION, 2020–2027 (USD MILLION)
                       11.5.1.2 Russia
                                   11.5.1.2.1 Increasing exploration and production activities in Russia’s Far East region to boost market
                                   TABLE 137 RUSSIA: MARKET, BY TYPE, 2020–2027 (USD MILLION)
                                   TABLE 138 RUSSIA: MARKET, BY APPLICATION, 2020–2027 (USD MILLION)
                       11.5.1.3 Germany
                                   11.5.1.3.1 New discoveries and upstream operations to drive market
                                   TABLE 139 GERMANY: MARKET, BY TYPE, 2020–2027 (USD MILLION)
                                   TABLE 140 GERMANY: MARKET, BY APPLICATION, 2020–2027 (USD MILLION)
                       11.5.1.4 Norway
                                   11.5.1.4.1 Rapidly declining production from mature oil & gas fields and increase in exploration activities to fuel demand
                                   TABLE 141 NORWAY: MARKET, BY TYPE, 2020–2027 (USD MILLION)
                                   TABLE 142 NORWAY: MARKET, BY APPLICATION, 2020–2027 (USD MILLION)
                       11.5.1.5 Rest of Europe
                                   TABLE 143 REST OF EUROPE: MARKET, BY TYPE, 2020–2027 (USD MILLION)
                                   TABLE 144 REST OF EUROPE: MARKET, BY APPLICATION, 2020–2027 (USD MILLION)
     11.6 SOUTH AMERICA 
               TABLE 145 SOUTH AMERICA: PRESSURE CONTROL EQUIPMENT MARKET, BY TYPE, 2020–2027 (USD MILLION)
               TABLE 146 SOUTH AMERICA: MARKET, BY COMPONENT, 2020–2027 (USD MILLION)
               TABLE 147 SOUTH AMERICA: MARKET, BY FLOW CONTROL VALVES, 2020–2027 (USD MILLION)
               TABLE 148 SOUTH AMERICA: MARKET, BY FLOW CONTROL TREATING IRON, 2020–2027 (USD MILLION)
               TABLE 149 SOUTH AMERICA: MARKET, BY WELLHEAD EQUIPMENT, 2020–2027 (USD MILLION)
               TABLE 150 SOUTH AMERICA: MARKET, BY APPLICATION, 2020–2027 (USD MILLION)
               TABLE 151 SOUTH AMERICA: MARKET, BY SALES TYPE, 2020–2027 (USD MILLION)
               TABLE 152 SOUTH AMERICA: MARKET, BY NEW PURCHASE, COMPONENT, 2020–2027 (USD MILLION)
               TABLE 153 SOUTH AMERICA: MARKET, BY RENTAL, COMPONENT, 2020–2027 (USD MILLION)
               TABLE 154 SOUTH AMERICA: MARKET, BY SERVICE, COMPONENT, 2020–2027 (USD MILLION)
               TABLE 155 SOUTH AMERICA: MARKET, BY SPARE, COMPONENT, 2020–2027 (USD MILLION)
               TABLE 156 SOUTH AMERICA: MARKET, BY PRESSURE, 2020–2027 (USD MILLION)
             11.6.1 BY COUNTRY
                       TABLE 157 SOUTH AMERICA: MARKET, BY COUNTRY, 2020–2027 (USD MILLION)
                       11.6.1.1 Brazil
                                   11.6.1.1.1 Increasing offshore exploration and production activities to boost market growth
                                   TABLE 158 BRAZIL: MARKET, BY TYPE, 2020–2027 (USD MILLION)
                                   TABLE 159 BRAZIL: MARKET, BY APPLICATION, 2020–2027 (USD MILLION)
                       11.6.1.2 Argentina
                                   11.6.1.2.1 Shale developments to create high demand for pressure control equipment in Argentina
                                   TABLE 160 ARGENTINA: MARKET, BY TYPE, 2020–2027 (USD MILLION)
                                   TABLE 161 ARGENTINA: MARKET, BY APPLICATION, 2020–2027 (USD MILLION)
                       11.6.1.3 Venezuela
                                   11.6.1.3.1 Lucrative government laws for exploration and production activities to boost market
                                   TABLE 162 VENEZUELA: MARKET, BY TYPE, 2020–2027 (USD MILLION)
                                   TABLE 163 VENEZUELA: MARKET, BY APPLICATION, 2020–2027 (USD MILLION)
                       11.6.1.4 Rest of South America
                                   TABLE 164 REST OF SOUTH AMERICA: MARKET, BY TYPE, 2020–2027 (USD MILLION)
                                   TABLE 165 REST OF SOUTH AMERICA: MARKET, BY APPLICATION, 2020–2027 (USD MILLION)
 
12 COMPETITIVE LANDSCAPE (Page No. - 176)
     12.1 KEY PLAYERS’ STRATEGIES 
               TABLE 166 OVERVIEW OF KEY STRATEGIES ADOPTED BY TOP PLAYERS, 2018–2022
     12.2 MARKET SHARE ANALYSIS OF TOP 5 PLAYERS 
               TABLE 167 PRESSURE CONTROL EQUIPMENT MARKET: DEGREE OF COMPETITION
               FIGURE 47 MARKET SHARE ANALYSIS, 2021
     12.3 REVENUE ANALYSIS OF TOP 5 MARKET PLAYERS 
               FIGURE 48 TOP PLAYERS IN MARKET FROM 2017 TO 2021
     12.4 COMPANY EVALUATION QUADRANT 
             12.4.1 STARS
             12.4.2 PERVASIVE PLAYERS
             12.4.3 EMERGING LEADERS
             12.4.4 PARTICIPANTS
                       FIGURE 49 MARKET (GLOBAL) COMPANY EVALUATION MATRIX, 2021
     12.5 START-UP/SME EVALUATION QUADRANT, 2021 
             12.5.1 PROGRESSIVE COMPANIES
             12.5.2 RESPONSIVE COMPANIES
             12.5.3 DYNAMIC COMPANIES
             12.5.4 STARTING BLOCKS
                       FIGURE 50 MARKET: START-UP/SME EVALUATION QUADRANT, 2021
     12.6 COMPETITIVE BENCHMARKING 
               TABLE 168 MARKET: DETAILED LIST OF KEY START-UPS/SMES
               TABLE 169 MARKET: COMPETITIVE BENCHMARKING OF KEY START-UPS/SMES
     12.7 PRESSURE CONTROL EQUIPMENT MARKET: COMPANY FOOTPRINT 
               TABLE 170 BY TYPE: COMPANY FOOTPRINT
               TABLE 171 BY APPLICATION: COMPANY FOOTPRINT
               TABLE 172 BY COMPONENT: COMPANY FOOTPRINT
               TABLE 173 BY SALES TYPE: COMPANY FOOTPRINT
               TABLE 174 BY PRESSURE: COMPANY FOOTPRINT
               TABLE 175 BY REGION: COMPANY FOOTPRINT
               TABLE 176 COMPANY FOOTPRINT
     12.8 COMPETITIVE SCENARIO 
               TABLE 177 PRESSURE CONTROL EQUIPMENT MARKET: PRODUCT LAUNCHES, JANUARY 2019–OCTOBER 2022
               TABLE 178 MARKET: DEALS, JANUARY 2019–OCTOBER 2022
               TABLE 179 MARKET: OTHERS, JANUARY 2019–OCTOBER 2022
 
13 COMPANY PROFILES (Page No. - 196)
(Business and financial overview, Products/Services/Solutions offered, Recent Developments, MNM view)*
     13.1 KEY PLAYERS 
             13.1.1 SLB
                       TABLE 180 SLB: COMPANY OVERVIEW
                       FIGURE 51 SLB: COMPANY SNAPSHOT, 2021
                       TABLE 181 SLB: PRODUCTS/SERVICES/SOLUTIONS OFFERED
                       TABLE 182 SLB: DEALS
                       TABLE 183 SLB: OTHERS
             13.1.2 WEATHERFORD
                       TABLE 184 WEATHERFORD: COMPANY OVERVIEW
                       FIGURE 52 WEATHERFORD: COMPANY SNAPSHOT, 2021
                       TABLE 185 WEATHERFORD: PRODUCTS/SERVICES/SOLUTIONS OFFERED
                       TABLE 186 WEATHERFORD: PRODUCT LAUNCHES
                       TABLE 187 WEATHERFORD: OTHERS
             13.1.3 NOV INC
                       TABLE 188 NOV INC: COMPANY OVERVIEW
                       FIGURE 53 NOV INC: COMPANY SNAPSHOT, 2021
                       TABLE 189 NOV INC: PRODUCTS/SERVICES/SOLUTIONS OFFERED
                       TABLE 190 NOV INC: DEALS
             13.1.4 BAKER HUGHES COMPANY
                       TABLE 191 BAKER HUGHES COMPANY: COMPANY OVERVIEW
                       FIGURE 54 BAKER HUGHES COMPANY: COMPANY SNAPSHOT, 2021
                       TABLE 192 BAKER HUGHES COMPANY: PRODUCTS/SERVICES/SOLUTIONS OFFERED
                       TABLE 193 BAKER HUGHES COMPANY: PRODUCT LAUNCHES
                       TABLE 194 BAKER HUGHES COMPANY: DEALS
                       TABLE 195 BAKER HUGHES COMPANY: OTHERS
             13.1.5 THE WEIR GROUP PLC
                       TABLE 196 THE WEIR GROUP PLC: COMPANY OVERVIEW
                       FIGURE 55 THE WEIR GROUP PLC: COMPANY SNAPSHOT, 2021
                       TABLE 197 THE WEIR GROUP PLC: PRODUCTS/SERVICES/SOLUTIONS OFFERED
                       TABLE 198 THE WEIR GROUP PLC: PRODUCT LAUNCHES
                       TABLE 199 THE WEIR GROUP PLC: OTHERS
             13.1.6 HUNTING
                       TABLE 200 HUNTING: COMPANY OVERVIEW
                       FIGURE 56 HUNTING: COMPANY SNAPSHOT, 2021
                       TABLE 201 HUNTING: PRODUCTS/SERVICES/SOLUTIONS OFFERED
            TABLE 202 HUNTING: DEALS
             13.1.7 EMERSON ELECTRIC CO.
                       TABLE 203 EMERSON ELECTRIC CO.: COMPANY OVERVIEW
                       FIGURE 57 EMERSON ELECTRIC CO.: COMPANY SNAPSHOT, 2021
                       TABLE 204 EMERSON ELECTRIC CO.: PRODUCTS/SERVICES/SOLUTIONS OFFERED
                       TABLE 205 EMERSON ELECTRIC CO.: PRODUCT LAUNCHES
                       TABLE 206 EMERSON ELECTRIC CO.: DEALS
                       TABLE 207 EMERSON ELECTRIC CO.: OTHERS
             13.1.8 FLOWSERVE
                       TABLE 208 FLOWSERVE: COMPANY OVERVIEW
                       FIGURE 58 FLOWSERVE: COMPANY SNAPSHOT, 2021
                       TABLE 209 FLOWSERVE: PRODUCTS/SERVICES/SOLUTIONS OFFERED
                       TABLE 210 FLOWSERVE.: DEALS
                       TABLE 211 FLOWSERVE: OTHERS
             13.1.9 IKM PRESSURE CONTROL AS
                       TABLE 212 IKM PRESSURE CONTROL AS: COMPANY OVERVIEW
                       TABLE 213 IKM PRESSURE CONTROL AS: PRODUCTS/SERVICES/SOLUTIONS OFFERED
                       TABLE 214 IKM PRESSURE CONTROL AS: DEALS
                       TABLE 215 IKM PRESSURE CONTROL AS: OTHERS
             13.1.10 CONTROL FLOW
                       TABLE 216 CONTROL FLOW: COMPANY OVERVIEW
                       TABLE 217 CONTROL FLOW: PRODUCTS/SERVICES/SOLUTIONS OFFERED
                       TABLE 218 CONTROL FLOW: PRODUCT LAUNCHES
     13.2 OTHER PLAYERS 
             13.2.1 BRACE TOOL
             13.2.2 SUNNDA CORPORATION
             13.2.3 GKD INDUSTRIES LTD.
             13.2.4 TIS MANUFACTURING
             13.2.5 NXL TECHNOLOGIES
     13.3 FHE 
             13.3.1 IOT GROUP
             13.3.2 INTEGRATED EQUIPMENT
     13.4 OMEGA PRESSURE CONTROL EQUIPMENT 
             13.4.1 ALLIED VALVE INC
*Details on Business and financial overview, Products/Services/Solutions offered, Recent Developments, MNM view might not be captured in case of unlisted companies.
 
14 APPENDIX (Page No. - 246)
     14.1 INSIGHTS OF INDUSTRY EXPERTS 
     14.2 DISCUSSION GUIDE 
     14.3 KNOWLEDGESTORE: MARKETSANDMARKETS’ SUBSCRIPTION PORTAL 
     14.4 CUSTOMIZATION OPTIONS 
     14.5 RELATED REPORTS 
     14.6 AUTHOR DETAILS 

The study involved major activities in estimating the current size of the pressure control equipments market. Exhaustive secondary research was done to collect information on the peer and parent markets. The next step was to validate these findings, assumptions, and sizing with industry experts across the value chain through primary research. Both top-down and bottom-up approaches were employed to estimate the complete market size. Thereafter, market breakdown and data triangulation were used to estimate the market size of the segments and subsegments.

Secondary Research

This research study on the pressure control equipments market involved the use of extensive secondary sources, directories, and databases, such as Hoovers, Bloomberg, Businessweek, Factiva, International Energy Agency, and BP Statistical Review of World Energy, to identify and collect information useful for a technical, market-oriented, and commercial study of the pressure control equipments market. The other secondary sources included annual reports, press releases & investor presentations of companies, white papers, certified publications, articles by recognized authors, manufacturer associations, trade directories, and databases.

Primary Research

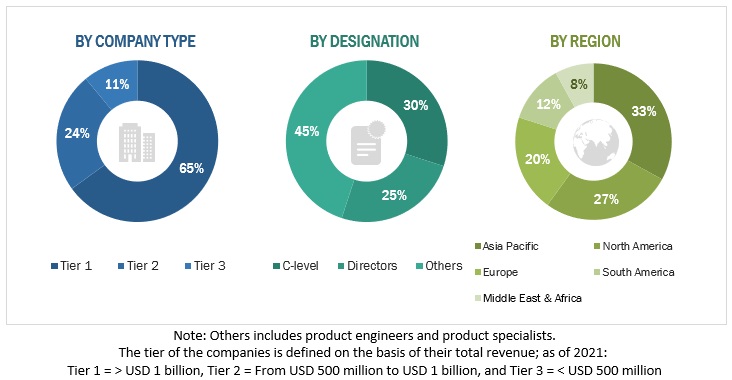
The pressure control equipment market comprises several stakeholders such as pressure control equipment manufacturers, manufacturing technology providers, and technical support providers in the supply chain. The demand side of this market is characterized by the rising demand for pressure control equipment in, oil & gas, and other end-user industries. The supply side is characterized by rising demand for contracts from the industrial sector, and mergers & acquisitions among big players. Various primary sources from both the supply and demand sides of the market were interviewed to obtain qualitative and quantitative information. Following is the breakdown of primary respondents:
Pressure Control Equipment Market Size, and Share

To know about the assumptions considered for the study, download the pdf brochure

Market Size Estimation

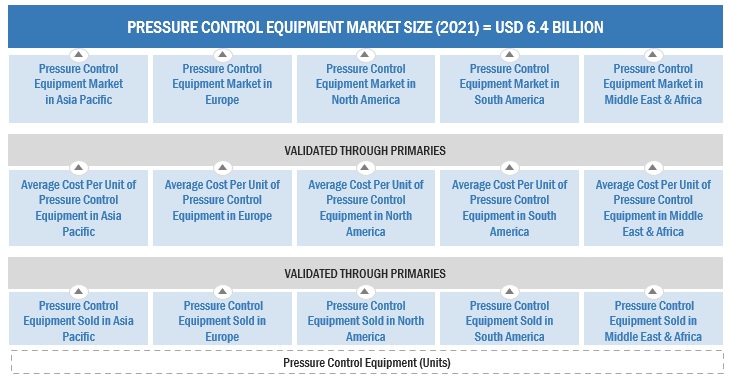
Both top-down and bottom-up approaches were used to estimate and validate the total size of the market. These methods were also used extensively to estimate the size of various subsegments in the market. The research methodology used to estimate the market size includes the following:

  • The key players in the industry and market have been identified through extensive secondary research, and their market share in the respective regions have been determined through both primary and secondary research.
  • The industry’s value chain and market size, in terms of value, have been determined through primary and secondary research processes.
  • All percentage shares, splits, and breakdowns have been determined using secondary sources and verified through primary sources.

Pressure control equipment Market Size: Bottom-Up Approach
Pressure Control Equipment Market Size, and Share

To know about the assumptions considered for the study, Request for Free Sample Report

Data Triangulation

After arriving at the overall market size from the estimation process explained above, the total market has been split into several segments and subsegments. To complete the overall market engineering process and arrive at the exact statistics for all the segments and subsegments, the data triangulation and market breakdown processes have been employed, wherever applicable. The data has been triangulated by studying various factors and trends from both the demand- and supply sides. Along with this, the market has been validated using both the top-down and bottom-up approaches.

Objectives of the Study

  • To define, describe, segment, and forecast the pressure control equipment market, by type, component, sales type, application, pressure, and region, in terms of value and volume. 
  • To provide detailed information on the drivers, restraints, opportunities, and industry-specific challenges influencing the growth of the market
  • To strategically analyze the market with respect to individual growth trends, future expansions, and contributions of each segment to the market
  • To analyze market opportunities for stakeholders and details of the competitive landscape for market leaders
  • To forecast the growth of the market with respect to six main regions, namely, North America, Europe, South America, Asia Pacific, Middle East, and Africa
  • To profile and rank key players and comprehensively analyze their respective market share
  • To analyze competitive developments such as contracts & agreements, investments & expansions, product launches, and mergers & acquisitions in the pressure control equipment market

Available Customizations:

With the given market data, MarketsandMarkets offers customizations according to the company’s specific needs. The following customization options are available for the report:

Product Analysis

  • Product Matrix, which provides a detailed comparison of the product portfolio of each company

Company Information

  • Detailed analyses and profiling of additional market players
Custom Market Research Services

We will customize the research for you, in case the report listed above does not meet with your exact requirements. Our custom research will comprehensively cover the business information you require to help you arrive at strategic and profitable business decisions.

Request Customization

Instant Answers with GPT - Ask Now!

Ask real questions. Get complete answers !
Report Code
EP 6826
Published ON
Jan, 2023
Choose License Type
BUY NOW
  • SHARE
X
Request Customization
Speak to Analyst
Speak to Analyst
OR FACE-TO-FACE MEETING
PERSONALIZE THIS RESEARCH
  • Triangulate with your Own Data
  • Get Data as per your Format and Definition
  • Gain a Deeper Dive on a Specific Application, Geography, Customer or Competitor
  • Any level of Personalization
REQUEST A FREE CUSTOMIZATION
LET US HELP YOU!
  • What are the Known and Unknown Adjacencies Impacting the Pressure Control Equipment Market
  • What will your New Revenue Sources be?
  • Who will be your Top Customer; what will make them switch?
  • Defend your Market Share or Win Competitors
  • Get a Scorecard for Target Partners
CUSTOMIZED WORKSHOP REQUEST
knowledgestore logo

Want to explore hidden markets that can drive new revenue in Pressure Control Equipment Market?

Find Hidden Markets
  • Call Us
  • +1-888-600-6441 (Corporate office hours)
  • +1-888-600-6441 (US/Can toll free)
  • +44-800-368-9399 (UK office hours)
CONNECT WITH US
ABOUT TRUST ONLINE
©2024 MarketsandMarkets Research Private Ltd. All rights reserved
DMCA.com Protection Status
Website Feedback