Precision Planting Market Size, Share & Growth

Precision Planting Market Size, Share, Statistics and Industry Growth Analysis Report by Offering (Hardware, Software, Services), System Type (High-Speed Planters, Precision Air Seeders, Drones), Drive Type (Electric Drive, Hydraulic Drive), Application, Farm Size and Region - Global Growth Driver and Industry Forecast to 2027

Report Code: SE 7706 Dec, 2022, by marketsandmarkets.com

Updated on : October 22, 2024

The precision planting market is experiencing robust growth, fueled by increasing demand for efficient agricultural practices and the need to enhance crop yields. As farmers seek to optimize resource use and minimize waste, precision planting technologies—such as GPS-guided equipment and advanced seed placement systems—are becoming essential. Key trends in this market include the integration of data analytics and machine learning, which allow for real-time monitoring and decision-making, ensuring optimal planting conditions. Additionally, the rise of sustainable farming practices is driving the adoption of precision planting solutions, as they contribute to more environmentally friendly agriculture

Precision Planting Market Size

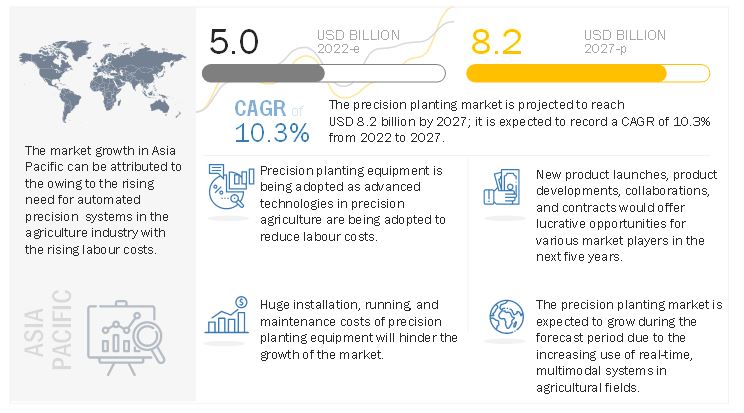
The global precision planting market size is estimated to be USD 5.0 billion in 2022 and is projected to reach USD 8.2 billion by 2027, growing at a CAGR of 10.3% from 2022 to 2027

Some of the major factors contributing to the growth of precision planting market includes the substantial cost-savings associated with precision planting and seeding equipment, surge in the adoption of advanced technologies in precision agriculture to reduce labour cost, and increasing promotion of precision planting techniques by governments worldwide. Moreover, climate change and need to meet rising demand for food will also drive the growth of the industry in the near future.
Precision Planting Market

Precision Planting Market Forecast to 2027

To know about the assumptions considered for the study, Request for Free Sample Report

Precision Planting Market Growth Opportunities

The precision planting market offers significant growth opportunities driven by the increasing adoption of advanced technologies in precision agriculture. Key drivers include the substantial cost savings associated with precision planting and seeding equipment, the surge in labor cost reduction, and the growing emphasis on sustainable farming practices. Additionally, the need to meet rising food demand and the impact of climate change on agricultural productivity are fostering the industry's growth.

Precision Planting Market Trends

The precision planting market is witnessing significant trends that are driving its growth. One of the key trends is the increasing adoption of advanced technologies such as GPS, sensors, and automation, which are enhancing crop productivity, optimizing resource utilization, and improving environmental sustainability. Additionally, the trend towards larger farm sizes and increased mechanization is driving demand for precision planting technology among large-scale farming operations in developed regions like North America, where the market is expected to expand at a notable growth rate through 2032.

Precision Planting Market Dynamics:

Driver: Substantial cost-savings associated with precision planting and seeding equipment

Precision planting and seeding equipment, when used to their maximum potential, can ensure high returns in agribusiness. Planting and seeding equipment offer precision, which assists in ensuring accurate depth of sowing and equidistant arrangement of seeds. The launch of precision planting and seeding equipment with advanced features such as smart connector systems, controllers, and liquid control and delivery systems has also assisted in boosting the adoption of these equipment. Precision planting and seeding equipment help farmers obtain uniformity of seeds and ensure control over the depth of seed placements. They also safeguard crops from natural disasters by collecting real-time geospatial data pertaining to soil crop yield, weather conditions, and plant conditions, along with other inter- and intra-field information. Precision planting and seeding equipment also ensure the efficient use of seeds, fertilizers, nutrients, herbicides, and pesticides, thereby reducing the wastage of valuable resources. Precision planting and seeding equipment also involve the use of mapping software, variable rate technology (VRT), smart sensors, yield mapping, and other techniques that help increase crop yield and enhance land fertility and profitability. Additionally, precision planting and seeding equipment help reduce energy and fuel consumption by utilizing satellite guidance technologies, such as GPS or GIS, in navigation applications.

Restraint: The cost of purchase, operation, and maintenance is high

Precision planting equipment is expensive, which is a major constraint on the market. GPS, drones, GIS, VRT, and satellite devices, as well as skilled personnel, are all used during precision planting, which incurs additional running and maintenance costs. It costs more to run a precision planter per acre than to seed with an air seeder or to drill with an opener drill. To handle precision planting equipment efficiently, farmers or growers need technical knowledge. The poor farmers in developing countries such as India, China, and Brazil, therefore, do not use these tools and techniques.

Opportunities: Integration of smartphone applications with precision planting equipment

Presently, around 3.8 billion people in the world use smartphones, which is 48% of the global population. China, India, and the US are the countries with the highest number of smartphone users. Smartphones comprise multiple user-friendly applications that help them ease their day-to-day work. Similarly, they are helping farmers by providing information about weather and climate conditions to enable quick and effective decision-making. Most agriculture-based companies are nowadays developing mobile-based applications for farmers to make their work easier. These smartphone applications are linked to hardware, such as sensors, GPS receivers, and cameras to collect images, samples, and field data. Furthermore, they are connected to software to display the collected data and help farmers in quick decision-making. Mobile-based applications are helping farmers to save time and money. Farmers are using smartphones for routine day-to-day tasks, such as checking watering equipment, identifying weeds and pests, and checking the prices of commodities.

Challenge: Unavailability of single platform for integration of farm data

Various interfaces, technologies, and protocols are used in precision planting equipment. Data representation is hindered by the lack of technological standardization and the difficulty of integrating systems. In order for the precision planting market to grow, data integration on a single platform is a major challenge. A high volume of relevant data is regularly generated by precision planting from a variety of sources. The majority of these data relate to mapping, variable rate seeding, soil testing, weather change, yield monitoring, and historical crop rotation. Precision planting relies entirely on this data for assessing farm conditions and making decisions, so it must be properly integrated into a single platform.

The majority of equipment manufacturers use proprietary interfaces and communication protocols, making their devices incompatible with each other. In order to maximize yields, these brands must work together to develop systems that are compatible with each other. As a result, agriculturists and farmers face challenges receiving different equipment from different brands, integrating them, and building smart planting systems. In turn, this challenges the growth of precision planting.

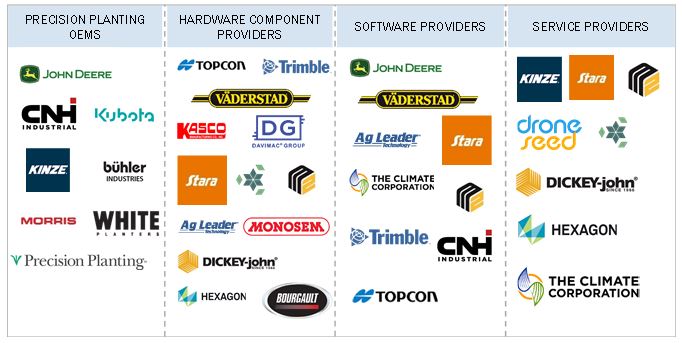
Precision Planting Market Ecosystem
Precision Planting Market Size, and Ecosystem

Precision Planting Market Segmentation:

By System Segment, High-speed precision planting systems to led the precision planting market during the forecast period

Precision planting market share will continue to be dominated by high-speed precision planting systems in 2022 and similar trend is expected to be continued by 2027. Farmers are becoming more aware of the benefits of using these planting systems as well as the high return on investment (ROI). With GPS-based auto-guidance planters, growers can reduce seed overlap during the planting process, thereby reducing input costs substantially.

By Offering, Hardware segment to account for largest market share of precision planting market during the forecast period

Precision planting market share is expected to remain high in the hardware segment until 2027. Increasing adoption of automation and control devices, such as drones/unmanned aerial vehicles (UAV), GPS devices, control systems, guidance systems, delivery systems, and display systems, has contributed to the growth of this segment. Planters use hardware such as delivery systems, control systems, seed meters, sensors, and GPS devices to ensure accurate seed placement and uniform seed distribution. Agricultural vehicles use GPS-based auto-guidance technology to reduce overlapping during field mapping, which in turn saves fuel, labor, and time, and compacts soil. Precision planting hardware market growth is expected to be driven by the increasing adoption of advanced planting and seeding equipment with new features such as VRT and guidance systems for precision planting.

By drive type segment, precision planting market is expected to see higher growth rate for the electric drive segment during the forecast period

The electric drive makes precision planter and seeding systems simpler. Farmers for whom corn is a secondary crop say the cost of a new planter forces them to keep fixing, modifying, and upgrading the older unit. By using electric motors, farmers or growers are able to control individual row units at a variable rate. As energy consumption on farm equipment increases, they have a clear advantage over mechanical, hydraulic, and pneumatic components. The power delivery of an electric motor is consistent and uniform. The regulation of electricity is more precise than any other power source. As a result, seed placement functions in planters and drills are more accurate. With electric drive metering, hydraulic requirements such as chains, sprockets, and gears are eliminated. With fewer parts, the metering system will be simpler. These systems also eliminate frequent maintenance, as there are no drive chains, ground wheels, shafts, clutches, and sprockets. An electric drive powers a shaft that turns a seeding meter. The electric motor can be controlled over ISO-compatible systems and offer farmers row shutoff capability. Electric drives are majorly used to simulate row crop seeds. Electric drives have fewer moving parts and can potentially respond more quickly than other drive mechanisms. In most precision planters, electric drives replace hydraulic drives. Electric drive seed meters are largely used for seed rate control and on rough fields where planter performance is hampered due to high speed. The speed of seeding of electric drive systems is almost double that of mechanical/hydraulic drive systems. Deere & Company (US), and Precision Planting (brand of AGCO) (US) are among the key players that offer precision planters and seeders with electric drive.

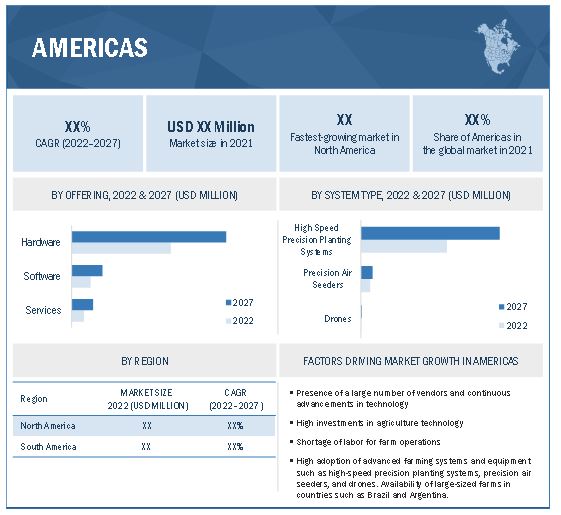
By Region, North America is expected to lead the precision planting market share during the forecast period.
Precision Planting Market Size, and Share

Precision Planting Market by Region

To know about the assumptions considered for the study, download the pdf brochure

The Americas is segmented into North America and South America. North America is expected to account for the largest share of the precision planting market during the forecast period, owing to the presence of a substantial number of large-sized farms and major players, such as Deere & Company (US), Precision Planting (brand of AGCO) (US), Kinze Manufacturing Inc. (US), and Topcon Positioning Systems (US) in this region. These companies have contributed to the growth of the precision planting market by launching innovative products and services, and extensively investing in the R&D of precision planting technologies. Further, countries in this region, such as the US and Canada, are the early adopters of precision planting technologies since these countries have a large number of progressive farmers with bigger farms. South America plays a significant role in the global trade of agricultural products, especially in terms of exports. The region is a net exporter of important agricultural commodities, accounting for 18% of the total global agricultural and food exports.

Precision Planting Companies - Key Market Players

Deere & Company (US), Trimble Inc. (US), CNH Industrial N.V. (UK), Kinze Manufacturing, Inc. (US), and Precision Planting (brand of AGCO) (US) are among the major players in the precision planting companies.

Precision Planting Market Report Scope

Report Metric

Details

Market Size Availability for Years

2018–2027

Base Year

2021

Forecast Period

2022–2027

Forecast Units

Value (USD Billion)

Segments Covered

By Offering, System Type, Drive Type, Farm Size, Application, and Region

Geographies Covered

Americas, Europe, Asia Pacific, and RoW

Companies Covered

The major players include are Deere & Company (US), Trimble Inc. (US), CNH Industrial N.V. (UK), Kinze Manufacturing, Inc. (US), and Precision Planting (brand of AGCO) (US). Other players include Topcon Positioning Systems, Inc. (US), Buhler Industries Inc. (CA), Vaderstad Industries Inc. (CA), Stara S/A (Brazil), and Kasco Manufacturing Inc. (US).
A total of 25 players are covered.

Precision Planting Market Highlights

This research report categorizes the precision planting market, by offering, system type, drive type, farm size, application, and region available at the regional and global level

Aspect

Details

Based on Offering:

  • Hardware
    • Automation and Control
    • Sensing and Monitoring
  • Software
    • SaaS
    • PaaS
  • Services
    • System Integration & Consulting
    • Managed Services
    • Connected Services
    • Assisted Professional Services

Based on System Type:

  • High-Speed Precision Planting Systems
  • Precision Air Seeders
  • Drones

Based on Drive Type:

  • Electric Drive
  • Hydraulic Drive

Based on Farm Size:

  • Below 400 ha
  • Above 400 ha

Based on Application:

  • Row Crops
  • Cereals, Oilseeds & Pulses
  • Forestry           

Based on the Region:

  • Americas (North America, South America)
  • Europe
  • Asia Pacific
  • RoW (Middle East & Africa

Recent Developments

  • In October 2022, Trimble Inc. introduced next-generation displays for precision agriculture applications—the Trimble GFX-1060 and GFX-1260 guidance displays. Farmers can map and monitor field information in real time with precision and complete in-field operations quickly and efficiently with these displays.
  • In February 2022, CNH Industrials’ brand Case IH launched the 2150S Early Riser front-fold trailing planter to give producers a high-performance split-row configuration option to increase planting productivity.
  • In February 2022, Kinze Manufacturing has introduced its new 3505 True Speed high-speed planter for the 2023 planting season, providing advanced technology and improved productivity for small farms and small fields.
  • In November 2021, Vaderstad Industries Inc. launched Tempo L Central Fill can be configured with 16 or 24 rows, allowing for a row spacing of 450 to 762 mm.
  • In June 2021, Deere & Company signed a partnership agreement with Mobile Track Solution to provide digital solutions for precision farming.
  • In November 2020. Deere & Company acquired Harvest Profit; a leading provider of software used in precision farming.

Frequently Asked Questions (FAQs):

To speak to our analyst for a discussion on the above findings, click Speak to Analyst

Exclusive indicates content/data unique to MarketsandMarkets and not available with any competitors.

 
TABLE OF CONTENTS
 
1 INTRODUCTION (Page No. - 36)
    1.1 STUDY OBJECTIVES 
    1.2 MARKET DEFINITION 
           1.2.1 INCLUSIONS AND EXCLUSIONS
    1.3 STUDY SCOPE 
           1.3.1 MARKETS COVERED
                    FIGURE 1 MARKET SEGMENTATION
           1.3.2 GEOGRAPHIC SCOPE
           1.3.3 YEARS CONSIDERED
    1.4 CURRENCY CONSIDERED 
    1.5 LIMITATIONS 
    1.6 STAKEHOLDERS 
    1.7 SUMMARY OF CHANGES 
 
2 RESEARCH METHODOLOGY (Page No. - 41)
    2.1 RESEARCH DATA 
           FIGURE 2 PRECISION PLANTING MARKET: RESEARCH DESIGN
           2.1.1 SECONDARY DATA
                    2.1.1.1 List of major secondary sources
                    2.1.1.2 Key data from secondary sources
           2.1.2 PRIMARY DATA
                    2.1.2.1 Primary interviews with experts
                    2.1.2.2 Breakdown of primaries
                    2.1.2.3 Key data from primary sources
           2.1.3 SECONDARY AND PRIMARY RESEARCH
                    2.1.3.1 Key industry insights
           2.1.4 BOTTOM-UP APPROACH
                    2.1.4.1 Estimating market size using bottom-up approach (demand side)
                               FIGURE 3 MARKET SIZE ESTIMATION METHODOLOGY: BOTTOM-UP APPROACH
           2.1.5 TOP-DOWN APPROACH
                    2.1.5.1 Estimating market size using top-down approach (supply side)
                               FIGURE 4 MARKET SIZE ESTIMATION METHODOLOGY: TOP-DOWN APPROACH
                               FIGURE 5 MARKET SIZE ESTIMATION: DEMAND-SIDE APPROACH
                               FIGURE 6 MARKET SIZE ESTIMATION: SUPPLY-SIDE APPROACH
    2.2 MARKET BREAKDOWN AND DATA TRIANGULATION 
           FIGURE 7 DATA TRIANGULATION
    2.3 RESEARCH ASSUMPTIONS 
    2.4 RISK ASSESSMENT 
 
3 EXECUTIVE SUMMARY (Page No. - 52)
    FIGURE 8 PRECISION PLANTING MARKET, 2022—2027 (USD MILLION)
    FIGURE 9 HARDWARE SEGMENT TO BE LARGEST OFFERING DURING FORECAST PERIOD
    FIGURE 10 HIGH-SPEED PRECISION PLANTING SYSTEMS SEGMENT TO DOMINATE MARKET DURING FORECAST PERIOD
    FIGURE 11 ROW CROPS TO WITNESS HIGHEST ADOPTION OF PRECISION PLANTING SYSTEMS DURING FORECAST PERIOD
    FIGURE 12 ABOVE 400 HA FARM SIZE TO WITNESS HIGHER GROWTH BETWEEN 2022 AND 2027
    FIGURE 13 ELECTRIC DRIVE SEGMENT TO RECORD HIGH GROWTH DURING FORECAST PERIOD
    FIGURE 14 AMERICAS TO ACCOUNT FOR LARGEST MARKET SHARE IN 2021
 
4 PREMIUM INSIGHTS (Page No. - 58)
    4.1 ATTRACTIVE GROWTH OPPORTUNITIES FOR PLAYERS IN PRECISION PLANTING MARKET 
           FIGURE 15 MARKET GROWTH DRIVEN BY REDUCED LABOR COSTS OWING TO USE OF PRECISION PLANTING EQUIPMENT
    4.2 PRECISION PLANTING MARKET, BY OFFERING 
           FIGURE 16 HARDWARE TO HOLD LARGEST SHARE OF PRECISION PLANTING MARKET IN 2022 AND 2027
    4.3 PRECISION PLANTING MARKET, BY SYSTEM TYPE 
           FIGURE 17 HIGH-SPEED PRECISION PLANTING SYSTEMS TO BE LARGEST SYSTEM TYPE IN 2027
    4.4 PRECISION PLANTING MARKET, BY DRIVE TYPE 
           FIGURE 18 HYDRAULIC DRIVE TO ACCOUNT FOR LARGER MARKET SHARE FROM 2022 TO 2027
    4.5 PRECISION PLANTING MARKET, BY FARM SIZE 
           FIGURE 19 FARMS WITH SIZE BELOW 400 HA TO ACCOUNT FOR LARGER MARKET SHARE FROM 2022 TO 2027
    4.6 PRECISION PLANTING MARKET, BY APPLICATION 
           FIGURE 20 ROW CROPS TO ACCOUNT FOR LARGEST MARKET SHARE FROM 2022 TO 2027
    4.7 PRECISION PLANTING MARKET, BY REGION 
           FIGURE 21 AMERICAS TO ACCOUNT FOR LARGEST MARKET SHARE DURING FORECAST PERIOD
 
5 MARKET OVERVIEW (Page No. - 62)
    5.1 INTRODUCTION 
    5.2 MARKET DYNAMICS 
           FIGURE 22 PRECISION PLANTING MARKET: DRIVERS, RESTRAINTS, OPPORTUNITIES, AND CHALLENGES
           5.2.1 DRIVERS
                    5.2.1.1 Climate change and need to meet rising demand for food
                    5.2.1.2 Substantial cost savings associated with precision planting and seeding equipment
                    5.2.1.3 Surge in adoption of advanced technologies to reduce labor cost
                    5.2.1.4 Focus on integration of geo-mapping and sensor data into planting equipment
                    5.2.1.5 Increased promotion of precision planting techniques by governments of various countries worldwide
                               FIGURE 23 DRIVERS AND THEIR IMPACT ON PRECISION PLANTING MARKET
           5.2.2 RESTRAINTS
                    5.2.2.1 High purchase, operational, and maintenance costs
                    5.2.2.2 Small size of landholdings and limited availability of skilled labor
                               FIGURE 24 RESTRAINTS AND THEIR IMPACT ON PRECISION PLANTING MARKET
           5.2.3 OPPORTUNITIES
                    5.2.3.1 Rise in adoption of technologically advanced equipment and tools in agriculture industry
                    5.2.3.2 Integration of smartphone applications into precision planting equipment
                    5.2.3.3 Increased use of AI-based solutions in precision planting
                               FIGURE 25 OPPORTUNITIES AND THEIR IMPACT ON PRECISION PLANTING MARKET
           5.2.4 CHALLENGES
                    5.2.4.1 Integration of farm data on a single platform
                    5.2.4.2 Lack of standardization in precision planting industry
                               FIGURE 26 CHALLENGES AND THEIR IMPACT ON PRECISION PLANTING MARKET
    5.3 VALUE CHAIN ANALYSIS 
           FIGURE 27 PRECISION PLANTING MARKET: VALUE CHAIN ANALYSIS
    5.4 PRECISION PLANTING MARKET ECOSYSTEM 
           TABLE 1 PRECISION PLANTING MARKET: ECOSYSTEM
           FIGURE 28 KEY PLAYERS IN PRECISION PLANTING MARKET ECOSYSTEM
    5.5 PRICING ANALYSIS: AVERAGE SELLING PRICE TREND 
           FIGURE 29 AVERAGE SELLING PRICE (ASP), BY SYSTEM TYPE
           5.5.1 AVERAGE SELLING PRICE OF SYSTEMS OFFERED, BY KEY PLAYER
                    FIGURE 30 AVERAGE SELLING PRICE OF SYSTEMS OFFERED, BY KEY PLAYER
                    TABLE 2 AVERAGE SELLING PRICE OF SYSTEMS OFFERED, BY KEY PLAYER (USD)
    5.6 TRENDS/DISRUPTIONS IMPACTING CUSTOMER’S BUSINESS 
           FIGURE 31 REVENUE SHIFT IN PRECISION PLANTING MARKET
    5.7 KEY TECHNOLOGY TRENDS 
           5.7.1 ADVENT OF ARTIFICIAL INTELLIGENCE IN AGRICULTURE SECTOR
           5.7.2 USE OF IOT IN AGRICULTURE SECTOR
           5.7.3 ADOPTION OF AGRICULTURAL DRONES/UNMANNED AERIAL VEHICLES (UAVS)
    5.8 PORTER’S FIVE FORCES ANALYSIS 
           FIGURE 32 PRECISION PLANTING MARKET: PORTER’S FIVE FORCES ANALYSIS
           FIGURE 33 IMPACT OF PORTER’S FIVE FORCES ON PRECISION PLANTING MARKET
           TABLE 3 IMPACT OF PORTER’S FIVE FORCES ON PRECISION PLANTING MARKET
           5.8.1 THREAT OF NEW ENTRANTS
           5.8.2 THREAT OF SUBSTITUTES
           5.8.3 BARGAINING POWER OF SUPPLIERS
           5.8.4 BARGAINING POWER OF BUYERS
           5.8.5 INTENSITY OF COMPETITIVE RIVALRY
    5.9 KEY STAKEHOLDERS AND BUYING CRITERIA 
           5.9.1 KEY STAKEHOLDERS IN BUYING PROCESS
                    FIGURE 34 INFLUENCE OF STAKEHOLDERS ON BUYING PROCESS FOR TOP 3 END USES
                    TABLE 4 INFLUENCE OF STAKEHOLDERS ON BUYING PROCESS FOR TOP 3 APPLICATIONS (%)
           5.9.2 BUYING CRITERIA
                    FIGURE 35 KEY BUYING CRITERIA FOR TOP 3 APPLICATIONS
                    TABLE 5 KEY BUYING CRITERIA FOR TOP 3 APPLICATIONS
    5.10 CASE STUDIES: PRECISION PLANTING MARKET 
           TABLE 6 SMART AGRICULTURE BY AGCO USING IOT TECHNOLOGY
           TABLE 7 AGJUNCTION DEVELOPED AFFORDABLE AUTOSTEER FOR FARMERS
           TABLE 8 ACCENTURE HELPED PROAGRICA TO GAIN INSIGHTS INTO WIDE RANGE OF AGRICULTURAL DATA
    5.11 TRADE ANALYSIS 
           TABLE 9 IMPORT DATA FOR SEEDERS, PLANTERS, AND TRANSPLANTERS (EXCLUDING NO-TILL MACHINES), HS CODE: 843239 (USD MILLION)
           FIGURE 36 IMPORT DATA FOR SEEDERS, PLANTERS, AND TRANSPLANTERS (EXCLUDING NO-TILL MACHINES), BY COUNTRY, 2017–2021
           TABLE 10 EXPORT DATA FOR SEEDERS, PLANTERS, AND TRANSPLANTERS (EXCLUDING NO-TILL MACHINES), HS CODE: 843239 (USD MILLION)
           FIGURE 37 EXPORT DATA FOR SEEDERS, PLANTERS, AND TRANSPLANTERS (EXCLUDING NO-TILL MACHINES), BY COUNTRY, 2017–2021
    5.12 PATENT ANALYSIS 
           FIGURE 38 NUMBER OF PATENTS GRANTED FOR PRECISION PLANTING MARKET, 2011–2021
           FIGURE 39 REGIONAL ANALYSIS OF PATENTS GRANTED IN PRECISION PLANTING MARKET, 2011–2021
           TABLE 11 LIST OF FEW PATENTS IN PRECISION PLANTING MARKET, 2020–2022
    5.13 KEY CONFERENCES AND EVENTS IN 2022–2024 
           5.13.1 PRECISION PLANTING MARKET: DETAILED LIST OF CONFERENCES AND EVENTS
    5.14 TARIFFS, CODES, AND REGULATORY LANDSCAPE 
           5.14.1 CODES AND STANDARDS RELATED TO PRECISION PLANTING
                     TABLE 12 CODES AND STANDARDS RELATED TO PRECISION PLANTING
 
6 PRECISION PLANTING MARKET, BY OFFERING (Page No. - 89)
    6.1 INTRODUCTION 
           FIGURE 40 PRECISION PLANTING MARKET, BY OFFERING
           TABLE 13 PRECISION PLANTING MARKET, BY OFFERING, 2018–2021 (USD MILLION)
           FIGURE 41 SERVICES SEGMENT TO RECORD HIGHEST GROWTH DURING FORECAST PERIOD
           TABLE 14 PRECISION PLANTING MARKET, BY OFFERING, 2022–2027 (USD MILLION)
    6.2 HARDWARE 
           TABLE 15 HARDWARE: PRECISION PLANTING MARKET, BY TYPE, 2018–2021 (USD MILLION)
           TABLE 16 HARDWARE: PRECISION PLANTING MARKET, BY TYPE, 2022–2027 (USD MILLION)
           TABLE 17 HARDWARE: PRECISION PLANTING MARKET, BY SYSTEM TYPE, 2018–2021 (USD MILLION)
           TABLE 18 HARDWARE: PRECISION PLANTING MARKET, BY SYSTEM TYPE, 2022–2027 (USD MILLION)
           TABLE 19 HARDWARE: PRECISION PLANTING MARKET, BY DRIVE TYPE, 2018–2021 (USD MILLION)
           TABLE 20 HARDWARE: PRECISION PLANTING MARKET, BY DRIVE TYPE, 2022–2027 (USD MILLION)
           TABLE 21 HARDWARE: PRECISION PLANTING MARKET, BY REGION, 2018–2021 (USD MILLION)
           FIGURE 42 AMERICAS TO BE LARGEST PRECISION PLANTING MARKET FOR HARDWARE
           TABLE 22 HARDWARE: PRECISION PLANTING MARKET, BY REGION, 2022–2027 (USD MILLION)
           6.2.1 AUTOMATION AND CONTROL
                    TABLE 23 AUTOMATION AND CONTROL: PRECISION PLANTING MARKET FOR HARDWARE, BY TYPE, 2018–2021 (USD MILLION)
                    FIGURE 43 AUTOMATION AND CONTROL SYSTEMS MARKET FOR DRONES TO WITNESS HIGHEST GROWTH DURING FORECAST PERIOD
                    TABLE 24 AUTOMATION AND CONTROL: PRECISION PLANTING MARKET FOR HARDWARE, BY TYPE, 2022–2027 (USD MILLION)
                    TABLE 25 AUTOMATION AND CONTROL: PRECISION PLANTING MARKET FOR HARDWARE, BY TYPE, 2018–2021 (UNITS)
                    TABLE 26 AUTOMATION AND CONTROL: PRECISION PLANTING MARKET FOR HARDWARE, BY TYPE, 2022–2027 (UNITS)
                    6.2.1.1 Guidance systems
                               6.2.1.1.1 Automated guidance and steering systems rapidly adopted in tractors and agricultural robots
                    6.2.1.2 Drive systems
                               6.2.1.2.1 Electric drive systems segment to witness significant growth during forecast period
                    6.2.1.3 Display systems
                               6.2.1.3.1 Increased integration of display devices into precision planting systems to drive market
                    6.2.1.4 Control systems
                               6.2.1.4.1 Demand for wireless control systems to increase in coming years
                    6.2.1.5 GPS receivers
                               6.2.1.5.1 High demand for GPS receivers in variable rate application
                                             TABLE 27 GPS RECEIVERS: AUTOMATION AND CONTROL MARKET, BY TYPE, 2018–2021 (USD MILLION)
                                             TABLE 28 GPS RECEIVERS: AUTOMATION AND CONTROL MARKET, BY TYPE, 2022–2027 (USD MILLION)
                               6.2.1.5.2 DGPS
                                             6.2.1.5.2.1 Reduction in cost of DGPS to boost its adoption
                               6.2.1.5.3 RTK
                                             6.2.1.5.3.1 Higher accuracy offered by RTK than conventional receivers to foster their demand
                    6.2.1.6 Drones/UAVs
                               6.2.1.6.1 Use of drones for reforestation and precise seeding to drive market growth
                    6.2.1.7 Others
                    6.2.1.8 Sensing and monitoring
                               TABLE 29 SENSING AND MONITORING: PRECISION PLANTING MARKET FOR HARDWARE, BY TYPE, 2018–2021 (USD MILLION)
                               FIGURE 44 SMART METERING SYSTEMS TO BE LARGEST SEGMENT OF SENSING AND MONITORING DEVICES MARKET
                               TABLE 30 SENSING AND MONITORING: PRECISION PLANTING MARKET FOR HARDWARE, BY TYPE, 2022–2027 (USD MILLION)
                               6.2.1.8.1 Smart metering systems
                                             TABLE 31 SMART METERING SYSTEMS: SENSING AND MONITORING MARKET, BY TYPE, 2018–2021 (USD MILLION)
                                             TABLE 32 SMART METERING SYSTEMS: SENSING AND MONITORING MARKET, BY TYPE, 2022–2027 (USD MILLION)
                                             6.2.1.8.1.1 Single seed metering systems
                                             6.2.1.8.1.2 Vacuum seed meters
                                             6.2.1.8.1.3 Positive air metering systems
                                             6.2.1.8.1.4 Advanced seed meters
                    6.2.1.9 Sensors
                               6.2.1.9.1 Increased adoption of advanced planting techniques and declining ASP of sensors to propel market growth
                                             TABLE 33 SENSORS: SENSING AND MONITORING MARKET, BY TYPE, 2018–2021 (USD MILLION)
                                             TABLE 34 SENSORS: SENSING AND MONITORING MARKET, BY TYPE, 2022–2027 (USD MILLION)
                               6.2.1.9.2 Force sensors
                                             6.2.1.9.2.1 Force sensors market to witness significant growth during forecast period
                               6.2.1.9.3 Flow sensors
                                             6.2.1.9.3.1 Flow sensors to witness significant demand due to rising adoption of variable rate seeding
                               6.2.1.9.4 Moisture sensors
                                             6.2.1.9.4.1 Moisture sensors segment to witness high adoption for efficient irrigation management
                               6.2.1.9.5 Temperature sensors
                                             6.2.1.9.5.1 Adoption of temperature sensors increasing to check suitability of soil for planting
                               6.2.1.9.6 Nutrient sensors
                                             6.2.1.9.6.1 Nutrient sensors segment to witness highest growth during forecast period
                               6.2.1.9.7 Others
                               6.2.1.9.8 Cameras
                                             6.2.1.9.8.1 Cameras segment to witness highest growth during forecast period
                               6.2.1.9.9 Delivery systems
                                             6.2.1.9.9.1 Delivery systems for seeds and fertilizers to witness robust growth during forecast period
 
    6.3 SOFTWARE 
           TABLE 35 SOFTWARE: PRECISION PLANTING MARKET, BY TYPE, 2018–2021 (USD MILLION)
           FIGURE 45 SAAS TO HOLD LARGER SHARE OF PRECISION PLANTING MARKET FOR SOFTWARE
           TABLE 36 SOFTWARE: PRECISION PLANTING MARKET, BY TYPE, 2022–2027 (USD MILLION)
           6.3.1 SAAS
                    6.3.1.1 Increased awareness to result in high demand for SaaS model to remotely access crucial data
           6.3.2 PAAS
                    6.3.2.1 Offers customization capability to customers as per their planting requirements
                               TABLE 37 SOFTWARE: PRECISION PLANTING MARKET, BY SYSTEM TYPE, 2018–2021 (USD MILLION)
                               TABLE 38 SOFTWARE: PRECISION PLANTING MARKET, BY SYSTEM TYPE, 2022–2027 (USD MILLION)
                               TABLE 39 SOFTWARE: PRECISION PLANTING MARKET, BY DRIVE TYPE, 2018–2021 (USD MILLION)
                               TABLE 40 SOFTWARE: PRECISION PLANTING MARKET, BY DRIVE TYPE, 2022–2027 (USD MILLION)
                               TABLE 41 SOFTWARE: PRECISION PLANTING MARKET, BY REGION, 2018–2021 (USD MILLION)
                               FIGURE 46 AMERICAS TO BE LARGEST PRECISION PLANTING MARKET FOR SOFTWARE
                               TABLE 42 SOFTWARE: PRECISION PLANTING MARKET, BY REGION, 2022–2027 (USD MILLION)
           6.3.3 SERVICES
                    TABLE 43 SERVICES: PRECISION PLANTING MARKET, BY TYPE, 2018–2021 (USD MILLION)
                    FIGURE 47 SYSTEM INTEGRATION AND CONSULTING SERVICES TO HOLD LARGEST SHARE OF PRECISION PLANTING MARKET
                    TABLE 44 SERVICES: PRECISION PLANTING MARKET, BY TYPE, 2022–2027 (USD MILLION)
                    6.3.3.1 System integration and consulting services
                               6.3.3.1.1 High demand for integration of various software and hardware equipment to propel market growth
                    6.3.3.2 Managed services
                               6.3.3.2.1 Farm operation services
                                             6.3.3.2.1.1 Farm operation services help generate records and integrate unstructured data
                               6.3.3.2.2 Data services
                                             6.3.3.2.2.1 Rise in number of mobile applications to boost demand
                               6.3.3.2.3 Analytics services
                                             6.3.3.2.3.1 Increased demand for real-time information to spur growth
                    6.3.3.3 Connectivity services
                               6.3.3.3.1 Connectivity services market to grow at highest growth rate during forecast period
                    6.3.3.4 Assisted professional services
                               6.3.3.4.1 Assisted professional services market to grow significantly during forecast period
                                            TABLE 45 SERVICES: PRECISION PLANTING MARKET, BY SYSTEM TYPE, 2018–2021 (USD MILLION)
                                            TABLE 46 SERVICES: PRECISION PLANTING MARKET, BY SYSTEM TYPE, 2022–2027 (USD MILLION)
                                            TABLE 47 SERVICES: PRECISION PLANTING MARKET, BY DRIVE TYPE, 2018–2021 (USD MILLION)
                                            TABLE 48 SERVICES: PRECISION PLANTING MARKET, BY DRIVE TYPE, 2022–2027 (USD MILLION)
                                            TABLE 49 SERVICES: PRECISION PLANTING MARKET, BY REGION, 2018–2021 (USD MILLION)
                                            FIGURE 48 ASIA PACIFIC TO RECORD HIGHEST GROWTH IN PRECISION PLANTING MARKET FOR SERVICES
                                            TABLE 50 SERVICES: PRECISION PLANTING MARKET, BY REGION, 2022–2027 (USD MILLION)
 
7 PRECISION PLANTING MARKET, BY SYSTEM TYPE (Page No. - 118)
    7.1 INTRODUCTION 
           FIGURE 49 PRECISION PLANTING MARKET, BY SYSTEM TYPE
           TABLE 51 PRECISION PLANTING MARKET, BY SYSTEM TYPE, 2018–2021 (USD MILLION)
           FIGURE 50 HIGH-SPEED PRECISION PLANTING SYSTEMS TO BE LARGEST SEGMENT DURING FORECAST PERIOD
           TABLE 52 PRECISION PLANTING MARKET, BY SYSTEM TYPE, 2022–2027 (USD MILLION)
    7.2 HIGH-SPEED PRECISION PLANTING SYSTEMS 
           7.2.1 HIGH-SPEED PRECISION PLANTING SYSTEMS TO WITNESS HIGH ADOPTION IN LARGE FARMS
                    TABLE 53 HIGH-SPEED PRECISION PLANTING SYSTEMS: PRECISION PLANTING MARKET, BY OFFERING, 2018–2021 (USD MILLION)
                    TABLE 54 HIGH-SPEED PRECISION PLANTING SYSTEMS: PRECISION PLANTING MARKET, BY OFFERING, 2022–2027 (USD MILLION)
                    TABLE 55 HIGH-SPEED PRECISION PLANTING SYSTEMS: PRECISION PLANTING MARKET, BY DRIVE TYPE, 2018–2021 (USD MILLION)
                    TABLE 56 HIGH-SPEED PRECISION PLANTING SYSTEMS: PRECISION PLANTING MARKET, BY DRIVE TYPE, 2022–2027 (USD MILLION)
                    TABLE 57 HIGH-SPEED PRECISION PLANTING SYSTEMS: PRECISION PLANTING MARKET, BY REGION, 2018–2021 (USD MILLION)
                    FIGURE 51 HIGH-SPEED PRECISION PLANTING SYSTEMS SEGMENT IN ASIA PACIFIC TO RECORD HIGHEST GROWTH DURING FORECAST PERIOD
                    TABLE 58 HIGH-SPEED PRECISION PLANTING SYSTEMS: PRECISION PLANTING MARKET, BY REGION, 2022–2027 (USD MILLION)
    7.3 PRECISION AIR SEEDERS 
           7.3.1 PRECISION AIR SEEDERS TO WITNESS STRONG DEMAND FROM SMALL AND MEDIUM-SIZED FARMS
                    TABLE 59 PRECISION AIR SEEDERS: PRECISION PLANTING MARKET, BY OFFERING, 2018–2021 (USD MILLION)
                    FIGURE 52 HARDWARE TO BE LARGEST SEGMENT OF PRECISION PLANTING MARKET FOR PRECISION AIR SEEDERS
                    TABLE 60 PRECISION AIR SEEDERS: PRECISION PLANTING MARKET, BY OFFERING, 2022–2027 (USD MILLION)
                    TABLE 61 PRECISION AIR SEEDERS: PRECISION PLANTING MARKET, BY DRIVE TYPE, 2018–2021 (USD MILLION)
                    TABLE 62 PRECISION AIR SEEDERS: PRECISION PLANTING MARKET, BY DRIVE TYPE, 2022–2027 (USD MILLION)
                    TABLE 63 PRECISION AIR SEEDERS: PRECISION PLANTING MARKET, BY REGION, 2018–2021 (USD MILLION)
                    TABLE 64 PRECISION AIR SEEDERS: PRECISION PLANTING MARKET, BY REGION, 2022–2027 (USD MILLION)
    7.4 DRONES 
           7.4.1 INCREASED NEED FOR FAST REFORESTATION TO PROPEL GROWTH
                    TABLE 65 DRONES: PRECISION PLANTING MARKET, BY OFFERING, 2018–2021 (USD MILLION)
                    FIGURE 53 SERVICES SEGMENT OF PRECISION PLANTING MARKET FOR DRONES TO GROW AT HIGHEST CAGR DURING FORECAST PERIOD
                    TABLE 66 DRONES: PRECISION PLANTING MARKET, BY OFFERING, 2022–2027 (USD MILLION)
                    TABLE 67 DRONES: PRECISION PLANTING MARKET, BY REGION, 2018–2021 (USD MILLION)
                    TABLE 68 DRONES: PRECISION PLANTING MARKET, BY REGION, 2022–2027 (USD MILLION)
 
8 PRECISION PLANTING MARKET, BY DRIVE TYPE (Page No. - 129)
    8.1 INTRODUCTION 
           FIGURE 54 PRECISION PLANTING MARKET, BY DRIVE TYPE
           TABLE 69 PRECISION PLANTING MARKET, BY DRIVE TYPE, 2018–2021 (USD MILLION)
           FIGURE 55 ELECTRIC DRIVE SEGMENT TO WITNESS HIGHER GROWTH DURING FORECAST PERIOD
           TABLE 70 PRECISION PLANTING MARKET, BY DRIVE TYPE, 2022–2027 (USD MILLION)
    8.2 ELECTRIC DRIVE 
           8.2.1 ELECTRIC DRIVE ENABLES SEED RATE CONTROL ON ROUGH FIELDS
                    TABLE 71 ELECTRIC DRIVE: PRECISION PLANTING MARKET, BY OFFERING, 2018–2021 (USD MILLION)
                    TABLE 72 ELECTRIC DRIVE: PRECISION PLANTING MARKET, BY OFFERING, 2022–2027 (USD MILLION)
                    TABLE 73 ELECTRIC DRIVE: PRECISION PLANTING MARKET, BY REGION, 2018–2021 (USD MILLION)
           FIGURE 56 PRECISION PLANTING MARKET FOR ELECTRIC DRIVE IN ASIA PACIFIC TO RECORD HIGHEST CAGR DURING FORECAST PERIOD
                    TABLE 74 ELECTRIC DRIVE: PRECISION PLANTING MARKET, BY REGION, 2022–2027 (USD MILLION)
    8.3 HYDRAULIC DRIVE 
           8.3.1 HIGH ADOPTION OF HYDRAULIC DRIVE-BASED PRECISION PLANTERS AND SEEDING SYSTEMS AMONG FARMERS OR GROWERS
                    TABLE 75 HYDRAULIC DRIVE: PRECISION PLANTING MARKET, BY OFFERING, 2018–2021 (USD MILLION)
                    TABLE 76 HYDRAULIC DRIVE: PRECISION PLANTING MARKET, BY OFFERING, 2022–2027 (USD MILLION)
                    TABLE 77 HYDRAULIC DRIVE: PRECISION PLANTING MARKET, BY REGION, 2018–2021 (USD MILLION)
                    FIGURE 57 AMERICAS EXPECTED TO BE LARGEST PRECISION PLANTING MARKET FOR HYDRAULIC DRIVES
                    TABLE 78 HYDRAULIC DRIVE: PRECISION PLANTING MARKET, BY REGION, 2022–2027 (USD MILLION)
 
9 PRECISION PLANTING MARKET, BY APPLICATION (Page No. - 136)
    9.1 INTRODUCTION 
           FIGURE 58 PRECISION PLANTING MARKET, BY APPLICATION
           TABLE 79 PRECISION PLANTING MARKET, BY APPLICATION, 2018–2021 (USD MILLION)
           FIGURE 59 ROW CROPS TO BE LARGEST SEGMENT DURING FORECAST PERIOD
           TABLE 80 PRECISION PLANTING MARKET, BY APPLICATION, 2022–2027 (USD MILLION)
    9.2 ROW CROPS 
           9.2.1 HIGH-SPEED PRECISION PLANTERS USED TO PLANT ROW CROPS IN LARGE FARMS
    9.3 CEREALS, OILSEEDS & PULSES 
           9.3.1 PRECISION AIR SEEDING SYSTEMS COST-EFFECTIVE TO PLANT CEREALS, OILSEEDS, AND PULSES
    9.4 FORESTRY 
           9.4.1 DRONES BEING USED FOR REFORESTATION PRACTICES
 
10 PRECISION PLANTING MARKET, BY FARM SIZE (Page No. - 140)
     10.1 INTRODUCTION 
             FIGURE 60 PRECISION PLANTING MARKET, BY FARM SIZE
             TABLE 81 PRECISION PLANTING MARKET, BY FARM SIZE, 2018–2021 (USD MILLION)
             FIGURE 61 FARMS BELOW 400 HA TO BE LARGER SEGMENT DURING FORECAST PERIOD
             TABLE 82 PRECISION PLANTING MARKET, BY FARM SIZE, 2022–2027 (USD MILLION)
     10.2 BELOW 400 HA 
             10.2.1 FARMERS EXTENSIVELY ADOPTING PRECISION PLANTING SYSTEMS FOR FARMS BELOW 400 HA IN SIZE
                        TABLE 83 BELOW 400 HA: PRECISION PLANTING MARKET, BY SYSTEM TYPE, 2018–2021 (USD MILLION)
                        TABLE 84 BELOW 400 HA: PRECISION PLANTING MARKET, BY SYSTEM TYPE, 2022–2027 (USD MILLION)
                        TABLE 85 BELOW 400 HA: PRECISION PLANTING MARKET, BY OFFERING, 2018–2021 (USD MILLION)
                        TABLE 86 BELOW 400 HA: PRECISION PLANTING MARKET, BY OFFERING, 2022–2027 (USD MILLION)
     10.3 ABOVE 400 HA 
             10.3.1 FARM AUTOMATION HELPED FARMERS SIGNIFICANTLY CUT COSTS ON FARMS OVER 400 HA
                        TABLE 87 ABOVE 400 HA: PRECISION PLANTING MARKET, BY SYSTEM TYPE, 2018–2021 (USD MILLION)
                        TABLE 88 ABOVE 400 HA: PRECISION PLANTING MARKET, BY SYSTEM TYPE, 2022–2027 (USD MILLION)
                        TABLE 89 ABOVE 400 HA: PRECISION PLANTING MARKET, BY OFFERING, 2018–2021 (USD MILLION)
                        TABLE 90 ABOVE 400 HA: PRECISION PLANTING MARKET, BY OFFERING, 2022–2027 (USD MILLION)
 
11 PRECISION PLANTING MARKET, BY REGION (Page No. - 146)
     11.1 INTRODUCTION 
             FIGURE 62 MARKETS IN INDIA AND CHINA TO WITNESS HIGH GROWTH DURING FORECAST PERIOD
             FIGURE 63 AMERICAS ACCOUNTED FOR LARGEST SHARE OF PRECISION PLANTING MARKET
             TABLE 91 PRECISION PLANTING MARKET, BY REGION, 2018–2021 (USD MILLION)
             TABLE 92 PRECISION PLANTING MARKET, BY REGION, 2022–2027 (USD MILLION)
     11.2 AMERICAS 
             FIGURE 64 AMERICAS: PRECISION PLANTING MARKET SNAPSHOT
             TABLE 93 AMERICAS: PRECISION PLANTING MARKET, BY REGION, 2018–2021 (USD MILLION)
             TABLE 94 AMERICAS: PRECISION PLANTING MARKET, BY REGION, 2022–2027 (USD MILLION)
             TABLE 95 AMERICAS: PRECISION PLANTING MARKET, BY OFFERING, 2018–2021 (USD MILLION)
             TABLE 96 AMERICAS: PRECISION PLANTING MARKET, BY OFFERING, 2022–2027 (USD MILLION)
             TABLE 97 AMERICAS: PRECISION PLANTING MARKET, BY SYSTEM TYPE, 2018–2021 (USD MILLION)
             TABLE 98 AMERICAS: PRECISION PLANTING MARKET, BY SYSTEM TYPE, 2022–2027 (USD MILLION)
             TABLE 99 AMERICAS: PRECISION PLANTING MARKET, BY DRIVE TYPE, 2018–2021 (USD MILLION)
             TABLE 100 AMERICAS: PRECISION PLANTING MARKET, BY DRIVE TYPE, 2022–2027 (USD MILLION)
             11.2.1 NORTH AMERICA
                        TABLE 101 NORTH AMERICA: PRECISION PLANTING MARKET, BY COUNTRY, 2018–2021 (USD MILLION)
                        TABLE 102 NORTH AMERICA: PRECISION PLANTING MARKET, BY COUNTRY, 2022–2027 (USD MILLION)
                        TABLE 103 NORTH AMERICA: PRECISION PLANTING MARKET, BY OFFERING, 2018–2021 (USD MILLION)
                        TABLE 104 NORTH AMERICA: PRECISION PLANTING MARKET, BY OFFERING, 2022–2027 (USD MILLION)
                        TABLE 105 NORTH AMERICA: PRECISION PLANTING MARKET, BY SYSTEM TYPE, 2018–2021 (USD MILLION)
                        TABLE 106 NORTH AMERICA: PRECISION PLANTING MARKET, BY SYSTEM TYPE, 2022–2027 (USD MILLION)
                        TABLE 107 NORTH AMERICA: PRECISION PLANTING MARKET, BY DRIVE TYPE, 2018–2021 (USD MILLION)
                        TABLE 108 NORTH AMERICA: PRECISION PLANTING MARKET, BY DRIVE TYPE, 2022–2027 (USD MILLION)
                        11.2.1.1 US
                                     11.2.1.1.1 Large areas under crop cultivation and use for advanced farm technologies to drive market growth
                                                    TABLE 109 US: PRECISION PLANTING MARKET, BY OFFERING, 2018–2021 (USD MILLION)
                                                    TABLE 110 US: PRECISION PLANTING MARKET, BY OFFERING, 2022–2027 (USD MILLION)
                                                    TABLE 111 US: PRECISION PLANTING MARKET, BY SYSTEM TYPE, 2018–2021 (USD MILLION)
                                                    TABLE 112 US: PRECISION PLANTING MARKET, BY SYSTEM TYPE, 2022–2027 (USD MILLION)
                                                    TABLE 113 US: PRECISION PLANTING MARKET, BY DRIVE TYPE, 2018–2021 (USD MILLION)
                                                    TABLE 114 US: PRECISION PLANTING MARKET, BY DRIVE TYPE, 2022–2027 (USD MILLION)
                        11.2.1.2 Canada
                                     11.2.1.2.1 Large farm size to boost market during forecast period
                                                    TABLE 115 CANADA: PRECISION PLANTING MARKET, BY OFFERING, 2018–2021 (USD MILLION)
                                                    TABLE 116 CANADA: PRECISION PLANTING MARKET, BY OFFERING, 2022–2027 (USD MILLION)
                                                    TABLE 117 CANADA: PRECISION PLANTING MARKET, BY SYSTEM TYPE, 2018–2021 (USD MILLION)
                                                    TABLE 118 CANADA: PRECISION PLANTING MARKET, BY SYSTEM TYPE, 2022–2027 (USD MILLION)
                                                    TABLE 119 CANADA: PRECISION PLANTING MARKET, BY DRIVE TYPE, 2018–2021 (USD MILLION)
                                                    TABLE 120 CANADA: PRECISION PLANTING MARKET, BY DRIVE TYPE, 2022–2027 (USD MILLION)
                        11.2.1.3 Mexico
                                     11.2.1.3.1 Increased government support to propel adoption of advanced equipment
             11.2.2 SOUTH AMERICA
                        TABLE 121 SOUTH AMERICA: PRECISION PLANTING MARKET, BY COUNTRY, 2018–2021 (USD MILLION)
                        TABLE 122 SOUTH AMERICA: PRECISION PLANTING MARKET, BY COUNTRY, 2022–2027 (USD MILLION)
                        TABLE 123 SOUTH AMERICA: PRECISION PLANTING MARKET, BY OFFERING, 2018–2021 (USD MILLION)
                        TABLE 124 SOUTH AMERICA: PRECISION PLANTING MARKET, BY OFFERING, 2022–2027 (USD MILLION)
                        TABLE 125 SOUTH AMERICA: PRECISION PLANTING MARKET, BY SYSTEM TYPE, 2018–2021 (USD MILLION)
                        TABLE 126 SOUTH AMERICA: PRECISION PLANTING MARKET, BY SYSTEM TYPE, 2022–2027 (USD MILLION)
                        TABLE 127 SOUTH AMERICA: PRECISION PLANTING MARKET, BY DRIVE TYPE, 2018–2021 (USD MILLION)
                        TABLE 128 SOUTH AMERICA: PRECISION PLANTING MARKET, BY DRIVE TYPE, 2022–2027 (USD MILLION)
                        11.2.2.1 Brazil
                                     11.2.2.1.1 Large agricultural sector and government support to propel market growth
                                                    TABLE 129 BRAZIL: PRECISION PLANTING MARKET, BY OFFERING, 2018–2021 (USD MILLION)
                                                    TABLE 130 BRAZIL: PRECISION PLANTING MARKET, BY OFFERING, 2022–2027 (USD MILLION)
                                                    TABLE 131 BRAZIL: PRECISION PLANTING MARKET, BY SYSTEM TYPE, 2018–2021 (USD MILLION)
                                                    TABLE 132 BRAZIL: PRECISION PLANTING MARKET, BY SYSTEM TYPE, 2022–2027 (USD MILLION)
                                                    TABLE 133 BRAZIL: PRECISION PLANTING MARKET, BY DRIVE TYPE, 2018–2021 (USD MILLION)
                                                    TABLE 134 BRAZIL: PRECISION PLANTING MARKET, BY DRIVE TYPE, 2022–2027 (USD MILLION)
                        11.2.2.2 Argentina
                                     11.2.2.2.1 Likely to witness robust market growth during forecast period
                        11.2.2.3 Rest of South America
     11.3 EUROPE 
             FIGURE 65 EUROPE: PRECISION PLANTING MARKET SNAPSHOT
             TABLE 135 EUROPE: PRECISION PLANTING MARKET, BY COUNTRY, 2018–2021 (USD MILLION)
             TABLE 136 EUROPE: PRECISION PLANTING MARKET, BY COUNTRY, 2022–2027 (USD MILLION)
             TABLE 137 EUROPE: PRECISION PLANTING MARKET, BY OFFERING, 2018–2021 (USD MILLION)
             TABLE 138 EUROPE: PRECISION PLANTING MARKET, BY OFFERING, 2022–2027 (USD MILLION)
             TABLE 139 EUROPE: PRECISION PLANTING MARKET, BY SYSTEM TYPE, 2018–2021 (USD MILLION)
             TABLE 140 EUROPE: PRECISION PLANTING MARKET, BY SYSTEM TYPE, 2022–2027 (USD MILLION)
             TABLE 141 EUROPE: PRECISION PLANTING MARKET, BY DRIVE TYPE, 2018–2021 (USD MILLION)
             TABLE 142 EUROPE: PRECISION PLANTING MARKET, BY DRIVE TYPE, 2022–2027 (USD MILLION)
             11.3.1 FRANCE
                        11.3.1.1 Strong R&D capabilities and higher affordability of advanced equipment by growers to spur market growth
                                     TABLE 143 FRANCE: PRECISION PLANTING MARKET, BY OFFERING, 2018–2021 (USD MILLION)
                                     TABLE 144 FRANCE: PRECISION PLANTING MARKET, BY OFFERING, 2022–2027 (USD MILLION)
                                     TABLE 145 FRANCE: PRECISION PLANTING MARKET, BY SYSTEM TYPE, 2018–2021 (USD MILLION)
                                     TABLE 146 FRANCE: PRECISION PLANTING MARKET, BY SYSTEM TYPE, 2022–2027 (USD MILLION)
                                     TABLE 147 FRANCE: PRECISION PLANTING MARKET, BY DRIVE TYPE, 2018–2021 (USD MILLION)
                                     TABLE 148 FRANCE: PRECISION PLANTING MARKET, BY DRIVE TYPE, 2022–2027 (USD MILLION)
             11.3.2 GERMANY
                        11.3.2.1 Increase in agricultural export to boost market growth
                                     TABLE 149 GERMANY: PRECISION PLANTING MARKET, BY OFFERING, 2018–2021 (USD MILLION)
                                     TABLE 150 GERMANY: PRECISION PLANTING MARKET, BY OFFERING, 2022–2027 (USD MILLION)
                                     TABLE 151 GERMANY: PRECISION PLANTING MARKET, BY SYSTEM TYPE, 2018–2021 (USD MILLION)
                                     TABLE 152 GERMANY: PRECISION PLANTING MARKET, BY SYSTEM TYPE, 2022–2027 (USD MILLION)
                                     TABLE 153 GERMANY: PRECISION PLANTING MARKET, BY DRIVE TYPE, 2018–2021 (USD MILLION)
                                     TABLE 154 GERMANY: PRECISION PLANTING MARKET, BY DRIVE TYPE, 2022–2027 (USD MILLION)
             11.3.3 UK
                        11.3.3.1 Rise in number of agreements and partnerships between local agricultural technology players and international institutions to spur market growth
                                     TABLE 155 UK: PRECISION PLANTING MARKET, BY OFFERING, 2018–2021 (USD MILLION)
                                     TABLE 156 UK: PRECISION PLANTING MARKET, BY OFFERING, 2022–2027 (USD MILLION)
                                     TABLE 157 UK: PRECISION PLANTING MARKET, BY SYSTEM TYPE, 2018–2021 (USD MILLION)
                                     TABLE 158 UK: PRECISION PLANTING MARKET, BY SYSTEM TYPE, 2022–2027 (USD MILLION)
                                     TABLE 159 UK: PRECISION PLANTING MARKET, BY DRIVE TYPE, 2018–2021 (USD MILLION)
                                     TABLE 160 UK: PRECISION PLANTING MARKET, BY DRIVE TYPE, 2022–2027 (USD MILLION)
             11.3.4 ITALY
                        11.3.4.1 Increased adoption of precision planting techniques by growers to propel market growth
                                     TABLE 161 ITALY: PRECISION PLANTING MARKET, BY OFFERING, 2018–2021 (USD MILLION)
                                     TABLE 162 ITALY: PRECISION PLANTING MARKET, BY OFFERING, 2022–2027 (USD MILLION)
                                     TABLE 163 ITALY: PRECISION PLANTING MARKET, BY SYSTEM TYPE, 2018–2021 (USD MILLION)
                                     TABLE 164 ITALY: PRECISION PLANTING MARKET, BY SYSTEM TYPE, 2022–2027 (USD MILLION)
                                     TABLE 165 ITALY: PRECISION PLANTING MARKET, BY DRIVE TYPE, 2018–2021 (USD MILLION)
                                     TABLE 166 ITALY: PRECISION PLANTING MARKET, BY DRIVE TYPE, 2022–2027 (USD MILLION)
             11.3.5 POLAND
                        11.3.5.1 Likely to witness highest growth during forecast period
             11.3.6 SPAIN
                        11.3.6.1 Introduction of farm mechanization and automation to spur market growth
             11.3.7 REST OF EUROPE
     11.4 ASIA PACIFIC 
             FIGURE 66 ASIA PACIFIC: PRECISION PLANTING MARKET SNAPSHOT
             TABLE 167 ASIA PACIFIC: PRECISION PLANTING MARKET, BY COUNTRY, 2018–2021 (USD MILLION)
             TABLE 168 ASIA PACIFIC: PRECISION PLANTING MARKET, BY COUNTRY, 2022–2027 (USD MILLION)
             TABLE 169 ASIA PACIFIC: PRECISION PLANTING MARKET, BY OFFERING, 2018–2021 (USD MILLION)
             TABLE 170 ASIA PACIFIC: PRECISION PLANTING MARKET, BY OFFERING, 2022–2027 (USD MILLION)
             TABLE 171 ASIA PACIFIC: PRECISION PLANTING MARKET, BY SYSTEM TYPE, 2018–2021 (USD MILLION)
             TABLE 172 ASIA PACIFIC: PRECISION PLANTING MARKET, BY SYSTEM TYPE, 2022–2027 (USD MILLION)
             TABLE 173 ASIA PACIFIC: PRECISION PLANTING MARKET, BY DRIVE TYPE, 2018–2021 (USD MILLION)
             TABLE 174 ASIA PACIFIC: PRECISION PLANTING MARKET, BY DRIVE TYPE, 2022–2027 (USD MILLION)
             11.4.1 AUSTRALIA
                        11.4.1.1 Presence of large-sized farms to provide attractive opportunities for OEMs
                                     TABLE 175 AUSTRALIA: PRECISION PLANTING MARKET, BY OFFERING, 2018–2021 (USD MILLION)
                                     TABLE 176 AUSTRALIA: PRECISION PLANTING MARKET, BY OFFERING, 2022–2027 (USD MILLION)
                                     TABLE 177 AUSTRALIA: PRECISION PLANTING MARKET, BY SYSTEM TYPE, 2018–2021 (USD MILLION)
                                     TABLE 178 AUSTRALIA: PRECISION PLANTING MARKET, BY SYSTEM TYPE, 2022–2027 (USD MILLION)
                                     TABLE 179 AUSTRALIA: PRECISION PLANTING MARKET, BY DRIVE TYPE, 2018–2021 (USD MILLION)
                                     TABLE 180 AUSTRALIA: PRECISION PLANTING MARKET, BY DRIVE TYPE, 2022–2027 (USD MILLION)
             11.4.2 CHINA
                        11.4.2.1 China to witness robust market growth during forecast period
             11.4.3 JAPAN
                        11.4.3.1 Surge in adoption of advanced planting technologies and ICT solutions to drive market growth
             11.4.4 INDIA
                        11.4.4.1 India to provide attractive growth opportunities for players in precision planting market
             11.4.5 REST OF ASIA PACIFIC
     11.5 REST OF THE WORLD (ROW) 
             TABLE 181 ROW: PRECISION PLANTING MARKET, BY REGION, 2018–2021 (USD MILLION)
             TABLE 182 ROW: PRECISION PLANTING MARKET, BY REGION, 2022–2027 (USD MILLION)
             TABLE 183 ROW: PRECISION PLANTING MARKET, BY OFFERING, 2018–2021 (USD MILLION)
             TABLE 184 ROW: PRECISION PLANTING MARKET, BY OFFERING, 2022–2027 (USD MILLION)
             TABLE 185 ROW: PRECISION PLANTING MARKET, BY SYSTEM TYPE, 2018–2021 (USD MILLION)
             TABLE 186 ROW: PRECISION PLANTING MARKET, BY SYSTEM TYPE, 2022–2027 (USD MILLION)
             TABLE 187 ROW: PRECISION PLANTING MARKET, BY DRIVE TYPE, 2018–2021 (USD MILLION)
             TABLE 188 ROW: PRECISION PLANTING MARKET, BY DRIVE TYPE, 2022–2027 (USD MILLION)
             11.5.1 AFRICA
                        11.5.1.1 Rise in awareness regarding benefits of precision planting techniques to boost market growth
             11.5.2 MIDDLE EAST
                        11.5.2.1 Increased adoption of remote sensing technology to propel market growth
 
12 COMPETITIVE LANDSCAPE (Page No. - 194)
     12.1 INTRODUCTION 
     12.2 STRATEGIES ADOPTED BY KEY PLAYERS 
             12.2.1 OVERVIEW OF STRATEGIES ADOPTED BY KEY PLAYERS IN PRECISION PLANTING MARKET
     12.3 MARKET SHARE ANALYSIS 
             FIGURE 67 PRECISION PLANTING MARKET: MARKET SHARE ANALYSIS, 2021
             TABLE 189 PRECISION PLANTING MARKET: DEGREE OF COMPETITION
     12.4 REVENUE ANALYSIS 
             FIGURE 68 FIVE-YEAR REVENUE ANALYSIS OF TOP 5 PLAYERS IN PRECISION PLANTING MARKET, 2017–2021
     12.5 COMPANY EVALUATION QUADRANT, 2021 
             FIGURE 69 PRECISION PLANTING MARKET (GLOBAL) COMPANY EVALUATION MATRIX, 2021
             12.5.1 STARS
             12.5.2 EMERGING LEADERS
             12.5.3 PERVASIVE PLAYERS
             12.5.4 PARTICIPANTS
             12.5.5 COMPANY FOOTPRINT
                        TABLE 190 COMPANY FOOTPRINT
                        TABLE 191 COMPANY FOOTPRINT, BY OFFERING
                        TABLE 192 COMPANY FOOTPRINT, BY APPLICATION
                        TABLE 193 COMPANY FOOTPRINT, BY REGION
     12.6 SMALL AND MEDIUM-SIZED ENTERPRISES (SMES) EVALUATION MATRIX 
             FIGURE 70 PRECISION PLANTING MARKET, SMES EVALUATION MATRIX, 2021
             12.6.1 PROGRESSIVE COMPANIES
             12.6.2 RESPONSIVE COMPANIES
             12.6.3 DYNAMIC COMPANIES
             12.6.4 STARTING BLOCKS
                        TABLE 194 PRECISION PLANTING MARKET: DETAILED LIST OF KEY SMES
                        TABLE 195 PRECISION PLANTING MARKET: COMPETITIVE BENCHMARKING OF KEY PLAYERS (SMES)
     12.7 COMPETITIVE SCENARIO AND TRENDS 
             12.7.1 PRECISION PLANTING MARKET
                        12.7.1.1 Product launches
                                     TABLE 196 PRECISION PLANTING MARKET: PRODUCT LAUNCHES, FEBRUARY 2018–OCTOBER 2022
                        12.7.1.2 Deals
                                     TABLE 197 PRECISION PLANTING MARKET: DEALS, FEBRUARY 2018–OCTOBER 2022
                        12.7.1.3 Others
                                     TABLE 198 OTHERS, AUGUST 2019–JANUARY 2021
 
13 COMPANY PROFILES (Page No. - 220)
(Business overview, Products/Solutions/Services offered, Recent Developments, MNM view)*  
     13.1 KEY PLAYERS 
             13.1.1 DEERE & COMPANY
                        TABLE 199 DEERE & COMPANY: COMPANY SNAPSHOT
                        FIGURE 71 DEERE & COMPANY: COMPANY SNAPSHOT
                        TABLE 200 DEERE & COMPANY: PRODUCTS OFFERED
                        TABLE 201 DEERE & COMPANY: PRODUCT LAUNCHES
                        TABLE 202 DEERE & COMPANY: DEALS
                        TABLE 203 DEERE & COMPANY: OTHERS
             13.1.2 TRIMBLE INC.
                        TABLE 204 TRIMBLE INC.: BUSINESS OVERVIEW
                        FIGURE 72 TRIMBLE INC.: COMPANY SNAPSHOT
                        TABLE 205 TRIMBLE INC.: PRODUCTS OFFERED
                        TABLE 206 TRIMBLE INC.: PRODUCT LAUNCHES
                        TABLE 207 TRIMBLE INC.: DEALS
             13.1.3 CNH INDUSTRIAL N.V.
                        TABLE 208 CNH INDUSTRIAL N.V.: BUSINESS OVERVIEW
                        FIGURE 73 CNH INDUSTRIAL N.V.: COMPANY SNAPSHOT
                        TABLE 209 CNH INDUSTRIAL N.V.: PRODUCTS OFFERED
                        TABLE 210 CNH INDUSTRIAL N.V.: PRODUCT LAUNCHES
                        TABLE 211 CNH INDUSTRIAL N.V.: DEALS
             13.1.4 TOPCON POSITIONING SYSTEMS
                        TABLE 212 TOPCON POSITIONING SYSTEMS: BUSINESS OVERVIEW
                        TABLE 213 TOPCON POSITIONING SYSTEMS: PRODUCTS OFFERED
                        TABLE 214 TOPCON POSITIONING SYSTEMS: PRODUCT LAUNCHES
                        TABLE 215 TOPCON POSITIONING SYSTEMS: DEALS
             13.1.5 KINZE MANUFACTURING INC.
                        TABLE 216 KINZE MANUFACTURING INC.: BUSINESS OVERVIEW
                        TABLE 217 KINZE MANUFACTURING INC.: PRODUCTS OFFERED
                        TABLE 218 KINZE MANUFACTURING INC.: PRODUCT LAUNCHES
                        TABLE 219 KINZE MANUFACTURING INC.: DEALS
             13.1.6 PRECISION PLANTING (BRAND OF AGCO)
                        TABLE 220 PRECISION PLANTING: BUSINESS OVERVIEW
                        TABLE 221 PRECISION PLANTING: PRODUCTS OFFERED
                        TABLE 222 PRECISION PLANTING: PRODUCT LAUNCHES
                        TABLE 223 PRECISION PLANTING: DEALS
             13.1.7 BUHLER INDUSTRIES INC.
                        TABLE 224 BUHLER INDUSTRIES INC.: BUSINESS OVERVIEW
                        FIGURE 74 BUHLER INDUSTRIES INC.: COMPANY SNAPSHOT
                        TABLE 225 BUHLER INDUSTRIES INC.: PRODUCTS OFFERED
                        TABLE 226 BUHLER INDUSTRIES INC.: DEALS
             13.1.8 VADERSTAD INDUSTRIES INC.
                        TABLE 227 VADERSTAD INDUSTRIES INC.: BUSINESS OVERVIEW
                        TABLE 228 VADERSTAD INDUSTRIES INC.: PRODUCTS OFFERED
                        TABLE 229 VADERSTAD INDUSTRIES INC.: PRODUCT LAUNCHES
                        TABLE 230 VADERSTAD INDUSTRIES INC.: DEALS
                        TABLE 231 VADERSTAD INDUSTRIES INC.: OTHERS
             13.1.9 STARA S/A
                        TABLE 232 STARA S/A: BUSINESS OVERVIEW
                        TABLE 233 STARA S/A: PRODUCTS OFFERED
                        TABLE 234 STARA S/A: PRODUCT LAUNCHES
                        TABLE 235 STARA S/A: DEALS
             13.1.10 KASCO MANUFACTURING INC.
                        TABLE 236 KASCO MANUFACTURING INC.: BUSINESS OVERVIEW
                        TABLE 237 KASCO MANUFACTURING INC.: PRODUCTS OFFERED
                        TABLE 238 KASCO MANUFACTURING INC.: PRODUCT LAUNCHES
     13.2 OTHER PLAYERS 
             13.2.1 DAVIMAC GROUP
             13.2.2 MORRIS INDUSTRIES LTD.
             13.2.3 SEEDMASTER MANUFACTURING INC.
             13.2.4 THE CLIMATE CORPORATION
             13.2.5 AG LEADER TECHNOLOGY
             13.2.6 BOURGAULT INDUSTRIES LTD.
             13.2.7 DRONESEED
             13.2.8 DENDRA SYSTEMS
             13.2.9 KUBOTA CORPORATION
             13.2.10 HEXAGON AGRICULTURE
             13.2.11 DICKEY-JOHN CORPORATION
             13.2.12 MONOSEM
             13.2.13 WHITE PLANTERS (BRAND OF AGCO)
*Details on Business overview, Products/Solutions/Services offered, Recent Developments, MNM view might not be captured in case of unlisted companies.  
 
14 APPENDIX (Page No. - 268)
     14.1 INSIGHTS FROM INDUSTRY EXPERTS 
     14.2 DISCUSSION GUIDE 
     14.3 KNOWLEDGESTORE: MARKETSANDMARKETS’ SUBSCRIPTION PORTAL 
     14.4 CUSTOMIZATION OPTIONS 
     14.5 RELATED REPORTS 
     14.6 AUTHOR DETAILS 


The study involved four major activities for estimating the size of the precision planting market. Exhaustive secondary research has been carried out to collect information relevant to the market, its peer markets, and its child market. Primary research has been undertaken to validate key findings, assumptions, and sizing with the industry experts across the value chain of the precision planting market. Both top-down and bottom-up approaches have been employed to estimate the complete market size. It has been followed by the market breakdown and data triangulation methods to estimate the size of different segments and subsegments of the market.

Secondary Research

Secondary sources used for this research study include government sources, corporate filings (such as annual reports, investor presentations, and financial statements), and trade, business, and professional associations, among others. Secondary data was collected and analyzed to arrive at the overall market size, which was further validated through primary research. Industry associations such as SPAA Precision Agriculture (Australia), International Society for Precision Agriculture (ISPA) (US), Agricultural Research Organization (Israel), and PrecisionAg Institute (US) were referred to for this study. The precision planting market report uses both top-down and bottom-up approaches to estimate and validate the size of the precision planting market, as well as other dependent submarkets. Through secondary research, the key players in the precision planting market have been identified, and their market presence has been assessed. Based on secondary sources and verified by primary sources, all percentage shares, splits, and breakdowns have been calculated.

Primary Research

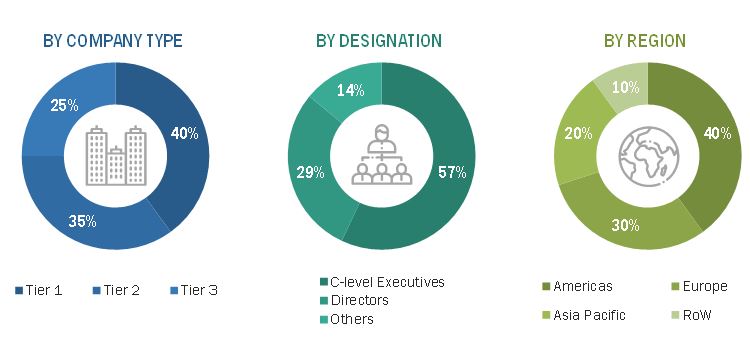
Extensive primary research has been conducted after acquiring an understanding of the precision planting market scenario through secondary research. Several primary interviews have been conducted with market experts from both the demand- (system deployment companies at farm level, agriculture input companies) and supply-side (precision planting hardware component manufacturers) players across four major regions, namely, Americas, Europe, Asia Pacific, and Rest of the World (Middle East & Africa). Approximately 70% and 30% of primary interviews have been conducted from the supply and demand side, respectively, Primary data has been collected through questionnaires, emails, and telephonic interviews. In the canvassing of primaries, various departments within organizations, such as sales. operations, and administration, were covered to provide a holistic viewpoint in our report.
Precision Planting Market Size, and Share

To know about the assumptions considered for the study, download the pdf brochure

Market Size Estimation

Both top-down and bottom-up approaches have been used to estimate and validate the total size of the precision planting market. These methods have also been extensively used to estimate the sizes of various market subsegments. The research methodology used to estimate the market sizes includes the following:

  • Identifying market for precision planting-based on hardware components (automation and control systems, sensing and monitoring devices, sensors, and cameras) in each country
  • Identifying the major applications of precision planting systems-related products, along with the types of hardware, software, and services required for various applications
  • Estimating the size of the market in each region by adding the sizes of country-wise markets
  • Tracking the ongoing and upcoming implementation of precision planting systems by various companies in each region and forecasting the size of the precision planting market based on these developments and other critical parameters
  • Arriving at the size of the global market by adding the sizes of region-wise markets

Global Precision Planting Market Size: Bottom-Up Approach

Precision Planting Market Size, and Bottom-Up Approach

Global Precision Planting Market Size: Top-Down Approach

Precision Planting Market Size, and Top-Down Approach

Data Triangulation

After arriving at the overall size of the precision planting market from the market size estimation process explained above, the total market has been split into several segments and subsegments. Data triangulation and market breakdown procedures have been employed, wherever applicable, to complete the overall market engineering process and arrive at the exact statistics for all segments and subsegments of the market. The data has been triangulated by studying various factors and trends from both the demand and supply sides. Along with this, the market size has been validated using both top-down and bottom-up approaches.

Report Objectives

  • To define, describe, and forecast the precision planting market, in terms of value, by offering, system type, drive type, application, and region
  • To describe and forecast the market for various hardware offerings under automation and control systems, in terms of volume
  • To forecast the market, for various segments with respect to 4 main regions—the Americas, Europe, Asia Pacific (APAC), and Rest of the World (RoW), in terms of value
  • To strategically analyze micromarkets with respect to individual growth trends, prospects, and contribution to the overall precision planting market
  • To provide detailed information regarding the major factors (drivers, restraints, opportunities, and challenges) influencing the precision planting market growth
  • To analyze opportunities in the market for various stakeholders by identifying the high-growth segments of the precision planting market
  • To study the complete value chain and allied industry segments, and perform a value chain analysis of the precision planting market landscape
  • To map competitive intelligence based on company profiles, key player strategies, and key developments
  • To strategically profile key players and comprehensively analyze their market ranking and core competencies
  • To track and analyze competitive developments such as joint ventures, mergers and acquisitions, product developments, and research and development (R&D) in the precision planting market

Available Customizations:

With the given market data, MarketsandMarkets offers customizations according to the company’s specific needs. The following customization options are available for the report:

Company Information:

  • Detailed analysis and profiling of additional market players based on various blocks of the value chain.
Custom Market Research Services

We will customize the research for you, in case the report listed above does not meet with your exact requirements. Our custom research will comprehensively cover the business information you require to help you arrive at strategic and profitable business decisions.

Request Customization

Instant Answers with GPT - Ask Now!

Ask real questions. Get complete answers !
Report Code
SE 7706
Published ON
Dec, 2022
Choose License Type
BUY NOW
  • SHARE
X
Request Customization
Speak to Analyst
Speak to Analyst
OR FACE-TO-FACE MEETING
PERSONALIZE THIS RESEARCH
  • Triangulate with your Own Data
  • Get Data as per your Format and Definition
  • Gain a Deeper Dive on a Specific Application, Geography, Customer or Competitor
  • Any level of Personalization
REQUEST A FREE CUSTOMIZATION
LET US HELP YOU!
  • What are the Known and Unknown Adjacencies Impacting the Precision Planting Market
  • What will your New Revenue Sources be?
  • Who will be your Top Customer; what will make them switch?
  • Defend your Market Share or Win Competitors
  • Get a Scorecard for Target Partners
CUSTOMIZED WORKSHOP REQUEST
knowledgestore logo

Want to explore hidden markets that can drive new revenue in Precision Planting Market?

Find Hidden Markets
  • Call Us
  • +1-888-600-6441 (Corporate office hours)
  • +1-888-600-6441 (US/Can toll free)
  • +44-800-368-9399 (UK office hours)
CONNECT WITH US
ABOUT TRUST ONLINE
©2024 MarketsandMarkets Research Private Ltd. All rights reserved
DMCA.com Protection Status
Website Feedback