POS Security Market by Offering (Solutions and Services), Organization Size (SMEs and Large Enterprises), Vertical (Retail, Restaurants, and Hospitality), and Region (North America, Europe, APAC, MEA, Latin America) - Global Forecast to 2027
Updated on : April 11, 2023
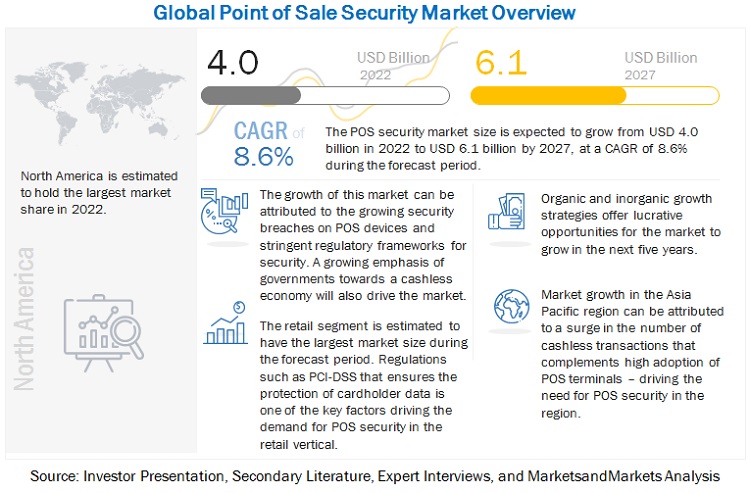
The global POS security market in terms of revenue was estimated to be worth $4.0 billion in 2022 and is poised to grow at a CAGR of 8.6% from 2022 to 2027.
An industry trend analysis of the market is part of the latest research report. The latest research study includes market buying trends, pricing analysis, patent analysis, conference and webinar materials, and important stakeholders. There has been a significant rise in the number of POS attacks in recent years. Organizations need to comply with data privacy and regulations to manage and protect POS systems which is expected to contribute to the growth in the deployment of POS security solution and services. There is a significant demand for POS security solutions and services across verticals such as retail, restaurants, and hospitality.
To know about the assumptions considered for the study, Request for Free Sample Report
POS Security Market Dynamics
Driver: Compliance with regulations
Organizations need to comply with the stipulations of data privacy and protection regulations to manage and protect POS systems. This includes the Payment Card Industry Data Security Standard (PCI DSS), which regulates security standards for any organization that handles credit cards. PCI DSS is mandated by financial organizations and administered by the PCI Security Standards Council, which is responsible for increasing cardholder data controls to reduce credit card fraud. It is a comprehensive set of standards that requires merchants and service providers that store, process, or transmit customer payment card data to adhere to strict information security controls and processes. Companies that process, store, and transmit cardholder data must understand the requirements set forth in the PCI standard, or they may face stiff financial penalties of up to USD 500,00 for being non-PCI compliant. Any retailer conducting business with the US consumers must follow PCI DSS data security standards to protect credit card and personal data. Other important regulatory bodies that affect retailers include GDPR (European Union) and the recent CCPA (applies to retailers conducting business in California).
Restraint: POS Security deployment issues
Enterprises today use an assortment of different security tools. Organizations use multiple endpoint security products, firewalls, or other security solutions from different vendors. These products were installed gradually - purchased using different budgets and are operated by different teams/ vendors. POS security’s value proposition assumes that organizations replace these existing solutions with a suite of integrated but proprietary products. Not all organizations are willing to rip and replace their existing solutions. This could act as a hindrance in the adoption of POS security solutions.
Opportunity: Cloud-based POS systems ensure data security
In a cloud-based POS system, all customer’s data is stored online. The responsibility of keeping customer and business data secure is passed on to the cloud POS system service provider. Cloud POS is more secure as all of the data storage and security will be handled by the POS in a remote and secure location. A secure cloud-based POS system will remove the burden of data management from the daily tasks, whereas traditional POS platforms are risky with data security, most notably when a business is required to host their own data server on the premises.
Challenge: Lack of awareness among employees for the use of POS systems
It is important to make sure that POS systems are only in the hands of trusted employees that are approved to use them. It is not critical to train every employee on the use of POS systems if they are not using it. It is essential to limit the use of POS systems to only those who have permission and are trustworthy. There are more issues when using a mobile POS device. If it is mobile, employees may make the mistake of taking the devices home. This could create issues related to the protection of sensitive data stored on the devices. Hence, security data is always at stake at such devices. It has become imperative for end user organization to invest in training employees to use the POS security systems.
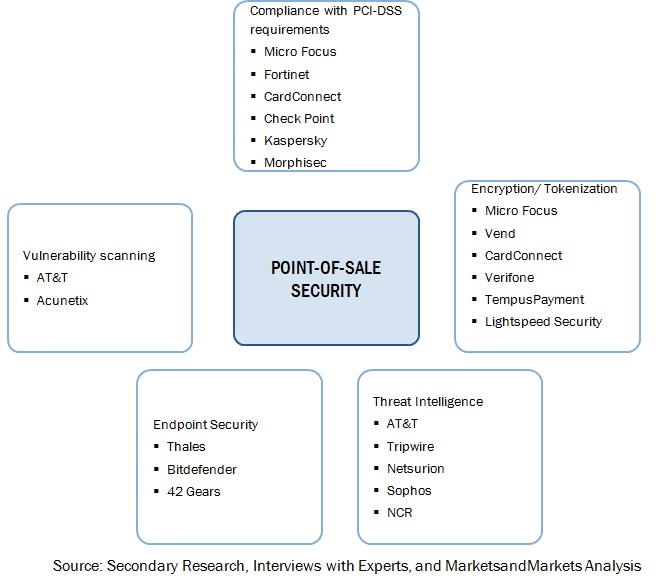
POS Security Market Ecosystem
To know about the assumptions considered for the study, download the pdf brochure
By offering, services to grow at a higher CAGR during the forecast period
The services segment includes various services that are required to deploy, execute, and maintain POS security solutions in organizations. The services offered by vendors in the POS security market assist the customers in efficiently using and maintaining POS security solutions. The services segment includes various services such as deployment and integration, training and education, and support and maintenance. As the adoption of solutions increases, the demand for services is also expected to increase. Some vendors offer security as an additional feature with the POS devices. Integrating a comprehensive and robust POS security framework is one of the basic and most important steps towards protecting sensitive information. The security architecture is designed keeping in mind the standards and compliances set by the government bodies and organizations. System integration involves integrating the POS system into the customer’s security system plan as per requirements and with minimum deviation.
By organization size, large enterprises to hold a larger market size during the forecast period
Large enterprises are witnessing a high adoption of POS security solutions. These enterprises possess the required finance and workforce to be able to implement the POS security solutions and services in their systems. Large enterprises possess a huge volume of data, which makes them attractive targets for cybersecurity attacks. Credit and debit card data theft is one of the most common forms of cybersecurity threats and is increasingly being done by targeting the POS systems. Large enterprises’ systems are often exposed to these threats due to weak security systems in their corporate IT infrastructure. These breaches take place either by gaining direct access to POS systems or through the corporate network by gaining access through a vulnerable public-facing server or spear phishing email, by which the attacker could traverse the network until they gain access to an entry point to the POS network. Products and solutions involving advanced technologies and the regulations set up by the governments of several countries are prompting large enterprises to adopt POS security solutions.
By vertical, retail to have the largest market size during the forecast period
In the recent years, retailers are increasingly deploying POS systems to increase the efficiency of their operations. The retail vertical consists of supermarkets/hypermarkets, grocery stores, specialty stores, convenience stores, gas stations, discount stores, department stores, among others. Greater convenience comes through better connectivity between retailers and customers across multiple checkpoints. However, this has also led to an increase in the attacks on the POS systems by hackers to steal the PII and payment card information. Moreover, regulatory compliances by the central banks and governments of several countries, including the PCI DSS, has prompted the retail trade owners to adopt POS security products and solutions. POS security vendors are increasingly offering solutions in the retail industry. Sophos’ unique security ecosystem offers robust cybersecurity to retail. It simplifies compliance with stringent regulatory mandates and industry practices especially when data privacy regulations are increasing the compliance burden on retailers.
By region, North America to have the largest market size during the forecast period
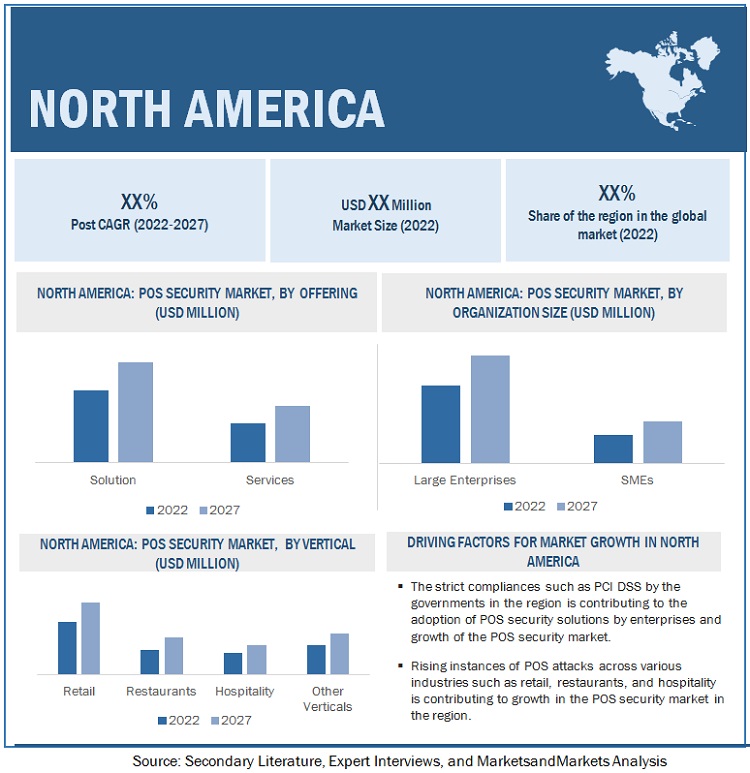
North America is expected to be the largest contributor, in terms of the market size in the global POS security market. A technologically advanced region, North America has the presence of the largest number of POS security market vendors among all the regions considered. The region is witnessing an increased use of electronic payment mechanisms, such as automated clearing house (ACH), ATM and POS networks. The expansion of online POS terminals and the widespread acceptance of credit and debit cards at retail establishments have presented consumers with significant payment alternatives. The attacks on POS systems have led to growth in the adoption of POS security systems in the region. The growing concerns for the protection of sensitive payment data have increased government intervention over the years. Various security-related regulatory compliances control the protection of the POS systems in the North America region. The Electronic Fund Transfer Act (EFTA) of 1978 is intended to protect individual consumers engaging in Electronic Fund Transfers (EFT’s), which also includes point-of-sale terminals. The PCI DSS, and other regulatory compliances help organizations in protecting the sensitive data of their customers. With the new requirements for terminal certification, TA 7.2 and DC POS 3.0, the operation of POS terminals is additionally secured and standardized. All these factors are expected to boost the growth of the POS security market.
POS Security Market - Key Players:
The key players in the global POS security market include Oracle (US), Micro Focus (UK), NCR (US), Fortinet (US), Verifone (US), PayPal (US), Check Point (US), CardConnect (US), Morphisec (US), Kaspersky (Switzerland), Sophos (UK), Thales (France), Upserve (US), Tripwire (US), Elavon (US), TempusPayment (US), Bluefin (US), SquareUp (US), Acunetix (Malta), Vend (New Zealand), TokenEx (US), BPAPOS (US), TeskaLabs (UK), Clover (US), Helcim (Canada), and Hideez (US).
Scope of the Report
|
Report Metrics |
Details |
|
Market size available for years |
2016–2027 |
|
Base year considered |
2021 |
|
Forecast period |
2022–2027 |
|
Forecast units |
Value (USD) |
|
Segments covered |
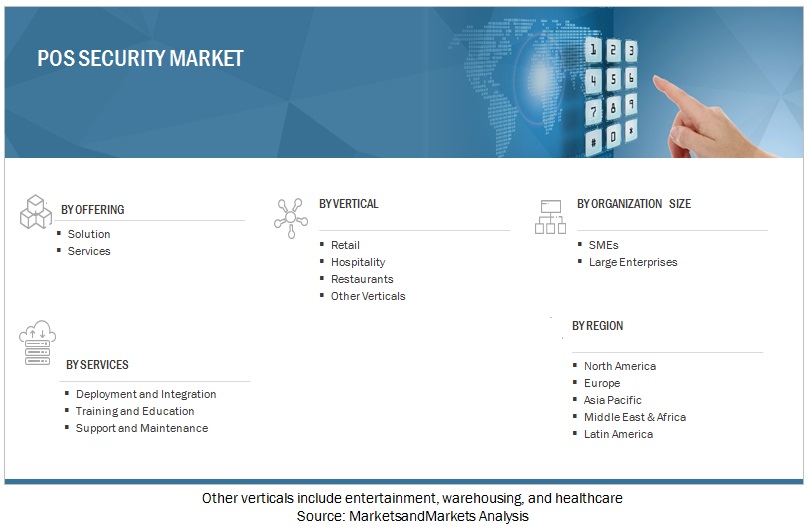
Offering, Services, Organization Size, and Vertical |
|
Geographies covered |
North America, Europe, Asia Pacific, Middle East & Africa (MEA), and Latin America |
|
Major companies covered |
Oracle (US), Micro Focus (UK), NCR (US), Fortinet (US), Verifone (US), PayPal (US), Check Point (US), CardConnect (US), Morphisec (US), Kaspersky (Switzerland), Sophos (UK), Thales (France), Upserve (US), Tripwire (US), Elavon (US), TempusPayment (US), Bluefin (US), SquareUp (US), Acunetix (Malta), Vend (New Zealand), TokenEx (US), BPAPOS (US), TeskaLabs (UK), Clover (US), Helcim (Canada), and Hideez (US) |
Market Segmentation:

Recent Developments
- In November 2021, CyberRes, a Micro Focus line of business announced the release of Voltage SecureData Services, which is a cloud native data protection offering that allows data security solutions to be deployed within business applications, in the cloud. The offering includes leading pseudonymization and anonymization of sensitive personal data, including personally identifiable information (PII), protected health information (PHI), payment card industry (PCI) data and more with its tokenization, Format Preserving encryption (FPE) and Format Preserving Hashing (FPH).
- In August 2021, NCR announced the acquisition of Foremost Business Systems, a POS and restaurant solutions provider in Minneapolis. This transaction further expands the reach of NCR’s restaurant technology which includes solutions such as the signature NCR Aloha POS platform and NCR Aloha Essentials subscription package. The integration of the Foremost Business Systems team into the NCR local office network accelerates NCR’s ability to bring innovative solutions to Minnesota and Western Wisconsin.
- In May 2022, Verifone and Lavu announced partnership to provide unified payments and point of sale solutions to restaurants. Lavu, a major global restaurant software and payments solution provider and Verifone announced a new cross distribution partnership that will integrate Lavu’s all-in-one restaurant software suite with Verifone’s FLEX payment solution, including its Advanced Payments Methods platform.
Frequently Asked Questions (FAQ):
What is the definition of Point of Sale (POS) Security?
According to MarketsandMarkets, POS security ensures that POS system – when used by end users for purchases and transactions, are ‘secure’. POS security measures are imperative to prevent unauthorized users from accessing the electronic payments system, thus protecting a business’ and customers’ sensitive data such as credit card information from theft or fraud.
What is the projected market value of the global POS Security market?
The global POS security market size is expected to grow from an estimated value of USD 4.0 billion in 2022 to USD 6.1 billion by 2027, at a Compound Annual Growth Rate (CAGR) of 8.6% from 2022 to 2027.
Who are the key companies influencing the market growth of POS Security market?
Oracle, Micro Focus, NCR, Fortinet, Verifone, PayPal, Check Point, CardConnect, Morphisec, Kaspersky, Sophos, and Thales are the key vendors in the POS security market and are recognized as the star players. These companies account for a major share of the POS security market. They offer wide solutions related to POS security solutions and services. These vendors offer customized solutions per user requirements and adopting growth strategies to consistently achieve the desired growth and make their presence in the market.
Who are the emerging start-ups/SMEs that are supporting significantly in the market growth?
Helcim, TeskaLabs, Clover, and Hideez are few of the emerging start-ups that are nurturing the market growth with their technical skills and expertise. These startups focus on developing product/service portfolios and bringing innovations to the market compared to their competitors. .
To speak to our analyst for a discussion on the above findings, click Speak to Analyst

TABLE OF CONTENTS
1 INTRODUCTION (Page No. - 24)
1.1 STUDY OBJECTIVES
1.2 MARKET DEFINITION
1.2.1 INCLUSIONS AND EXCLUSIONS
1.3 STUDY SCOPE
1.3.1 MARKET SEGMENTATION
1.3.2 REGIONS COVERED
1.4 YEARS CONSIDERED
1.5 CURRENCY CONSIDERED
TABLE 1 USD EXCHANGE RATES, 2018–2022
1.6 STAKEHOLDERS
2 RESEARCH METHODOLOGY (Page No. - 29)
2.1 RESEARCH DATA
FIGURE 1 POS SECURITY MARKET: RESEARCH DESIGN
2.1.1 SECONDARY DATA
2.1.2 PRIMARY DATA
2.1.2.1 Breakdown of primary interviews
2.1.2.2 Key industry insights
2.2 DATA TRIANGULATION
FIGURE 2 MARKET: RESEARCH FLOW
2.3 MARKET SIZE ESTIMATION
2.3.1 REVENUE ESTIMATES
FIGURE 3 MARKET SIZE ESTIMATION METHODOLOGY: APPROACH 1 (SUPPLY SIDE): REVENUE OF SOLUTIONS/SERVICES OF POS SECURITY VENDORS
FIGURE 4 MARKET SIZE ESTIMATION METHODOLOGY: APPROACH 1 (SUPPLY SIDE)
FIGURE 5 MARKET SIZE ESTIMATION METHODOLOGY, APPROACH 2, BOTTOM-UP (SUPPLY SIDE): COLLECTIVE REVENUE FROM ALL SOLUTIONS AND SERVICES OF POS SECURITY VENDORS
2.3.2 DEMAND-SIDE ANALYSIS
FIGURE 6 MARKET SIZE ESTIMATION METHODOLOGY: APPROACH 3, TOP-DOWN (DEMAND SIDE)
2.4 COMPANY EVALUATION QUADRANT METHODOLOGY
FIGURE 7 COMPANY EVALUATION QUADRANT: CRITERIA WEIGHTAGE
2.5 STARTUPS EVALUATION QUADRANT METHODOLOGY
FIGURE 8 STARTUP EVALUATION QUADRANT: CRITERIA WEIGHTAGE
2.6 MARKET FORECAST
TABLE 2 FACTOR ANALYSIS
2.7 RESEARCH ASSUMPTIONS
2.8 LIMITATIONS AND RISK ASSESSMENT
3 EXECUTIVE SUMMARY (Page No. - 41)
TABLE 3 POS SECURITY MARKET SIZE AND GROWTH, 2022–2027 (USD MILLION, Y-O-Y GROWTH)
FIGURE 9 GLOBAL MARKET EXPECTED TO WITNESS SIGNIFICANT GROWTH DURING FORECAST PERIOD
FIGURE 10 NORTH AMERICA EXPECTED TO ACCOUNT FOR LARGEST MARKET SHARE IN 2022
FIGURE 11 FASTEST-GROWING SEGMENTS OF MARKET
4 PREMIUM INSIGHTS (Page No. - 44)
4.1 BRIEF OVERVIEW OF POS SECURITY MARKET
FIGURE 12 INCREASING SECURITY BREACH INCIDENTS ON POS DEVICES AND REGULATORY COMPLIANCES EXPECTED TO DRIVE DEMAND FOR MARKET
4.2 MARKET, BY OFFERING, 2022
FIGURE 13 SOLUTIONS SEGMENT EXPECTED TO ACCOUNT FOR LARGER MARKET SHARE DURING FORECAST PERIOD
4.3 MARKET, BY SERVICES, 2022
FIGURE 14 DEPLOYMENT AND INTEGRATION SEGMENT EXPECTED TO ACCOUNT FOR LARGEST MARKET SHARE DURING FORECAST PERIOD
4.4 MARKET, BY ORGANIZATION SIZE, 2022
FIGURE 15 SMES SEGMENT EXPECTED TO ACCOUNT FOR LARGER MARKET SIZE DURING FORECAST PERIOD
4.5 MARKET, BY VERTICAL, 2022
FIGURE 16 RETAIL SEGMENT EXPECTED TO ACCOUNT FOR LARGEST MARKET SIZE DURING FORECAST PERIOD
4.6 MARKET INVESTMENT SCENARIO
FIGURE 17 ASIA PACIFIC EXPECTED TO EMERGE AS SIGNIFICANT MARKET FOR INVESTMENTS IN NEXT FIVE YEARS
5 MARKET OVERVIEW AND INDUSTRY TRENDS (Page No. - 47)
5.1 INTRODUCTION
FIGURE 18 DRIVERS, RESTRAINTS, OPPORTUNITIES, AND CHALLENGES: POS SECURITY MARKET
5.1.1 DRIVERS
5.1.1.1 Growing scale of data breaches involving POS systems
5.1.1.2 Need for compliance with regulations
5.1.2 RESTRAINTS
5.1.2.1 Issues with traditional POS protection approach
5.1.2.2 POS security deployment issues
5.1.3 OPPORTUNITIES
5.1.3.1 Rise in cybercrimes
5.1.3.2 Growing need for data security
5.1.3.3 Rising penetration of eCommerce platforms
FIGURE 19 GLOBAL RETAIL ECOMMERCE SALES, 2014-2019 (USD TRILLION)
5.1.4 CHALLENGES
5.1.4.1 Lack of awareness among employees using POS systems
5.2 VALUE CHAIN ANALYSIS
FIGURE 20 VALUE CHAIN ANALYSIS: POS SECURITY MARKET
5.3 POS SECURITY ECOSYSTEM ANALYSIS
FIGURE 21 ECOSYSTEM OF MARKET
5.4 MARKET: PATENT ANALYSIS
FIGURE 22 MARKET: PATENT ANALYSIS
TABLE 4 RELATED PATENTS
5.5 PRICING ANALYSIS: MARKET
TABLE 5 RETAIL POS SYSTEMS: AVERAGE PRICING TRENDS
TABLE 6 MARKET: PRICING ANALYSIS
5.6 TECHNOLOGY ANALYSIS
5.6.1 ARTIFICIAL INTELLIGENCE
5.6.2 NEAR-FIELD COMMUNICATION
5.7 USE CASES
5.7.1 MULTI-NATIONAL PHARMACY RETAILER CHOSE MICRO FOCUS’ SOLUTION TO ENSURE POS SECURITY
5.7.2 PACIFIC COFFEE SELECTED CHECKPOINT TO DEPLOY POS SECURITY SOLUTION
5.7.3 A.F. BLAKEMORE CHOSE KASPERSKY’S ENDPOINT SECURITY SOLUTION TO COMBAT POS THREATS
5.8 MARKET DISRUPTIONS
FIGURE 23 POS SECURITY MARKET: TRENDS AND DISRUPTIONS IMPACTING CUSTOMERS
5.9 PORTER’S FIVE FORCES ANALYSIS
TABLE 7 IMPACT OF PORTER’S FIVE FORCES ON MARKET
5.9.1 THREAT OF NEW ENTRANTS
5.9.2 THREAT OF SUBSTITUTES
5.9.3 BARGAINING POWER OF SUPPLIERS
5.9.4 BARGAINING POWER OF BUYERS
5.9.5 INTENSITY OF COMPETITIVE RIVALRY
5.10 REGULATORY LANDSCAPE
5.10.1 PAYMENT CARD INDUSTRY-DATA SECURITY STANDARD
5.10.2 FEDERAL INFORMATION SECURITY MANAGEMENT ACT
5.10.3 INTERNATIONAL ORGANIZATION FOR STANDARDIZATION, 10536
5.10.4 INTERNATIONAL ORGANIZATION FOR STANDARDIZATION, 14443
5.10.5 REGULATORY BODIES, GOVERNMENT AGENCIES, AND OTHER ORGANIZATIONS
TABLE 8 LIST OF REGULATORY BODIES, GOVERNMENT AGENCIES, AND OTHER ORGANIZATIONS
6 POS SECURITY MARKET, BY OFFERING (Page No. - 61)
6.1 INTRODUCTION
FIGURE 24 SERVICES SEGMENT EXPECTED TO GROW AT HIGHER CAGR DURING FORECAST PERIOD
TABLE 9 MARKET, BY OFFERING, 2016–2021 (USD MILLION)
TABLE 10 MARKET, BY OFFERING, 2022–2027 (USD MILLION)
6.2 SOLUTIONS
6.2.1 SOLUTIONS: MARKET DRIVERS
TABLE 11 SOLUTIONS: MARKET, BY REGION, 2016–2021 USD MILLION)
TABLE 12 SOLUTIONS: MARKET, BY REGION, 2022–2027 (USD MILLION)
6.3 SERVICES
6.3.1 SERVICES: MARKET DRIVERS
FIGURE 25 TRAINING AND EDUCATION SEGMENT EXPECTED TO REGISTER HIGHEST CAGR DURING FORECAST PERIOD
TABLE 13 SERVICES: MARKET, BY REGION, 2016–2021 USD MILLION)
TABLE 14 SERVICES: MARKET, BY REGION, 2022–2027 (USD MILLION)
TABLE 15 POS SECURITY MARKET, BY SERVICES, 2016–2021 USD MILLION)
TABLE 16 MARKET, BY SERVICES, 2022–2027 (USD MILLION)
6.3.2 DEPLOYMENT AND INTEGRATION
TABLE 17 DEPLOYMENT AND INTEGRATION: MARKET, BY REGION, 2016–2021 USD MILLION)
TABLE 18 DEPLOYMENT AND INTEGRATION: MARKET, BY REGION, 2022–2027 (USD MILLION)
6.3.3 TRAINING AND EDUCATION
TABLE 19 TRAINING AND EDUCATION: MARKET, BY REGION, 2016–2021 USD MILLION)
TABLE 20 TRAINING AND EDUCATION: MARKET, BY REGION, 2022–2027 (USD MILLION)
6.3.4 SUPPORT AND MAINTENANCE
TABLE 21 SUPPORT AND MAINTENANCE: MARKET, BY REGION, 2016–2021 USD MILLION)
TABLE 22 SUPPORT AND MAINTENANCE: MARKET, BY REGION, 2022–2027 (USD MILLION)
7 POS SECURITY MARKET, BY ORGANIZATION SIZE (Page No. - 70)
7.1 INTRODUCTION
FIGURE 26 SMALL AND MEDIUM-SIZED BUSINESSES SEGMENT EXPECTED TO REGISTER HIGHER CAGR DURING FORECAST PERIOD
TABLE 23 MARKET, BY ORGANIZATION SIZE, 2016–2021 (USD MILLION)
TABLE 24 MARKET, BY ORGANIZATION SIZE, 2022–2027 (USD MILLION)
7.2 SMALL AND MEDIUM-SIZED ENTERPRISES
7.2.1 SMALL AND MEDIUM-SIZED ENTERPRISES: MARKET DRIVERS
TABLE 25 SMALL AND MEDIUM-SIZED ENTERPRISES: MARKET, BY REGION, 2016–2021 (USD MILLION)
TABLE 26 SMALL AND MEDIUM-SIZED ENTERPRISES: MARKET, BY REGION, 2022–2027 (USD MILLION)
7.3 LARGE ENTERPRISES
7.3.1 LARGE ENTERPRISES: MARKET DRIVERS
TABLE 27 LARGE ENTERPRISES: MARKET, BY REGION, 2016–2021 (USD MILLION)
TABLE 28 LARGE ENTERPRISES: MARKET, BY REGION, 2022–2027 (USD MILLION)
8 POS SECURITY MARKET, BY VERTICAL (Page No. - 75)
8.1 INTRODUCTION
FIGURE 27 RESTAURANTS SEGMENT EXPECTED TO REGISTER HIGHEST CAGR DURING FORECAST PERIOD
TABLE 29 MARKET, BY VERTICAL, 2016–2021 (USD MILLION)
TABLE 30 MARKET, BY VERTICAL, 2022–2027 (USD MILLION)
8.2 RETAIL
8.2.1 RETAIL: MARKET DRIVERS
TABLE 31 RETAIL: MARKET, BY REGION, 2016–2021 (USD MILLION)
TABLE 32 RETAIL: MARKET, BY REGION, 2022–2027 (USD MILLION)
8.3 RESTAURANTS
8.3.1 RESTAURANTS: MARKET DRIVERS
TABLE 33 RESTAURANTS: MARKET, BY REGION, 2016–2021 (USD MILLION)
TABLE 34 RESTAURANTS: MARKET, BY REGION, 2022–2027 (USD MILLION)
8.4 HOSPITALITY
8.4.1 HOSPITALITY: MARKET DRIVERS
TABLE 35 HOSPITALITY: MARKET, BY REGION, 2016–2021 (USD MILLION)
TABLE 36 HOSPITALITY: MARKET, BY REGION, 2022–2027 (USD MILLION)
8.5 OTHER VERTICALS
TABLE 37 OTHER VERTICALS: MARKET, BY REGION, 2016–2021 (USD MILLION)
TABLE 38 OTHER VERTICALS: MARKET, BY REGION, 2022–2027 (USD MILLION)
9 POS SECURITY MARKET, BY REGION (Page No. - 83)
9.1 INTRODUCTION
FIGURE 28 ASIA PACIFIC EXPECTED TO GROW AT HIGHEST CAGR DURING FORECAST PERIOD
TABLE 39 MARKET, BY REGION, 2016–2021 (USD MILLION)
TABLE 40 MARKET, BY REGION, 2022–2027 (USD MILLION)
9.2 NORTH AMERICA
9.2.1 NORTH AMERICA: MARKET DRIVERS
9.2.2 NORTH AMERICA: REGULATORY LANDSCAPE
FIGURE 29 NORTH AMERICA: MARKET SNAPSHOT
TABLE 41 NORTH AMERICA: POS SECURITY MARKET, BY OFFERING, 2016–2021 (USD MILLION)
TABLE 42 NORTH AMERICA: MARKET, BY OFFERING, 2022–2027 (USD MILLION)
TABLE 43 NORTH AMERICA: MARKET, BY SERVICES, 2016–2021 (USD MILLION)
TABLE 44 NORTH AMERICA: MARKET, BY SERVICES, 2022–2027 (USD MILLION)
TABLE 45 NORTH AMERICA: MARKET, BY ORGANIZATION SIZE, 2016–2021 (USD MILLION)
TABLE 46 NORTH AMERICA: MARKET, BY ORGANIZATION SIZE, 2022–2027 (USD MILLION)
TABLE 47 NORTH AMERICA: MARKET, BY VERTICAL, 2016–2021 (USD MILLION)
TABLE 48 NORTH AMERICA: MARKET, BY VERTICAL, 2022–2027 (USD MILLION)
9.3 EUROPE
9.3.1 EUROPE: POS SECURITY MARKET DRIVERS
9.3.2 EUROPE: REGULATORY LANDSCAPE
TABLE 49 EUROPE: MARKET, BY OFFERING, 2016–2021 (USD MILLION)
TABLE 50 EUROPE: MARKET, BY OFFERING, 2022–2027 (USD MILLION)
TABLE 51 EUROPE: MARKET, BY SERVICES, 2016–2021 (USD MILLION)
TABLE 52 EUROPE: MARKET, BY SERVICES, 2022–2027 (USD MILLION)
TABLE 53 EUROPE: MARKET, BY ORGANIZATION SIZE, 2016–2021 (USD MILLION)
TABLE 54 EUROPE: MARKET, BY ORGANIZATION SIZE, 2022–2027 (USD MILLION)
TABLE 55 EUROPE: MARKET, BY VERTICAL, 2016–2021 (USD MILLION)
TABLE 56 EUROPE: MARKET, BY VERTICAL, 2022–2027 (USD MILLION)
9.4 ASIA PACIFIC
9.4.1 ASIA PACIFIC: POS SECURITY MARKET DRIVERS
9.4.2 ASIA PACIFIC: REGULATORY LANDSCAPE
FIGURE 30 ASIA PACIFIC: MARKET SNAPSHOT
TABLE 57 ASIA PACIFIC: MARKET, BY OFFERING, 2016–2021 (USD MILLION)
TABLE 58 ASIA PACIFIC: MARKET, BY OFFERING, 2022–2027 (USD MILLION)
TABLE 59 ASIA PACIFIC: MARKET, BY SERVICES, 2016–2021 (USD MILLION)
TABLE 60 ASIA PACIFIC: MARKET, BY SERVICES, 2022–2027 (USD MILLION)
TABLE 61 ASIA PACIFIC: MARKET, BY ORGANIZATION SIZE, 2016–2021 (USD MILLION)
TABLE 62 ASIA PACIFIC: MARKET, BY ORGANIZATION SIZE, 2022–2027 (USD MILLION)
TABLE 63 ASIA PACIFIC: MARKET, BY VERTICAL, 2016–2021 (USD MILLION)
TABLE 64 ASIA PACIFIC: MARKET, BY VERTICAL, 2022–2027 (USD MILLION)
9.5 MIDDLE EAST AND AFRICA
9.5.1 MIDDLE EAST AND AFRICA: POS SECURITY MARKET DRIVERS
9.5.2 MIDDLE EAST AND AFRICA: REGULATORY LANDSCAPE
TABLE 65 MIDDLE EAST AND AFRICA: MARKET, BY OFFERING, 2016–2021 (USD MILLION)
TABLE 66 MIDDLE EAST AND AFRICA: MARKET, BY OFFERING, 2022–2027 (USD MILLION)
TABLE 67 MIDDLE EAST AND AFRICA: MARKET, BY SERVICES, 2016–2021 (USD MILLION)
TABLE 68 MIDDLE EAST AND AFRICA: MARKET, BY SERVICES, 2022–2027 (USD MILLION)
TABLE 69 MIDDLE EAST AND AFRICA: MARKET, BY ORGANIZATION SIZE, 2016–2021 (USD MILLION)
TABLE 70 MIDDLE EAST AND AFRICA: MARKET, BY ORGANIZATION SIZE, 2022–2027 (USD MILLION)
TABLE 71 MIDDLE EAST AND AFRICA: MARKET, BY VERTICAL, 2016–2021 (USD MILLION)
TABLE 72 MIDDLE EAST AND AFRICA: MARKET, BY VERTICAL, 2022–2027 (USD MILLION)
9.6 LATIN AMERICA
9.6.1 LATIN AMERICA: POS SECURITY MARKET DRIVERS
9.6.2 LATIN AMERICA: REGULATORY LANDSCAPE
TABLE 73 LATIN AMERICA: MARKET, BY OFFERING, 2016–2021 (USD MILLION)
TABLE 74 LATIN AMERICA: MARKET, BY OFFERING, 2022–2027 (USD MILLION)
TABLE 75 LATIN AMERICA: MARKET, BY SERVICES, 2016–2021 (USD MILLION)
TABLE 76 LATIN AMERICA: MARKET, BY SERVICES, 2022–2027 (USD MILLION)
TABLE 77 LATIN AMERICA: MARKET, BY ORGANIZATION SIZE, 2016–2021 (USD MILLION)
TABLE 78 LATIN AMERICA: MARKET, BY ORGANIZATION SIZE, 2022–2027 (USD MILLION)
TABLE 79 LATIN AMERICA: MARKET, BY VERTICAL, 2016–2021 (USD MILLION)
TABLE 80 LATIN AMERICA: MARKET, BY VERTICAL, 2022–2027 (USD MILLION)
10 COMPETITIVE LANDSCAPE (Page No. - 106)
10.1 OVERVIEW
10.2 HISTORICAL REVENUE ANALYSIS OF KEY PLAYERS
FIGURE 31 FIVE-YEAR REVENUE ANALYSIS OF KEY POS SECURITY VENDORS, 2017-2021 (USD MILLION)
10.3 MARKET SHARE ANALYSIS, 2022
FIGURE 32 POS SECURITY MARKET: REVENUE ANALYSIS
10.4 MARKET STRUCTURE
TABLE 81 MARKET: DEGREE OF COMPETITION
10.5 RANKING OF KEY PLAYERS
FIGURE 33 RANKING OF KEY MARKET PLAYERS
10.6 MARKET EVALUATION FRAMEWORK
FIGURE 34 MARKET EVALUATION FRAMEWORK, 2020-2022
10.7 COMPANY EVALUATION QUADRANT FOR KEY PLAYERS
10.7.1 COMPANY EVALUATION QUADRANT MATRIX
TABLE 82 EVALUATION CRITERIA
10.7.2 STARS
10.7.3 EMERGING LEADERS
10.7.4 PERVASIVE PLAYERS
10.7.5 PARTICIPANTS
FIGURE 35 POS SECURITY MARKET: COMPANY EVALUATION QUADRANT FOR KEY PLAYERS
10.8 COMPETITIVE BENCHMARKING
10.8.1 COMPANY FOOTPRINT
FIGURE 36 COMPANY FOOTPRINT OF MAJOR PLAYERS IN MARKET
10.9 STARTUP/SME EVALUATION QUADRANT
10.9.1 PROGRESSIVE COMPANIES
10.9.2 RESPONSIVE COMPANIES
10.9.3 DYNAMIC COMPANIES
10.9.4 STARTING BLOCKS
FIGURE 37 POS SECURITY MARKET: STARTUP/SME EVALUATION QUADRANT
10.10 COMPETITIVE BENCHMARKING FOR STARTUPS/SMES
TABLE 83 MARKET: LIST OF STARTUPS/SMES
TABLE 84 MARKET: COMPETITIVE BENCHMARKING OF STARTUPS/SMES
10.11 COMPETITIVE SCENARIO
10.11.1 RECENT DEVELOPMENTS
TABLE 85 MARKET: PRODUCT LAUNCHES, 2017-2022
TABLE 86 MARKET: DEALS, 2018-2022
11 COMPANY PROFILES (Page No. - 119)
(Business Overview, Products/Solutions/Services Offered, Recent Developments, MnM view (Key strengths/Right to win, Strategic choices made, Weakness/competitive threats)*
11.1 KEY PLAYERS
11.1.1 ORACLE
11.1.1.1 Business overview
TABLE 87 ORACLE: BUSINESS OVERVIEW
FIGURE 38 ORACLE: COMPANY SNAPSHOT
11.1.1.2 Products offered
TABLE 88 ORACLE: PRODUCTS/SOLUTIONS OFFERED
TABLE 89 ORACLE: SERVICES OFFERED
11.1.1.3 Recent developments
TABLE 90 ORACLE: DEALS
11.1.1.4 MnM view
11.1.1.4.1 Key strengths/Right to win
11.1.1.4.2 Strategic choices made
11.1.1.4.3 Weaknesses and competitive threats
11.1.2 MICRO FOCUS
11.1.2.1 Business overview
TABLE 91 MICRO FOCUS: BUSINESS OVERVIEW
FIGURE 39 MICRO FOCUS: COMPANY SNAPSHOT
11.1.2.2 Products/Solutions/Services offered
TABLE 92 MICRO FOCUS: PRODUCTS/SOLUTIONS OFFERED
TABLE 93 MICRO FOCUS: SERVICES OFFERED
11.1.2.3 Recent developments
TABLE 94 MICRO FOCUS: PRODUCT LAUNCHES/ENHANCEMENTS
TABLE 95 MICRO FOCUS: DEALS
11.1.2.4 MNM view
11.1.2.4.1 Key strengths/Right to win
11.1.2.4.2 Strategic choices made
11.1.2.4.3 Weaknesses and competitive threats
11.1.3 NCR
11.1.3.1 Business overview
TABLE 96 NCR: BUSINESS OVERVIEW
FIGURE 40 NCR: COMPANY SNAPSHOT
11.1.3.2 Products/Solutions/Services offered
TABLE 97 NCR: PRODUCTS/SOLUTIONS OFFERED
11.1.3.3 Recent developments
TABLE 98 NCR: DEALS
11.1.3.4 MnM view
11.1.3.4.1 Key strengths/Right to win
11.1.3.4.2 Strategic choices made
11.1.3.4.3 Weaknesses and competitive threats
11.1.4 FORTINET
11.1.4.1 Business overview
TABLE 99 FORTINET: BUSINESS OVERVIEW
FIGURE 41 FORTINET: COMPANY SNAPSHOT
11.1.4.2 Products/Solutions/Services offered
TABLE 100 FORTINET: PRODUCTS/SOLUTIONS OFFERED
TABLE 101 FORTINET: SERVICES OFFERED
11.1.4.3 Recent developments
TABLE 102 FORTINET: PRODUCT LAUNCHES/ENHANCEMENTS
TABLE 103 FORTINET: DEALS
11.1.5 VERIFONE
11.1.5.1 Business overview
TABLE 104 VERIFONE: BUSINESS OVERVIEW
11.1.5.2 Products/Solutions/Services offered
TABLE 105 VERIFONE: PRODUCTS/SOLUTIONS OFFERED
11.1.5.3 Recent developments
TABLE 106 VERIFONE: DEALS
11.1.6 PAYPAL
11.1.6.1 Business overview
TABLE 107 PAYPAL: BUSINESS OVERVIEW
FIGURE 42 PAYPAL: COMPANY SNAPSHOT
11.1.6.2 Products/Solutions/Services offered
TABLE 108 PAYPAL: PRODUCTS/SOLUTIONS OFFERED
11.1.6.3 Recent developments
TABLE 109 PAYPAL: PRODUCT LAUNCHES/ENHANCEMENTS
11.1.7 CHECK POINT
11.1.7.1 Business overview
TABLE 110 CHECK POINT: BUSINESS OVERVIEW
FIGURE 43 CHECK POINT: COMPANY SNAPSHOT
11.1.7.2 Products/Solutions/Services offered
TABLE 111 CHECK POINT: PRODUCTS/SOLUTIONS OFFERED
TABLE 112 CHECK POINT: SERVICES OFFERED
11.1.7.3 Recent developments
TABLE 113 CHECK POINT: PRODUCT LAUNCHES/ENHANCEMENTS
11.1.8 CARDCONNECT
11.1.8.1 Business overview
TABLE 114 CARDCONNECT: BUSINESS OVERVIEW
11.1.8.2 Products/Solutions/Services offered
TABLE 115 CARDCONNECT: PRODUCTS/SOLUTIONS OFFERED
TABLE 116 CARDCONNECT: SERVICES OFFERED
11.1.8.3 Recent developments
TABLE 117 CARDCONNECT: PRODUCT LAUNCHES/ENHANCEMENTS
TABLE 118 CARDCONNECT: DEALS
11.1.9 MORPHISEC
11.1.9.1 Business overview
TABLE 119 MORPHISEC: BUSINESS OVERVIEW
11.1.9.2 Products/Solutions/Services offered
TABLE 120 MORPHISEC: PRODUCTS/SOLUTIONS OFFERED
11.1.9.3 Recent developments
TABLE 121 MORPHISEC: PRODUCT LAUNCHES/ENHANCEMENTS
TABLE 122 MORPHISEC: DEALS
11.1.10 KASPERSKY
11.1.10.1 Business overview
TABLE 123 KASPERSKY: BUSINESS OVERVIEW
11.1.10.2 Products/Solutions/Services offered
TABLE 124 KASPERSKY: PRODUCTS/SOLUTIONS OFFERED
TABLE 125 KASPERSKY: SERVICES OFFERED
11.1.11 SOPHOS
11.1.11.1 Business overview
TABLE 126 SOPHOS: BUSINESS OVERVIEW
11.1.11.2 Products/Solutions/Services offered
TABLE 127 SOPHOS: PRODUCTS/SOLUTIONS OFFERED
11.1.11.3 Recent developments
TABLE 128 SOPHOS: PRODUCT LAUNCHES/ENHANCEMENTS
TABLE 129 SOPHOS: DEALS
11.1.12 THALES
11.1.12.1 Business overview
TABLE 130 THALES: BUSINESS OVERVIEW
FIGURE 44 THALES: COMPANY SNAPSHOT
11.1.12.2 Products/Solutions/Services offered
TABLE 131 THALES: PRODUCTS/SOLUTIONS OFFERED
*Details on Business Overview, Products/Solutions/Services Offered, Recent Developments, MnM view
(Key strengths/Right to win, Strategic choices made, Weakness/competitive threats)* might not be captured in case of unlisted companies.
11.2 OTHER PLAYERS
11.2.1 UPSERVE
11.2.2 TRIPWIRE
11.2.3 ELAVON
11.2.4 TEMPUSPAYMENT
11.2.5 BLUEFIN
11.2.6 SQUAREUP
11.2.7 ACUNETIX
11.2.8 VEND
11.2.9 TOKENEX
11.2.10 BPAPOS
11.3 STARTUPS
11.3.1 TESKALABS
11.3.2 CLOVER
11.3.3 HELCIM
11.3.4 HIDEEZ
12 ADJACENT MARKETS (Page No. - 162)
12.1 INTRODUCTION
TABLE 132 ADJACENT MARKETS AND FORECASTS
12.2 LIMITATIONS
12.3 RETAIL POS MARKET
TABLE 133 RETAIL POS MARKET, BY COMPONENT, 2014–2019 (USD MILLION)
TABLE 134 RETAIL POS MARKET, BY COMPONENT, 2019–2026 (USD MILLION)
TABLE 135 RETAIL POS MARKET, BY END USER, 2014–2019 (USD MILLION)
TABLE 136 RETAIL POS MARKET, BY END USER, 2019–2026 (USD MILLION)
12.4 PAYMENT SECURITY MARKET
TABLE 137 PAYMENT SECURITY MARKET, BY COMPONENT, 2015–2022 (USD MILLION)
TABLE 138 PAYMENT SECURITY MARKET, BY SOLUTION, 2015–2022 (USD MILLION)
TABLE 139 PAYMENT SECURITY MARKET, BY ORGANIZATION SIZE, 2015–2022 (USD MILLION)
TABLE 140 PAYMENT SECURITY MARKET, BY VERTICAL, 2015–2022 (USD MILLION)
13 APPENDIX (Page No. - 166)
13.1 DISCUSSION GUIDE
13.2 KNOWLEDGE STORE: MARKETSANDMARKETS’ SUBSCRIPTION PORTAL
13.3 CUSTOMIZATION OPTIONS
13.4 RELATED REPORTS
13.5 AUTHOR DETAILS
The study involved major activities in estimating the current market size for the POS security market. Exhaustive secondary research was done to collect information on the POS security industry. The next step was to validate these findings, assumptions, and sizing with industry experts across the value chain using primary research. Different approaches like top-down, bottom up were employed to estimate the total market size. After that, the market breakup and data triangulation procedures were used to estimate the market size of the segments and sub segments of the POS security market.
Secondary Research
The market size of companies offering POS security solutions and services was arrived at based on the secondary data available through paid and unpaid sources. It was also arrived at by analyzing the product portfolios of major companies and rating the companies based on their performance and quality.
In the secondary research process, various sources were referred to for identifying and collecting information for this study. The secondary sources included annual reports, press releases, investor presentations of companies; white papers, journals, certified publications; and articles from recognized authors, directories, and databases.
The cybersecurity investment and spending of various countries were extracted from their respective security associations, such as the US Department of Homeland Security (DHS) and European Union Agency for Cybersecurity (ENISA). Secondary research was mainly used to obtain key information about the industry’s value chain and supply chain to identify key players according to their offerings and industry trends related to technology, application, and region and key developments from both market- and technology-oriented perspectives.
The factors considered for estimating the market size are technological initiatives undertaken by governments of different countries, Gross Domestic Product (GDP) growth, Information and Communications Technology (ICT) spending, recent market developments, and market ranking analysis of major POS security solution providers.
Primary Research
Various primary sources from both supply and demand sides were interviewed to obtain qualitative and quantitative information for this report in the primary research process. The primary sources from the supply side included various industry experts, including Chief Executive Officers (CEOs), Vice Presidents (VPs), marketing directors, technology and innovation directors, and related key executives from various key companies and organizations operating in the POS security market.
In the market engineering process, top-down and bottom-up approaches were extensively used, along with several data triangulation methods, to perform the market estimation and market forecasting for the overall market segments and subsegments listed in this report. The complete market engineering process was extensive qualitative and quantitative analysis to list key information/insights throughout the report.
After the complete market engineering process (calculations for market statistics, market breakups, market size estimations, market forecasts, and data triangulation), extensive primary research was conducted to gather information and verify and validate the critical numbers arrived at. The primary research was also conducted to identify the segmentation types; industry trends; the competitive landscape of the POS security market players; and the key market dynamics, such as drivers, restraints, opportunities, challenges, and key strategies.
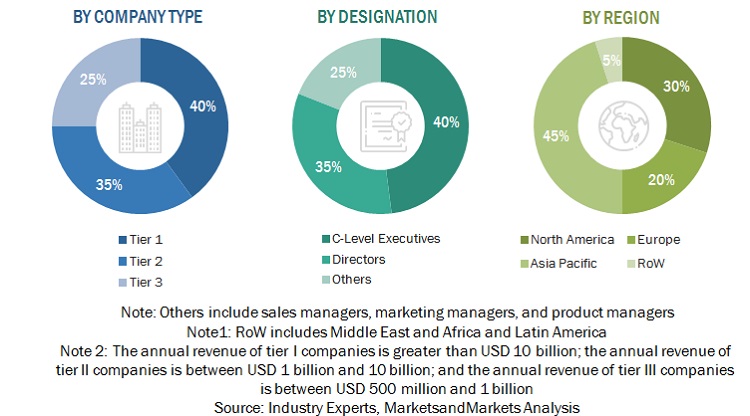
Following is the breakup of the primary respondents:
To know about the assumptions considered for the study, download the pdf brochure
POS Security Market Size Estimation
To know about the assumptions considered for the study, Request for Free Sample Report
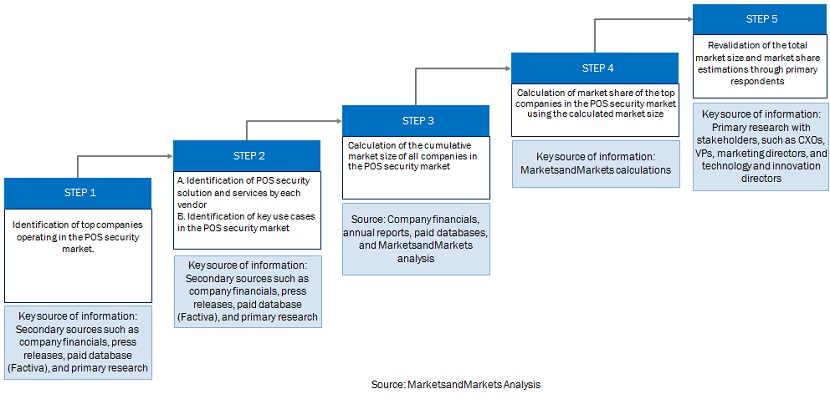
Multiple approaches were adopted to estimate and forecast the size of the POS security market. In the market engineering process, top-down and bottom-up approaches were extensively used, along with several data triangulation methods, to perform the market estimation and market forecasting for the overall market segments and sub-segments listed in this report. Extensive qualitative and quantitative analysis was performed on the complete market engineering process to list key information/insights throughout the report. This entire procedure included the study of the annual and financial reports of top market players and extensive interviews for key insights from industry leaders, such as CEOs, VPs, directors, and marketing executives. All percentage splits and breakups were determined using secondary sources and verified through primary sources. All possible parameters that affect the market covered in this research study have been accounted for, viewed in extensive detail, verified through primary research, and analyzed to get the final quantitative and qualitative data. This data is consolidated and added to detailed inputs and analysis from MarketsandMarkets.
Data Triangulation
After arriving at the overall market size using the market size estimation processes as explained above, the market was split into several segments and subsegments. The data triangulation and market breakup procedures were employed, wherever applicable, to complete the overall market engineering process and arrive at the exact statistics of each market segment and subsegments. The data was triangulated by studying various factors and trends from both the demand and supply sides.
Report Objectives
- To define, describe, and forecast the Point of Sales security (POS security) market by offering, services, organization size, vertical, and region
- To provide detailed information about the major factors (drivers, opportunities, restraints, and challenges) influencing the growth of the POS security market
- To analyze the opportunities in the market for stakeholders by identifying the high-growth segments of the market
- To forecast the size of the market segments with respect to five main regions: North America, Europe, Asia Pacific, Middle East and Africa, and Latin America
- To analyze subsegments of the market with respect to individual growth trends, prospects, and contributions to the overall market
- To profile the key players of the market and comprehensively analyze their market size and core competencies
- To track and analyze the competitive developments, such as product enhancements and new product launches; acquisitions; and partnerships and collaborations, in the POS security market globally
Available Customizations
With the given market data, MarketsandMarkets offers customizations based on company-specific needs. The following customization options are available for the report:
Geographic Analysis
- Further breakup of the Asia Pacific market into countries contributing 75% to the regional market size
- Further breakup of the North American market into countries contributing 75% to the regional market size
- Further breakup of the Latin American market into countries contributing 75% to the regional market size
- Further breakup of the Middle Eastern & African market into countries contributing 75% to the regional market size
- Further breakup of the European market into countries contributing 75% to the regional market size
Company Information
- Detailed analysis and profiling of additional market players (up to 5)


 Generating Response ...


Growth opportunities and latent adjacency in POS Security Market