Polyphthalamide Market by Type (Unfilled, Mineral Filled, Glass Fiber Filled, & Carbon Fiber Filled), by Application (Automotive, Electronics & Electricals, Industrial Equipment & Apparatus, Consumer & Personal Care, & Others) - Global Trends & Forecast to 2019


[129 Pages] The Polyphthalamide market is estimated to register a CAGR of 7.1 % between 2014 and 2019 and reach a volume of 150.1 Kilo Tons. In terms of value the global market in 2014 is estimated as $646.7 Million and is projected to reach $913.0 Million by 2019. The demand for Polyphthalamide is increasing and will continue to increase because of its long range of applications in fuel lines, LED headlights, metal replacement, catheter tubes, wire casings, gas pipes, toothbrush and hairbrush bristles, sporting goods, electrical insulation, switches, pump wear rings, automotive motor bobbin parts, fuel line connectors, fuel modules, coolant pumps, bushings and bearing pads.
PPA or Polyphthalamide is a high heat resistant semi-aromatic polyamide. It is a member of the nylon family and is a semi-crystalline material composed from a diacid and a diamine. With its heat resistant and low moisture absorption properties, PPA is ideal for use in a chemical environment or temperature extreme conditions.
This report essentially aims to estimate the market of polyphthalamide for 2014 and to project the expected demand of the same by 2019. This market research study provides a detailed qualitative and quantitative analysis of the polyphthalamide market. The research methodology of the report involved the utilization of various secondary sources, such as encyclopedia, directories, and databases to identify and collect information useful for this extensive commercial study of the market. The primary sources�experts from related industries and suppliers�were interviewed to obtain and verify critical information as well as to assess the future prospects of the market.
Competitive developments of top players in the market have been discussed in detail. The leading players of this industry are EMS Chemie Holding AG (Zurich), DUPONT EI DE Nemours & Co. (U.S.), Solvay S.A. (Belgium), Evonik Industries AG (Germany), Arkema S.A. (France), Polyone Corporation (U.S.), SABIC (Saudi Arabia), Eurotec (Turkey), Propolymers Inc. (U.S.), and Akro Plastics GMBH (Germany) among others have been profiled with their recent developments and other strategic industry activities.
Scope of the Report
The polyphthalamide market is analyzed in terms of volume (Tons) and value ($ Million) by the below-mentioned classifications.
By Type
- Unfilled
- Mineral Filled
- Glass Fiber Filled
- Carbon Fiber Filled
By Application
- Automotive
- Electronics & Electrical
- Industrial Equipment & Apparatus
- Consumer & Personal Care
- Others
By Region
- North America
- United States
- Canada
- Mexico
- Asia Pacific
- China
- Japan
- India
- South Korea
- Rest of Asia Pacific
- Europe
- United Kingdom
- Germany
- Italy
- France
- Spain
- Rest of Europe
- Rest of World
- Middle East
- Brazil
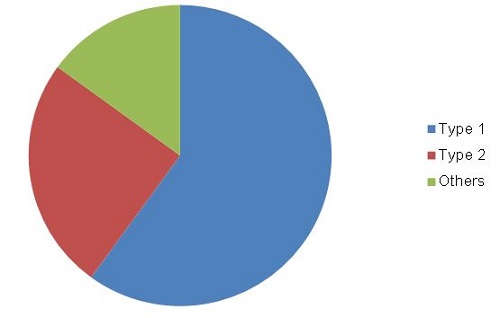
The Polyphthalamide market is growing at a significant rate, driven by the growth in the automotive and electrical and electronics sectors. The research and development to replace components in automotive vehicles by light weighting materials is driving the growth of polyphthalamide consumption globally. The market is estimated to register a CAGR of 7.1 % between 2014 and 2019 and reach a volume of 150.1 Kilo Tons. In terms of value the global market in 2014 is estimated as $646.7 Million and is projected to reach $913.0 Million by 2019. The market has been segmented into four categories based on the type, namely, unfilled, mineral filled, glass fiber filled and carbon filled.
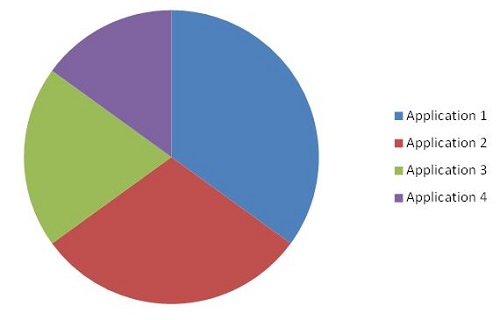
The Polyphthalamide have uses in different industries. The report covers application of the Polyphthalamide in the automotive, electronics and electrical, industrial equipment and apparatus, consumer & personal care and others. The demand has increased from automotive industry because of its advantages in light weighting the components of vehicles.
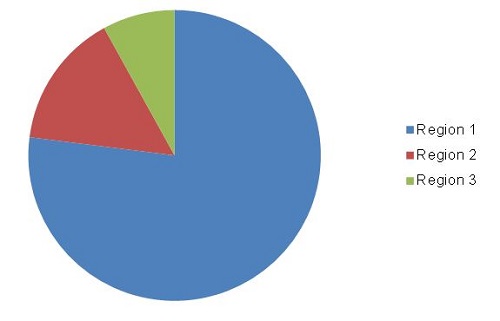
The report covers the market by key countries in each region. It also provides a detailed segmentation of the market on the basis of type and by application, along with projections till 2019.
Polyphthalamide Market, by Type, 2019
Polyphthalamide Market, by Application, 2019
Polyphthalamide Market, by Region, 2019
Source: Secondary Research, Expert Interviews, and MarketsandMarkets Analysis
This report covers the polyphthalamide market by key countries in each region. It also provides a detailed segmentation of the market on the basis of type and based on applications along with projections till 2019.
 Exclusive indicates content/data unique to MarketsandMarkets and not available with any competitors.
Table of Contents
1 Introduction (Page No. - 13)
1.1 Objectives of the Study
1.2 Market Definition
1.3 Markets Scope
1.3.1 Markets Covered
1.3.2 Years Considered in the Report
1.4 Currency and Pricing
1.5 Limitations
1.6 Stakeholders
2 Research Methodology (Page No. - 16)
2.1 Market Size Estimation
2.2 Market Breakdown & Data Triangulation
2.3 Market Share Estimation
2.4 Assumptions
2.4.1 Key Data Insights
3 Executive Summary (Page No. - 23)
4 Premium Insights (Page No. - 26)
4.1 Attractive Opportunities in the Polyphthalamide Market
4.2 Polyphthalamide Market: Carbon Fiber Filled has the Highest Growth Rate
4.3 China has the Largest Share in Asia-Pacific
4.4 Polyphthalamide Market Attractiveness
4.5 Polyphthalamide Types (2014)
4.6 Polyphthalamide Market: Major Countries in Each Region
4.7 Polyphthalamide Market (2014-2019)
4.8 Life Cycle Analysis, By Region
5 Market Overview (Page No. - 32)
5.1 Introduction
5.2 Market Segmentation
5.2.1 Polyphthalamide Market, By Type
5.2.2 Polyphthalamide Market, By Application
5.3 Market Dynamics
5.3.1 Drivers
5.3.1.1 Light Weighting of Automobile Components AMID Stringent Emission Regulations
5.3.1.2 Metal Replacement in Industrial Applications
5.3.2 Restraint
5.3.2.1 High Cost Compared to Other Thermoplastic Nylons
5.3.3 Opportunities
5.3.3.1 High Penetration Into New Application Areas
5.3.3.2 Development and Commercialization of Bio-Based Polyphthalamide
6 Industry Trends (Page No. - 37)
6.1 Introduction
6.2 Value Chain Analysis
6.3 Porter�s Five Forces Analysis
6.3.1 Threat of New Entrants
6.3.2 Threat of Substitutes
6.3.3 Bargaining Power of Suppliers
6.3.4 Bargaining Power of Buyers
6.3.5 Intensity of Competitive Rivalry
6.4 Strategic Benchmarking
6.4.1 Expansion
6.4.2 New Product Launches
7 Global Polyphthalamide Market, By Type (Page No. - 42)
7.1 Introduction
7.1.1 Light Weighting of Vehicles is Driving the Demand for Carbon Fiber Filled Polyphthalamide Market
7.2 Unfilled Polyphthalamide
7.2.1 Asia-Pacific to Register the Highest Growth
7.3 Mineral Filled Polyphthalamide
7.3.1 Asia-Pacific is Estimated to be the Fastest-Growing Market
7.4 Glass Fiber Filled Polyphthalamide
7.4.1 Europe to Witness Sluggish Growth
7.5 Carbon Fiber Filled Polyphthalamide
7.5.1 Carbon Fiber Filled is Extensively Used for Light Weighting of Vehicles
8 Polyphthalamide Market, By Application (Page No. - 49)
8.1 Introduction
8.2 Market Size & Projection
8.2.1 Growth in Automotive is Driving the Polyphthalamide Demand
8.3 Automotive
8.3.1 Europe Accounts for the Largest Market Share in Automotive Segment
8.4 Electronics & Electrical
8.4.1 Increased Automotive Manufacturing Activities Behind the High Growth
8.5 Industrial Equipment & Apparatus
8.5.1 Industrial Growth in Asia-Pacific to Drive the Market
8.6 Consumer & Personal Care
8.6.1 Europe has the Largest Market Share in Consumer & Personal Care Segment
8.7 Others
9 Regional Analysis (Page No. - 58)
9.1 Introduction
9.2 North America
9.2.1 U.S.
9.2.2 Canada
9.2.3 Mexico
9.3 Asia- Pacific
9.3.1 China
9.3.2 Japan
9.3.3 India
9.3.4 South Korea
9.3.5 Rest of Asia-Pacific
9.4 Europe
9.4.1 Germany
9.4.2 France
9.4.3 U.K.
9.4.4 Italy
9.4.5 Spain
9.4.6 Rest of Europe
9.5 RoW
9.5.1 Middle East
9.5.2 Brazil
10 Competitive Landscape (Page No. - 93)
10.1 Overview
10.2 New Product Launch: Most Popular Growth Strategy
10.3 Maximum Developments in 2014 & 2011
10.4 Ems Chemie Holding & Evonik Industries: the Most Active Participants
10.5 Competitive Situation & Trends
10.5.1 New Product Launches
10.5.2 Expansions
10.5.3 Contracts & AGreements
11 Company Profiles (Page No. - 99)
(Company at A Glance, Recent Financials, Products & Services, Strategies & Insights, & Recent Developments)*
11.1 EMS-Chemie Holding AG
11.2 Dupont Ei De Nemours & Co.
11.3 Solvay S.A.
11.4 Evonik Industries AG
11.5 Arkema S.A.
11.6 Polyone Corporation
11.7 Sabic
11.8 Eurotec
11.9 Propolymers Inc.
11.10 Akro-Plastic GMBH
*Details on Company at A Glance, Recent Financials, Products & Services, Strategies & Insights, & Recent Developments Might Not be Captured in Case of Unlisted Companies.
12 Appendix (Page No. - 120)
12.1 Industry Experts
12.2 Recent Developments
12.3 Discussion Guide
12.4 Introducing RT: Real Time Market Intelligence
12.5 Available Customizations
12.6 Related Reports
List of Tables (89 Tables)
Table 1 Polyphthalamide Market Size, By Type, 2012�2019 (Tons)
Table 2 Unfilled Polyphthalamide Market Size, By Region, 2012�2019 (Tons)
Table 3 Mineral Filled Polyphthalamide Market Size, By Region, 2012�2019 (Tons)
Table 4 Glass Fiber Filled Polyphthalamide Market Size, By Region, 2012�2019 (Tons)
Table 5 Carbon Fiber Filled Polyphthalamide Market Size, By Region, 2012�2019 (Tons)
Table 6 Polyphthalamide Market Size, By Application, 2012�2019 (Tons)
Table 7 Polyphthalamide Market Size, By Application, 2012�2019 ($Million)
Table 8 Polyphthalamide Market Size in Automotive Segment, By Region, 2012�2019 (Tons)
Table 9 Polyphthalamide Market Size in Automotive Segment, By Region, 2012�2019 ($Million)
Table 10 Polyphthalamide Market Size in Electronics & Electrical Segment, By Region, 2012�2019 (Tons)
Table 11 Polyphthalamide Market Size in Industrial Equipment & Apparatus Segment, By Region, 2012�2019 (Tons)
Table 12 Polyphthalamide in Consumer & Personal Care Application Market Size, By Region, 2012�2019 (Tons)
Table 13 Polyphthalamide Market Size in Others Segment, By Region, 2012�2019 (Tons)
Table 14 Polyphthalamide Market Size, By Region, 2012�2019 (Tons)
Table 15 Polyphthalamide Market Size, By Region, 2012�2019 ($Million)
Table 16 North America: Polyphthalamide Market Size, By Country, 2012�2019 (Tons)
Table 17 North America: Polyphthalamide Market Size, By Country, 2012�2019 ($Million)
Table 18 North America: Polyphthalamide Market Size, By Application, 2012�2019 (Tons)
Table 19 North America: Polyphthalamide Market Size, By Application, 2012�2019 ($Million)
Table 20 U.S.: Polyphthalamide Market Size, By Type, 2012�2019 (Tons)
Table 21 U.S.: Polyphthalamide Market Size, By Type, 2012�2019 ($Million)
Table 22 U.S.: Polyphthalamide Market Size, By Application, 2012�2019 (Tons)
Table 23 U.S.: Polyphthalamide Market Size, By Application, 2012�2019 ($Million)
Table 24 Canada: Polyphthalamide Market Size, By Type, 2012�2019 (Tons)
Table 25 Canada: Polyphthalamide Market Size, By Type, 2012�2019 ($Million)
Table 26 Canada: Polyphthalamide Market Size, By Application, 2012�2019 (Tons)
Table 27 Canada: Polyphthalamide Market Size, By Application, 2012�2019 ($Million)
Table 28 Mexico: Polyphthalamide Market Size, By Type, 2012�2019 (Tons)
Table 29 Mexico: Polyphthalamide Market Size, By Type, 2012�2019 ($Million)
Table 30 Mexico: Polyphthalamide Market Size, By Application, 2012�2019 (Tons)
Table 31 Mexico: Polyphthalamide Market Size, By Application, 2012�2019 ($Million)
Table 32 Asia Pasific: Polyphthalamide Market Size, By Country, 2012�2019 (Tons)
Table 33 Asia Pasific: Polyphthalamide Market Size, By Country, 2012�2019 ($Million)
Table 34 China: Polyphthalamide Market Size, By Type, 2012�2019 (Tons)
Table 35 China: Polyphthalamide Market Size, By Type, 2012�2019 ($Million)
Table 36 China: Polyphthalamide Market Size, By Application, 2012�2019 (Tons)
Table 37 China: Polyphthalamide Market Size, By Application, 2012�2019 ($Million)
Table 38 Japan: Polyphthalamide Market Size, By Type, 2012�2019 (Tons)
Table 39 Japan: Polyphthalamide Market Size, By Type, 2012�2019 ($Million)
Table 40 Japan: Polyphthalamide Market Size, By Application, 2012�2019 (Tons)
Table 41 Japan: Polyphthalamide Market Size, By Application, 2012�2019 ($Million)
Table 42 India: Polyphthalamide Market Size, By Type, 2012�2019 (Tons)
Table 43 India: Polyphthalamide Market Size, By Application, 2012�2019 (Tons)
Table 44 South Korea: Polyphthalamide Market Size, By Type, 2012�2019 (Tons)
Table 45 South Korea: Polyphthalamide Market Size, By Type, 2012�2019 ($Million)
Table 46 South Korea: Polyphthalamide Market Size, By Application, 2012�2019 (Tons)
Table 47 South Korea: Polyphthalamide Market Size, By Application, 2012�2019 ($Million)
Table 48 Rest of Asia-Pacific: Polyphthalamide Market Size, By Type, 2012�2019 (Tons)
Table 49 Rest of Asia Pacific: Polyphthalamide Market Size, By Type, 2012�2019 ($Million)
Table 50 Rest of Asia-Pacific: Polyphthalamide Market Size, By Application, 2012�2019 (Tons)
Table 51 Rest of Asia Pacific: Polyphthalamide Market Size, By Application, 2012�2019 ($Million)
Table 52 Europe: Polyphthalamide Market Size, By Country, 2012�2019 (Tons)
Table 53 Europe: Polyphthalamide Market Size, By Country, 2012�2019 ($$Million)
Table 54 Germany: Polyphthalamide Market Size, By Type, 2012�2019 (Tons)
Table 55 Germany: Polyphthalamide Market Size, By Type, 2012�2019 ($Million)
Table 56 Germany: Polyphthalamide Market Size, By Application, 2012�2019 (Tons)
Table 57 Germany: Polyphthalamide Market Size, By Application, 2012�2019 ($Million)
Table 58 France: Polyphthalamide Market Size, By Type, 2012�2019 (Tons)
Table 59 France: Polyphthalamide Market Size, By Type, 2012�2019 ($Million)
Table 60 France: Polyphthalamide Market Size, By Application, 2012�2019 (Tons)
Table 61 France: Polyphthalamide Market Size, By Application, 2012�2019 ($Million)
Table 62 U.K.: Polyphthalamide Market Size, By Type, 2012�2019 (Tons)
Table 63 U.K.: Polyphthalamide Market Size, By Type, 2012�2019 ($Million)
Table 64 U.K.: Polyphthalamide Market Size, By Application, 2012�2019 (Tons)
Table 65 U.K.: Polyphthalamide Market Size, By Application, 2012�2019 ($Million)
Table 66 Italy: Polyphthalamide Market Size, By Type, 2012�2019 (Tons)
Table 67 Italy: Polyphthalamide Market Size, By Type, 2012�2019 ($Million)
Table 68 Italy: Polyphthalamide Market Size, By Application, 2012�2019 (Tons)
Table 69 Italy: Polyphthalamide Market Size, By Application, 2012�2019 ($Million)
Table 70 Spain: Polyphthalamide Market Size, By Type, 2012�2019 (Tons)
Table 71 Spain: Polyphthalamide Market Size, By Type, 2012�2019 ($Million)
Table 72 Spain: Polyphthalamide Market Size, By Application, 2012�2019 (Tons)
Table 73 Spain: Polyphthalamide Market Size, By Application, 2012�2019 (Tons)
Table 74 Rest of Europe: Polyphthalamide Market Size, By Type, 2012�2019 (Tons)
Table 75 Rest of Europe: Polyphthalamide Market Size, By Type, 2012�2019 ($Million)
Table 76 Rest of Europe: Polyphthalamide Market Size, By Application, 2012�2019 (Tons)
Table 77 Rest of Europe: Polyphthalamide Market Size, By Application, 2012�2019 ($Million)
Table 78 RoW: Polyphthalamide Market Size, By Country, 2012�2019 (Tons)
Table 79 RoW: Polyphthalamide Market Size, By Country, 2012�2019 ($$Million)
Table 80 Middle East: Polyphthalamide Market Size, By Type, 2012�2019 (Tons)
Table 81 Middle East: Polyphthalamide Market Size, By Type, 2012�2019 ($Million)
Table 82 Middle East: Polyphthalamide Market Size, By Application, 2012�2019 (Tons)
Table 83 Middle East: Polyphthalamide Market Size, By Application, 2012�2019 ($Million)
Table 84 Brazil: Polyphthalamide Market Size, By Type, 2012�2019 (Tons)
Table 85 Brazil: Polyphthalamide Market Size, By Type, 2012�2019 ($Million)
Table 86 Brazil: Polyphthalamide Market Size, By Application, 2012�2019 (Tons)
Table 87 Brazil: Polyphthalamide Market Size, By Application, 2012�2019 ($Million)
Table 88 New Product Launch, 2011-2014
Table 89 Expansion, 2011-2014
List of Figures (54 Figures)
Figure 1 Global Polyphthalamide Market, Research Design
Figure 2 Market Size Estimation: Bottom-Up Approach
Figure 3 Market Size Estimation: Top-Down Approach
Figure 4 Break Down of Primary Interviews, By Company Type, & Designation
Figure 5 Key Data From Secondary Sources
Figure 6 Key Data From Primary Sources
Figure 7 Glass Fiber Filled to Dominate the Market Till 2019
Figure 8 Polyphthalamide in Automotive Sector Growing at the Fastest Rate
Figure 9 Asia-Pacific Region to Register High Growth
Figure 10 Automotive Industry to Boost the Growth of Polyphthalamide Market
Figure 11 Glass Fiber Filled Polyphthalamide has the Maximum Consumption
Figure 12 China Accounts for the Lion�s Share in the Asia-Pacific Polyphthalamide Market
Figure 13 Asia-Pacific to Emerge as A Lucrative Market
Figure 14 Glass Fiber Filled has the Largest Share Among all Types
Figure 15 China is the Largest Market in the Asia-Pacific Region
Figure 16 Polyphthalamide has A Promising Future in the Emerging Economies
Figure 17 Asia Pacific Market is Projected to Experience A Growth Phase in Five Years (2014-2019) for Polyphthalamide
Figure 18 Polyphthalamide Market Segmentation, By Application
Figure 19 Overview of the Forces Affecting the Polyphthalamide Market
Figure 20 Value Chain Analysis for Polyphthalamide: Resin Producers & Compounders Account for the Major Value Addition
Figure 21 Porter�s Five Forces Analysis (2014)
Figure 22 Strategic Benchmarking: Developments of Leading Global Players
Figure 23 New Products Are Launched to Meet the Requiremnts of Customers
Figure 24 Carbon Fiber Filled Polyphthalamide to Register the Highest Cagr Between 2014 & 2019
Figure 25 Regional Growth for Mineral Filled Polyphthalamide (2019)
Figure 26 Glass Fiber Filled Polyphthalamide to Witness Fastest-Growth in Asia-Pacific (2014-2019)
Figure 27 Asia-Pacific to Witness Highest Growth (2014-2019)
Figure 28 Automotive Segment to Have the Highest Consumption
Figure 29 Asia-Pacific to Fuel the Polyphthalamide Consumption in Automotive Segment
Figure 30 Increased Demand is Driving the Growth of Polyphthalamide in Electronics & Electrical Market
Figure 31 North America Accounts for the Maximum Share in Industrial Applications in 2014
Figure 32 European Region to Grow at A High Rate
Figure 33 Regional Snapshot (2014-2019): Rapid Growth Market Are Emerging as New Hotspots
Figure 34 Asia-Pacific is the Emerging Market for Polyphthalamide
Figure 35 North America Market Snapshot (2014): U.S. is the Most Lucrative Market
Figure 36 Asia-Pacific Market Snapshot (2014):China is the Most Lucrative Market
Figure 37 European Market Snapshot (2014-2019):Germany is the Largest Market of Polyphthalamide
Figure 38 Key Growth Strategies in the Polyphthalamide Market, 2010�2015
Figure 39 Companies Primarily Adopted Organic Growth Strategies From 2014 to 2019
Figure 40 Maximum Number of Developments Took Place in 2011 & 2014
Figure 41 EMS-Chemie Holding AG & Evonik Industries Are the Most Active Players, 2010�2015
Figure 42 Geographic Revenue Mix of Top 5 Market Players
Figure 43 EMS-Chemie Holding AG: Company Snapshot
Figure 44 EMS-Chemie Holding AG: SWOT Analysis
Figure 45 Du Pont Ei De Nemours & Co.: Company Snapshot
Figure 46 Du Pont Ei De Nemours & Co.: SWOT Analysis
Figure 47 Solvay S.A.: Company Snapshot
Figure 48 Solvay S.A.: SWOT Analysis
Figure 49 Evonik Industries AG: Company Snapshot
Figure 50 Evonik Industries AG: SWOT Analysis
Figure 51 Arkema S.A.: Company Snapshot
Figure 52 Arkema S.A.: SWOT Analysis
Figure 53 Polyone Corporation: Company Snapshot
Figure 54 Sabic: Company Snapshot


Growth opportunities and latent adjacency in Polyphthalamide Market