Lactic Acid and Polylactic Acid Market

Lactic Acid and Polylactic Acid Market by Application (Biodegradable Polymers, Food & Beverages, Pharmaceutical Products), Raw Material, Form (Dry, Liquid), and Region (North America, Europe, Asia Pacific, Rest of the World) - Global Forecast to 2028

Report Code: FB 2647 Jun, 2023, by marketsandmarkets.com

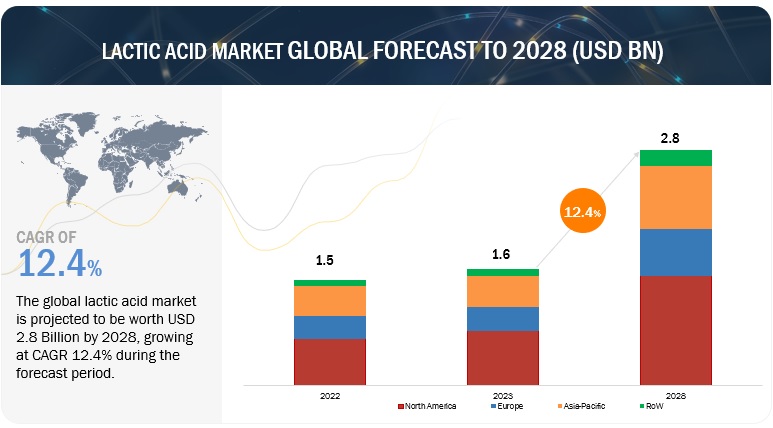
The global Lactic Acid and Polylactic Acid Market size was valued at USD 1.6 billion and USD 1.3 billion in 2023 and are anticipated to grow at CAGRs of 12.4% and 17.7%, respectively, between 2023 and 2028, attributed to the growing revenue of $2.8 billion and $2.9 billion by 2028. The base year for estimation is 2022, and the historical data spans from 2023 to 2028.

The overall production of polymers worldwide was reportedly around 9 billion tonnes in 2021, as per the estimates provided by the scientific article “.Poly(lactic Acid): A Versatile Biobased Polymer for the Future with Multifunctional Properties From Monomer Synthesis, Polymerization Techniques and Molecular Weight Increase to PLA Applications”, published in 2021. Only 9–10% of these plastics are recycled and repurposed, and only 12% are burned. The majority (78–79%) end up in the environment (oceans, lakes, rivers, and landfills). They consequently provide significant issues, most notably with regard to disposal, environmental contamination, ecosystem toxicity, and human health. Utilizing renewable resources to produce biobased polymers is one way to address these issues. Recently, there has been an increase in interest in biobased polymers on a global scale. Polylactic acid (PLA), a well-known eco-friendly biodegradable and biobased polyester, has been extensively explored and is being considered as an ideal replacement for petroleum-based polymers. The 2020 market data on global bioplastics production, compiled by European Bioplastics in collaboration with the nova-Institute, indicates a projected growth from about 2.11 million tons in 2020 to approximately 2.87 million tons by 2025. Results from the same report suggest that the global PLA production was around 190,000 tons in 2019, indicating significant growth potential for the lactic and polylactic acid market.
Lactic Acid and Polylactic Acid Market

To know about the assumptions considered for the study, Request for Free Sample Report
Lactic Acid and Polylactic Acid Market

To know about the assumptions considered for the study, download the pdf brochure

Drivers: Rise in demand for alternative environment-friendly resources

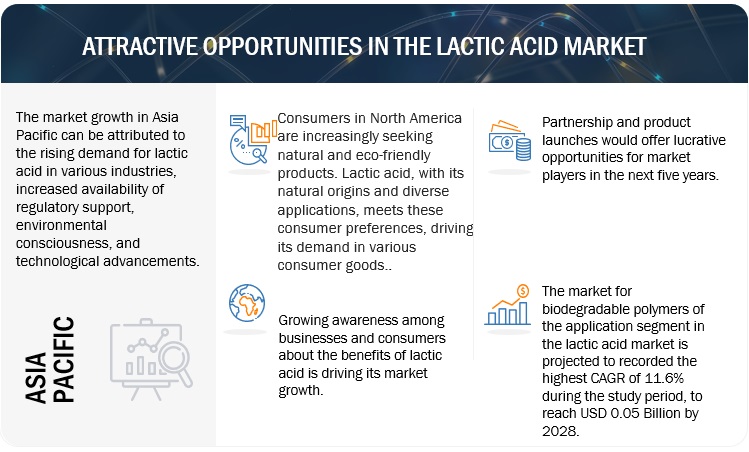
The increasing demand for alternative eco-friendly resources is driving significant market growth in the lactic acid and polylactic acid (PLA) market. With growing environmental concerns and a shift towards sustainable practices, there is a rising preference for bio-based and biodegradable materials. Lactic acid and PLA, being derived from renewable resources and offering biodegradability, are emerging as attractive alternatives to traditional petrochemical-based products. These materials find extensive applications in various industries, including packaging, textiles, medical, and personal care. The demand for eco-friendly packaging solutions, driven by consumer awareness and regulatory measures, is particularly boosting market growth. The versatile properties of lactic acid and PLA, such as biocompatibility, thermal stability, and moldability, make them suitable for a wide range of applications. Additionally, ongoing advancements in production processes and technological innovations further enhance the market prospects of lactic acid and PLA. Single-use plastic bags, cutlery, and straws have all been prohibited in major Chinese cities since 2021. Portugal has prohibited the use of single-use plastics from catering services as well as free plastic bags in all commercial establishments since 2020. The combined factors of environmental consciousness, regulatory support, expanding eco-friendly packaging demands, and technological advancements are fueling the growth trajectory of the lactic acid and PLA market.

Leading food company Danone was the first company in Europe to transition to PLA packaging, using NatureWorks' IngeoPLA. Danone reduced the carbon footprint of the packaging for its Activia brand by 25% by switching from polystyrene to PLA and by using 43% fewer fossil resources.

Restraint: Concerns over the quality of lactic acid used in food & beverage products

Lactic acid and PLA exhibit excellent biodegradability, biocompatibility, and thermal stability, making them suitable for diverse applications. In the packaging industry, lactic acid and PLA serve as sustainable alternatives to conventional plastics, offering barrier properties and prolonging product shelf life. In the medical field, they find applications in drug delivery systems, tissue engineering, and biodegradable implants. The textile industry benefits from their use in eco-friendly fabrics and fibers. Moreover, lactic acid and PLA are employed in the production of personal care products, cleaning agents, and 3D printing materials. The versatility and broad range of functionalities provided by lactic acid and PLA position them as attractive options for industries seeking sustainable and innovative solutions. As consumer demand for eco-friendly products continues to rise, the multi-functionality of lactic acid and PLA opens up significant growth opportunities for market expansion and the development of new applications.

Opportunity: Multi-functionalities of lactic and polylactic acids

Lactic acid and PLA exhibit excellent biodegradability, biocompatibility, and thermal stability, making them suitable for diverse applications. In the packaging industry, lactic acid and PLA serve as sustainable alternatives to conventional plastics, offering barrier properties and prolonging product shelf life. In the medical field, they find applications in drug delivery systems, tissue engineering, and biodegradable implants. The textile industry benefits from their use in eco-friendly fabrics and fibers. Moreover, lactic acid and PLA are employed in the production of personal care products, cleaning agents, and 3D printing materials. The versatility and broad range of functionalities provided by lactic acid and PLA position them as attractive options for industries seeking sustainable and innovative solutions. As consumer demand for eco-friendly products continues to rise, the multi-functionality of lactic acid and PLA opens up significant growth opportunities for market expansion and the development of new applications.

Danone, the multinational food products company uses lactic acid in their dairy products, such as yogurts and fermented milk drinks, for flavor enhancement and pH adjustment. The cosmetics and beauty giant, L’Oréal, incorporates lactic acid in some of its skincare and hair care products for exfoliation, pH balancing, and moisturizing effects. Procter & Gamble employs lactic acid in some of its cleaning and laundry products for its disinfecting and stain removal properties.

Challenge: High investment costs involved for small and medium enterprises

The high initial investment cost for small and medium enterprises (SMEs) poses a significant challenge to the growth of the lactic acid and polylactic acid market. Lactic acid is a promising and versatile compound used in various industries, including food and beverages, pharmaceuticals, and bioplastics. However, the production of lactic acid requires substantial capital investment in infrastructure, equipment, and research and development. SMEs, which often operate with limited financial resources, struggle to allocate the necessary funds for these upfront costs. This financial barrier prevents many SMEs from entering the lactic acid and polylactic acid market and limits their ability to compete with larger, more established players. Consequently, the concentration of market power among a few major companies hinders market growth, stifles innovation, and restricts the overall development of the lactic acid and polylactic acid industry. Efforts to address this challenge, such as providing financial support, grants, and fostering collaborations between SMEs and larger corporations, could help mitigate the impact of high initial investment costs and stimulate the growth of the lactic acid and polylactic acid market.

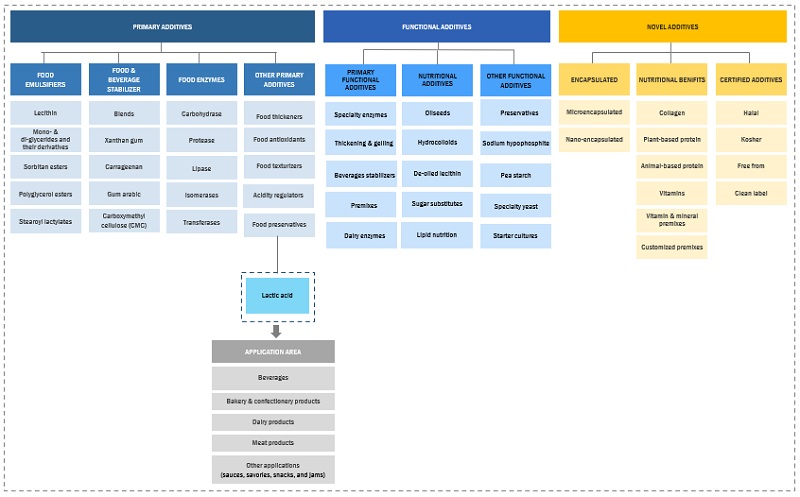
Lactic Acid and Polylactic Acid Market Report Ecosystem
Lactic Acid and Polylactic Acid Market

Based on raw materials, the sugarcane segment is estimated to grow at the fastest rate during the forecast period of the lactic acid market.

The biotechnology approach offers a significant advantage over the chemical method in terms of cost-effective production of pure lactic acid, utilizing low-cost raw materials such as agro-industrial leftovers as a carbon source. Many countries, including Brazil and India, have access to abundant sugar cane molasses, a byproduct of sucrose manufacturing, which can serve as a suitable substrate for lactic acid fermentation. Brazil holds the position of the world's leading sugarcane producer, followed by India. According to the OECD-FAO Agricultural Outlook 2021–2030, these two countries are projected to account for approximately 21% and 18% of global sugar production by 2030, respectively. India alone generates around 100 million tonnes of sugarcane bagasse (SCB), one of the most prevalent agricultural waste products worldwide, annually, according to the 2021 paper “Sugarcane bagasse based biorefineries in India: potential and challenges”. This availability of raw materials and the biotechnological approach present lucrative opportunities for cost-effective lactic acid production in these regions, contributing to the growth and development of the industry.

The abundant availability of sugarcane bagasse, especially in regions with significant sugar production, provides a cost-effective and renewable resource for lactic acid production. Additionally, utilizing bagasse can help address waste management challenges associated with its disposal, contributing to a more circular and environmentally responsible approach. By tapping into the potential of sugarcane bagasse, the lactic acid market can benefit from increased feedstock availability, improved cost-efficiency, and a stronger sustainability profile, ultimately driving its growth and market adoption.

Based on application, the beverage sub segment of the food and beverage segment are anticipated to dominate the lactic acid market.

The growing consumer demand for healthier and natural beverage options has resulted in a notable preference for lactic acid as a safe and sustainable ingredient. Lactic acid offers various advantages, including taste enhancement, texture improvement, and preservation of freshness, across a wide range of beverages such as juices, soft drinks, sports drinks, and dairy-based beverages. Manufacturers have recognized these benefits and increasingly favor lactic acid as a key ingredient. Furthermore, lactic acid provides functional benefits such as microbial stability and acidification, ensuring product safety and maintaining stability throughout the beverage supply chain. As the beverage industry continues to advance and prioritize natural and clean label formulations, the widespread use of lactic acid as a crucial ingredient presents substantial growth prospects for the lactic acid market.

Kefir is a self-carbonated beverage with a unique flavour that comes from a combination of lactic acid, ethanol, carbon dioxide, and additional flavourings. The Swiss soft drink Rivella, which is made from milk whey, uses lactic acid as an acidifier

Based on application, the agriculture segment is projected to witness the highest CAGR during the forecast period of the polylactic acid market.

PLA offers several benefits that make it attractive for agricultural applications. Its biodegradability, derived from renewable resources, and low environmental impact make it a sustainable choice for various agricultural uses. PLA-based mulch films and biodegradable plant pots are gaining popularity as they can be directly incorporated into the soil, reducing waste and eliminating the need for plastic film removal. Additionally, PLA-based agricultural packaging solutions, such as trays and containers, provide a safe and environmentally friendly alternative to conventional plastic packaging. The versatility of PLA extends to the production of agricultural textiles, such as shade nets and erosion control fabrics, which offer excellent biodegradability and performance. Furthermore, PLA's biocompatibility and compatibility with bioactive substances have opened avenues for the development of controlled-release systems for agricultural inputs like fertilizers and pesticides, improving their efficiency and reducing environmental impact. As the agricultural industry increasingly prioritizes sustainable practices and seeks alternatives to traditional plastic materials, the application of PLA in agriculture presents significant growth opportunities for the polylactic acid market.

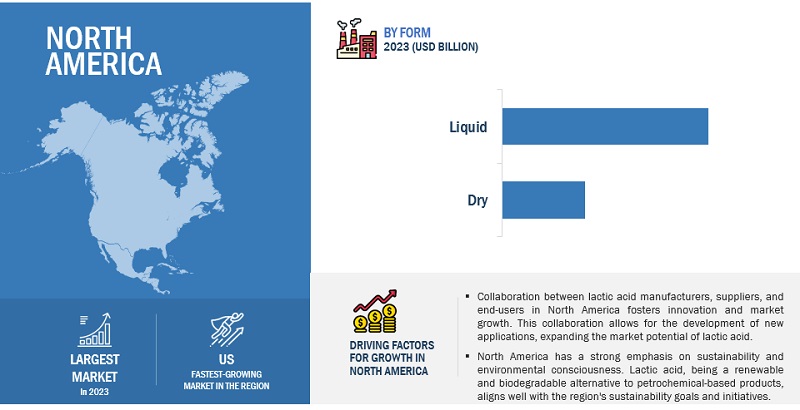
The North America market is projected to contribute the largest lactic acid market share.

The United States is one of the world's top sugar producers. The sugarcane and sugarbeet industries in the United States are both sizable and well-established, unlike those in the majority of other producers. Since the middle of the 2000s, sugarcane has contributed between 40 and 45% of the nation's total sugar production, and sugarbeets have contributed between 55 and 60%. The increased output is the result of a substantial investment in new processing equipment, the adoption of new technologies, the use of improved crop types, and an increase in area (owing to higher prices for sugar crops in comparison to other crops). Increased sugar production from sugarcane also suggests the availability of sugarcane bagasse which act as raw materials for lactic acid production and thus offer lucrative opportunities for the lactic acid in the region.  There is an increasing demand for lactic acid in various industries, including food and beverages, pharmaceuticals, cosmetics, and bioplastics. The region's strong focus on sustainability and environmental consciousness is driving the adoption of lactic acid as a renewable and biodegradable alternative to petrochemical-based ingredients. Additionally, the growing consumer preference for natural and clean label products is fueling the demand for lactic acid in food and beverage applications, where it serves as a pH regulator, preservative, and flavor enhancer. Moreover, North America's advanced industrial infrastructure and technological advancements in lactic acid production processes contribute to the market's growth by ensuring efficient manufacturing and supply capabilities. The region's favorable regulatory environment, stringent quality standards, and government support for sustainable products further facilitate market expansion. With the increasing awareness and adoption of lactic acid-based solutions, North America is poised for continued lactic acid market growth, catering to the evolving needs of various industries and driving the shift towards more sustainable practices.
Lactic Acid and Polylactic Acid Market  Size, and Share

Lactic Acid and Polylactic Acid Market Players

Corbion (Netherlands), Cargill, Incorporated (US), Galactic (Belgium), Unitika Ltd (Japan), Henan Jindan lactic acid Technology Co., Ltd. (China), TORAY INDUSTRIES, INC. (Japan), and Sulzer Ltd (China). are among the key players in the global food antioxidant market. To increase their company's revenues and market shares, companies are focusing on launching new products, developing partnerships, and expanding their production facilities. The key strategies used by companies in the lactic acid market include geographical expansion to tap the potential of emerging economies, strategic acquisitions to gain a foothold over the extensive supply chain, and new product launches as a result of extensive research and development (R&D) initiatives.

Get online access to the report on the World's First Market Intelligence Cloud

  • Easy to Download Historical Data & Forecast Numbers
  • Company Analysis Dashboard for high growth potential opportunities
  • Research Analyst Access for customization & queries
  • Competitor Analysis with Interactive dashboard
  • Latest News, Updates & Trend analysis
Request Sample

Scope of the Report

Report Metric

Details

Lactic Acid Market Size in 2028

$2.8 Billion

Polylactic Acid Market Size in 2028

$2.9 Billion

Lactic Acid Market Report Growth Rate

12.4% CAGR

Polylactic Acid Market Report Growth Rate

17.7% CAGR

Market size estimation

2023–2028

Base year considered

2022

Lactic Acid and Polylactic Acid Market forecast period considered

2023–2028

Units considered

Value (USD)

Segments covered

By Raw Material, By Application, By Form, and By Region

Regions covered

North America, Europe, Asia Pacific,  and RoW

Companies studied

  • Corbion (Netherlands)
  • Cargill, Incorporated (US)
  • Galactic (Belgium)
  • UNITIKA LTD (Japan)
  • Henan Jindan lactic acid Technology Co., Ltd. (China)
  • Sulzer Ltd (Switzerland)
  • Musashino Chemical Laboratory (Japan)
  • Vigon International (US)
  • Henan Xinghan Biotechnology Co. Ltd. (China)
  • Danimer Scientific (US)
  • Jungbunzlauer Suisse AG (Switzerland)
  • Foodchem International Corporation (China)
  • Vaishnavi Bio Tech International Limited (India)
  • Spectrum Chemical (US)
  • GODAVARI BIOREFINERIES LTD (India)
  • ProAgro GmbH (Austria)
  • QINGDAO ABEL TECHNOLOGY CO., LTD.  (China)
  • TORAY INDUSTRIES, INC. (Japan)
  • ABMcomposite (Finland)
  • JIAAN BIOTECH (India)

Lactic Acid Market:

By Raw Materials
  • Corn
  • Cassava
  • Sugarcane
  • Yeast Extract
  • Others
By Form
  • Dry
  • Liquid
By Application
  • Bio-degradable Polymers
  • Food & Beverages
  • Beverages
  • Bakery & Confectionary Products
  • Dairy Products
  • Meat Products
  • Other Food Products
  • Personal Care Products
  • Pharmaceutical Products
  • Other Applications
By Region:
  • North America
  • Europe
  • Asia Pacific
  • Rest of the World (RoW)

Polylactic Acid Market:

By Application
  • Packaging
  • Fiber & Fabrics
  • Agriculture
  • Electronic & Electricals
  • Automobiles
  • Other Applications
By Region:
  • North America
  • Europe
  • Asia Pacific
  • Rest of the World (RoW)

Note 1: Other food applications include sauces, savories, snacks, and jams.
Note 2: Other lactic acid applications include lactate solvents, descaling agents, neutralizers, cleaning agents, metal complexing agents, chiral intermediates, and humectants.
Note 3: Other PLA applications include 3D printing, coating & adhesives, and building & construction.
Note 4: Other raw materials include wheat, molasses, rice, raw sweet potato, apple pomace, and wood.
Note 5: RoW includes South America, the Middle East, and Africa.

Recent Developments

  • In November 2022, NatureWorks signed a collaboration agreement with CJ Biomaterials, a division of South Korea-based CJ CheilJedang and leading producer of polyhydroxyalkanoate (PHA). The aim of collaboration is the development of sustainable material solutions based on CJ Biomaterials’ PHACT Biodegradable Polymers and NatureWorks’ Ingeo biopolymers. Both companies will develop high-performance biopolymer solutions alternative to fossil-fuel-based plastics in applications ranging from compostable food packaging and food serviceware to personal care, films, and other end products.
  • In October 2020, Galactic’s Futerro started operating its first integrated polylactic acid (PLA) production unit in China in collaboration with its historical partner BBCA Biochemical (China), with a production capacity of 30,000 tons/year. This expansion would improve the company’s presence in the Asian market.

Frequently Asked Questions (FAQ):

To speak to our analyst for a discussion on the above findings, click Speak to Analyst


TABLE OF CONTENTS
 
1 INTRODUCTION (Page No. - 38)
    1.1 STUDY OBJECTIVES 
    1.2 MARKET DEFINITION 
    1.3 STUDY SCOPE 
           FIGURE 1 MARKET SEGMENTATION
           1.3.1 REGIONS COVERED
                    FIGURE 2 REGIONAL SEGMENTATION
    1.4 YEARS CONSIDERED 
           FIGURE 3 YEARS CONSIDERED
    1.5 CURRENCY CONSIDERED 
           TABLE 1 USD EXCHANGE RATES CONSIDERED, 2019–2022
    1.6 UNITS CONSIDERED 
    1.7 STAKEHOLDERS 
    1.8 SUMMARY OF CHANGES 
           1.8.1 RECESSION IMPACT
 
2 RESEARCH METHODOLOGY (Page No. - 43)
    2.1 RESEARCH DATA 
           FIGURE 4 LACTIC ACID MARKET: RESEARCH DESIGN
           2.1.1 SECONDARY DATA
                    2.1.1.1 Key data from secondary sources
           2.1.2 PRIMARY DATA
                    2.1.2.1 Key data from primary sources
                    2.1.2.2 Key industry insights
                    2.1.2.3 Breakdown of primary interviews
                               FIGURE 5 BREAKDOWN OF PRIMARY INTERVIEWS: BY VALUE CHAIN, DESIGNATION, AND REGION
    2.2 FACTOR ANALYSIS 
           2.2.1 INTRODUCTION
           2.2.2 DEMAND-SIDE ANALYSIS
                    FIGURE 6 KEY ECONOMIES BASED ON GROSS DOMESTIC PRODUCT, 2019–2021 (USD TRILLION)
           2.2.3 SUPPLY-SIDE ANALYSIS
    2.3 MARKET SIZE ESTIMATION 
           2.3.1 APPROACH ONE (BASED ON APPLICATION AND FORM, BY REGION)
           2.3.2 APPROACH ONE (BASED ON APPLICATION, BY REGION)
           2.3.3 APPROACH TWO (BASED ON GLOBAL MARKET)
    2.4 DATA TRIANGULATION 
           FIGURE 7 DATA TRIANGULATION AND MARKET BREAKDOWN
    2.5 RESEARCH ASSUMPTIONS 
    2.6 RESEARCH LIMITATIONS 
    2.7 RECESSION IMPACT ANALYSIS 
           FIGURE 8 INDICATORS OF RECESSION
           FIGURE 9 WORLD INFLATION RATE: 2011–2021
           FIGURE 10 GLOBAL GROSS DOMESTIC PRODUCT: 2011–2021 (USD TRILLION)
           FIGURE 11 RECESSION INDICATORS AND THEIR IMPACT ON LACTIC ACID MARKET
           FIGURE 12 GLOBAL LACTIC ACID MARKET: CURRENT FORECAST VS. RECESSION FORECAST
           FIGURE 13 GLOBAL POLYLACTIC ACID MARKET: CURRENT FORECAST VS. RECESSION FORECAST
 
3 EXECUTIVE SUMMARY (Page No. - 58)
    TABLE 2 LACTIC ACID MARKET SNAPSHOT, 2023 VS. 2028 
    FIGURE 14 LACTIC ACID MARKET SIZE, BY APPLICATION, 2023 VS. 2028 (USD MILLION) 
    FIGURE 15 LACTIC ACID MARKET SIZE, BY FOOD & BEVERAGES SUB-APPLICATION, 2023 VS. 2028 (USD MILLION) 
    FIGURE 16 POLYLACTIC ACID MARKET SIZE, BY APPLICATION, 2023 VS. 2028 (USD MILLION) 
    FIGURE 17 LACTIC ACID MARKET SIZE, BY FORM, 2023 VS. 2028 (USD MILLION) 
    FIGURE 18 LACTIC ACID MARKET SIZE, BY RAW MATERIAL, 2023 VS. 2028 (USD MILLION) 
    FIGURE 19 REGIONAL SNAPSHOT OF LACTIC ACID MARKET 
    FIGURE 20 REGIONAL SNAPSHOT OF POLYLACTIC ACID MARKET 
 
4 PREMIUM INSIGHTS (Page No. - 64)
    4.1 ATTRACTIVE OPPORTUNITIES FOR KEY PLAYERS IN MARKET 
           FIGURE 21 INCREASE IN DEMAND FOR PROCESSED AND PACKAGED FOOD & BEVERAGES PROJECTED TO DRIVE MARKET GROWTH
    4.2 ATTRACTIVE OPPORTUNITIES IN POLYLACTIC ACID MARKET 
           FIGURE 22 BIODEGRADABLE PROPERTIES OF PLA PROJECTED TO DRIVE MARKET GROWTH
    4.3 GLOBAL LACTIC ACID MARKET: SHARES OF MAJOR REGIONAL SUBMARKETS 
           FIGURE 23 CHINA HOLDS LARGEST MARKET FOR LACTIC ACID IN 2023
    4.4 GLOBAL POLYLACTIC ACID MARKET: SHARES OF MAJOR REGIONAL SUBMARKETS 
           FIGURE 24 CHINA HOLDS LARGEST MARKET FOR POLYLACTIC ACID IN 2023
    4.5 NORTH AMERICA: LACTIC ACID MARKET, BY APPLICATION & KEY COUNTRY 
           FIGURE 25 BIO-DEGRADABLE POLYMERS ACCOUNTED FOR LARGEST MARKET SHARE IN NORTH AMERICA
    4.6 EUROPE: POLYLACTIC ACID MARKET, BY APPLICATION & KEY COUNTRY 
           FIGURE 26 PACKAGING ACCOUNTED FOR LARGEST MARKET SHARE IN NORTH AMERICA
    4.7 GLOBAL LACTIC ACID MARKET, BY RAW MATERIAL & REGION 
           FIGURE 27 NORTH AMERICA AND SUGARCANE PROJECTED TO DOMINATE MARKET
    4.8 GLOBAL LACTIC ACID MARKET, BY FORM 
           FIGURE 28 LIQUID FORM PROJECTED TO DOMINATE MARKET DURING FORECAST PERIOD
    4.9 GLOBAL LACTIC ACID MARKET, BY APPLICATION 
           FIGURE 29 BIODEGRADABLE POLYMERS PROJECTED TO DOMINATE MARKET
    4.10 Lactic Acid and Polylactic Acid Market, BY FOOD & BEVERAGE SUB-APPLICATION 
           FIGURE 30 BAKERY & CONFECTIONERY EXPECTED TO REGISTER GROWTH IN MARKET
    4.11 GLOBAL Lactic Acid and Polylactic Acid Market, BY APPLICATION 
                    FIGURE 31 PACKAGING PROJECTED TO DOMINATE POLYLACTIC ACID MARKET
 
5 LACTIC ACID & POLYLACTIC ACID MARKET OVERVIEW (Page No. - 70)
    5.1 INTRODUCTION 
           FIGURE 32 BIOPLASTICS: GLOBAL PRODUCTION CAPACITY, 2021–2027 (MILLION TON)
    5.2 MARKET DYNAMICS 
           FIGURE 33 LACTIC ACID & POLYLACTIC ACID MARKET DYNAMICS
           5.2.1 DRIVERS
                    5.2.1.1 High demand for lactic & polylactic acid in end user applications
                               FIGURE 34 POLYLACTIC ACID: GLOBAL PRODUCTION CAPACITY, BY END USER APPLICATION, 2022
                    5.2.1.2 Rising demand for environmentally friendly resources
                    5.2.1.3 Technological advancements to encourage production of lactic & polylactic acid
                               FIGURE 35 GLOBAL EXPENDITURE ON R&D, 2019-2021 (USD MILLION)
           5.2.2 RESTRAINTS
                    5.2.2.1 Fluctuations in raw material prices
                    5.2.2.2 Quality of packaged food & beverage products to become major concern for manufacturers
           5.2.3 OPPORTUNITIES
                    5.2.3.1 Multi-functionalities of lactic & polylactic acids leading to increased demand for biopolymers and cosmetic products
                    5.2.3.2 Government regulations and frameworks encouraging use of bioplastics
           5.2.4 CHALLENGES
                    5.2.4.1 Lack of process-specific technology for usage of lactic & polylactic acids in emerging economies
                    5.2.4.2 High initial investment costs borne by small & medium enterprises
 
6 INDUSTRY TRENDS (Page No. - 79)
    6.1 INTRODUCTION 
    6.2 VALUE CHAIN ANALYSIS 
           FIGURE 36 Lactic Acid and Polylactic Acid Market: VALUE CHAIN ANALYSIS
           6.2.1 RESEARCH AND PRODUCT DEVELOPMENT
           6.2.2 RAW MATERIAL SOURCING
           6.2.3 PRODUCTION AND PROCESSING
           6.2.4 DISTRIBUTION
           6.2.5 MARKETING AND SALES
    6.3 TRENDS/DISRUPTIONS IMPACTING CUSTOMERS’ BUSINESSES 
           FIGURE 37 REVENUE SHIFT FOR LACTIC ACID MARKET
    6.4 TARIFF AND REGULATORY LANDSCAPE 
           TABLE 3 NORTH AMERICA: LIST OF REGULATORY BODIES, GOVERNMENT AGENCIES, AND OTHER ORGANIZATIONS
           TABLE 4 EUROPE: LIST OF REGULATORY BODIES, GOVERNMENT AGENCIES, AND OTHER ORGANIZATIONS
           TABLE 5 ASIA PACIFIC: LIST OF REGULATORY BODIES, GOVERNMENT AGENCIES, AND OTHER ORGANIZATIONS
           TABLE 6 SOUTH AMERICA: LIST OF REGULATORY BODIES, GOVERNMENT AGENCIES, AND OTHER ORGANIZATIONS
           TABLE 7 REST OF THE WORLD: REGULATORY BODIES, GOVERNMENT AGENCIES, AND OTHER ORGANIZATIONS
    6.5 REGULATORY FRAMEWORK 
           6.5.1 NORTH AMERICA
           6.5.2 EUROPE
           6.5.3 ASIA
           6.5.4 OTHERS
    6.6 PATENT ANALYSIS 
           FIGURE 38 NUMBER OF PATENTS GRANTED FOR LACTIC ACID IN GLOBAL MARKET, 2013–2022
           FIGURE 39 REGIONAL ANALYSIS OF PATENTS GRANTED IN LACTIC ACID MARKET
           TABLE 8 LIST OF MAJOR PATENTS PERTAINING TO LACTIC ACID MARKET, 2013–2022
    6.7 TRADE ANALYSIS 
           TABLE 9 IMPORT VALUE OF LACTIC ACID FOR KEY COUNTRIES, 2022 (USD THOUSAND)
           TABLE 10 EXPORT VALUE OF LACTIC ACID FOR KEY COUNTRIES, 2022 (USD THOUSAND)
    6.8 PRICING ANALYSIS 
           6.8.1 AVERAGE SELLING PRICE TREND ANALYSIS
                    TABLE 11 LACTIC ACID MARKET: AVERAGE SELLING PRICE, BY REGION, 2020–2022 (USD PER TON)
                    TABLE 12 POLYLACTIC ACID MARKET: AVERAGE SELLING PRICE, BY REGION, 2020–2022 (USD PER TON)
    6.9 Lactic Acid and Polylactic Acid Market: ECOSYSTEM MARKET MAP 
           6.9.1 DEMAND SIDE
           6.9.2 SUPPLY SIDE
                    FIGURE 40 LACTIC ACID: MARKET MAP
                    TABLE 13 LACTIC ACID MARKET: ECOSYSTEM
    6.10 TECHNOLOGY ANALYSIS 
           6.10.1 IMMOBILIZED BIOREACTOR DESIGN FOR LACTIC ACID (LA) PRODUCTION
           6.10.2 GENETIC AND METABOLIC ENGINEERING
    6.11 CASE STUDIES 
           6.11.1 ENHANCED RESOURCE EFFICIENCY WITH NEW ENZYME DEVELOPMENT IN ADJUNCT BREWING
    6.12 PORTER’S FIVE FORCES ANALYSIS 
                    TABLE 14 LACTIC ACID MARKET: PORTER’S FIVE FORCES ANALYSIS
           6.12.1 INTENSITY OF COMPETITIVE RIVALRY
           6.12.2 BARGAINING POWER OF SUPPLIERS
           6.12.3 BARGAINING POWER OF BUYERS
           6.12.4 THREAT OF SUBSTITUTES
           6.12.5 THREAT OF NEW ENTRANTS
    6.13 KEY STAKEHOLDERS AND BUYING CRITERIA 
           6.13.1 KEY STAKEHOLDERS IN BUYING PROCESS
           6.13.2 KEY STAKEHOLDERS AND BUYING CRITERIA
                    FIGURE 41 INFLUENCE OF STAKEHOLDERS ON BUYING LACTIC ACID FOR DIFFERENT APPLICATIONS
           6.13.3 KEY STAKEHOLDERS AND BUYING CRITERIA
                    FIGURE 42 INFLUENCE OF STAKEHOLDERS ON BUYING POLYLACTIC ACID FOR DIFFERENT APPLICATIONS
                    TABLE 15 INFLUENCE OF STAKEHOLDERS ON BUYING PROCESS FOR LACTIC ACID, BY APPLICATION (%)
                    TABLE 16 INFLUENCE OF STAKEHOLDERS ON BUYING PROCESS FOR POLYLACTIC ACID, BY APPLICATION (%)
           6.13.4 BUYING CRITERIA
                    TABLE 17 KEY CRITERIA FOR SELECTING SUPPLIER/VENDOR
                    FIGURE 43 KEY CRITERIA FOR SELECTING SUPPLIERS/VENDORS
    6.14 KEY CONFERENCES AND EVENTS (2023–2024) 
                    TABLE 18 KEY CONFERENCES AND EVENTS IN LACTIC ACID MARKET, 2023–2024
 
7 LACTIC ACID MARKET, BY RAW MATERIALS (Page No. - 104)
    7.1 INTRODUCTION 
           FIGURE 44 Lactic Acid and Polylactic Acid Market SIZE (VALUE), BY RAW MATERIAL, 2023 VS. 2028
           TABLE 19 Lactic Acid and Polylactic Acid Market SIZE, BY RAW MATERIALS, 2018–2022 (USD MILLION)
           TABLE 20 Lactic Acid and Polylactic Acid Market SIZE, BY RAW MATERIALS, 2023–2028 (USD MILLION)
    7.2 CORN 
           7.2.1 COST-EFFECTIVENESS AND APPROPRIATE COMPOSITION TO MAKE IT PREFERRED RAW MATERIAL
                    TABLE 21 LACTIC ACID MARKET SIZE IN CORN, BY REGION, 2018–2022 (USD MILLION)
                    TABLE 22 LACTIC ACID MARKET SIZE IN CORN, BY REGION, 2023–2028 (USD MILLION)
    7.3 CASSAVA 
           7.3.1 HIGH CONTENT OF STARCH IN CASSAVA TO MAKE IT APPROPRIATE RAW MATERIAL
                    TABLE 23 LACTIC ACID MARKET SIZE IN CASSAVA, BY REGION, 2018–2022 (USD MILLION)
                    TABLE 24 LACTIC ACID MARKET SIZE IN CASSAVA, BY REGION, 2023–2028 (USD MILLION)
    7.4 SUGARCANE 
           7.4.1 SUGARCANE BAGASSE TO BE OBTAINED FROM AGRICULTURE AND DISTRIBUTED FOR RECYCLING
                    TABLE 25 LACTIC ACID MARKET SIZE IN SUGARCANE, BY REGION, 2018–2022 (USD MILLION)
                    TABLE 26 LACTIC ACID MARKET SIZE IN SUGARCANE, BY REGION, 2023–2028 (USD MILLION)
    7.5 YEAST EXTRACT 
           7.5.1 YEAST EXTRACT TO FACILITATE FERMENTATION PROCEDURE
                    TABLE 27 LACTIC ACID MARKET SIZE IN YEAST EXTRACT, BY REGION, 2018–2022 (USD MILLION)
                    TABLE 28 LACTIC ACID MARKET SIZE IN YEAST EXTRACT, BY REGION, 2023–2028 (USD MILLION)
    7.6 OTHERS 
           7.6.1 LIGNOCELLULOSIC AGRICULTURAL WASTE TO BE FOUND IN ABUNDANCE
                    TABLE 29 LACTIC ACID MARKET SIZE IN AGRICULTURE, BY REGION, 2018–2022 (USD MILLION)
                    TABLE 30 LACTIC ACID MARKET SIZE IN AGRICULTURE, BY REGION, 2023–2028 (USD MILLION)
 
8 LACTIC ACID MARKET, BY FORM (Page No. - 112)
    8.1 INTRODUCTION 
           FIGURE 45 Lactic Acid and Polylactic Acid Market SIZE, BY FORM, 2023 VS. 2028 (USD MILLION)
           TABLE 31 Lactic Acid and Polylactic Acid Market SIZE, BY FORM, 2018–2022 (USD MILLION)
           TABLE 32 Lactic Acid and Polylactic Acid Market SIZE, BY FORM, 2023–2028 (USD MILLION)
    8.2 LIQUID 
           8.2.1 EASE OF USE IN VARIOUS APPLICATIONS TO ENCOURAGE LACTIC ACID USAGE IN LIQUID FORM
                    TABLE 33 LIQUID LACTIC ACID MARKET SIZE, BY REGION, 2018–2022 (USD MILLION)
                    TABLE 34 LIQUID LACTIC ACID MARKET SIZE, BY REGION, 2023–2028 (USD MILLION)
    8.3 DRY 
           8.3.1 DRY FORM TO ENABLE IMPROVED ACCURACY OF DOSAGES
                    TABLE 35 DRY LACTIC ACID MARKET SIZE, BY REGION, 2018–2022 (USD MILLION)
                    TABLE 36 DRY LACTIC ACID MARKET SIZE, BY REGION, 2023–2028 (USD MILLION)
 
9 LACTIC ACID MARKET, BY APPLICATION (Page No. - 117)
    9.1 INTRODUCTION 
           FIGURE 46 LACTIC ACID MARKET SHARE (VALUE), BY APPLICATION, 2023 VS. 2028
           TABLE 37 LACTIC ACID MARKET SIZE, BY APPLICATION, 2018–2022 (USD MILLION)
           TABLE 38 LACTIC ACID MARKET SIZE, BY APPLICATION, 2023–2028 (USD MILLION)
    9.2 BIODEGRADABLE POLYMERS 
           TABLE 39 LACTIC ACID MARKET SIZE IN BIODEGRADABLE POLYMERS, BY REGION, 2018–2022 (USD MILLION)
           TABLE 40 LACTIC ACID MARKET SIZE IN BIODEGRADABLE POLYMERS, BY REGION, 2023–2028 (USD MILLION)
    9.3 FOOD & BEVERAGES 
           TABLE 41 LACTIC ACID MARKET SIZE IN FOOD & BEVERAGES, BY REGION, 2018–2022 (USD MILLION)
           TABLE 42 LACTIC ACID MARKET SIZE IN FOOD & BEVERAGES, BY REGION, 2023–2028 (USD MILLION)
           TABLE 43 LACTIC ACID MARKET SIZE IN FOOD & BEVERAGES, BY SUB-APPLICATION, 2018–2022 (USD MILLION)
           TABLE 44 LACTIC ACID MARKET SIZE IN FOOD & BEVERAGES, BY APPLICATION, 2023–2028 (USD MILLION)
           9.3.1 BEVERAGES
                    9.3.1.1 Use of lactic acid in beverages for superior shelf life
                               TABLE 45 LACTIC ACID MARKET SIZE IN BEVERAGES, BY REGION, 2018–2022 (USD MILLION)
                               TABLE 46 LACTIC ACID MARKET SIZE IN BEVERAGES, BY REGION, 2023–2028 (USD MILLION)
           9.3.2 BAKERY & CONFECTIONERY PRODUCTS
                    9.3.2.1 Usage of lactic acid to increase shelf life of bakery & confectionery
                               TABLE 47 LACTIC ACID MARKET SIZE IN BAKERY & CONFECTIONERY PRODUCTS, BY REGION, 2018–2022 (USD MILLION)
                               TABLE 48 LACTIC ACID MARKET SIZE IN BAKERY & CONFECTIONERY PRODUCTS, BY REGION, 2023–2028 (USD MILLION)
           9.3.3 DAIRY PRODUCTS
                    9.3.3.1 Mineral salts of lactic acid to fortify dairy products
                               TABLE 49 LACTIC ACID MARKET SIZE IN DAIRY PRODUCTS, BY REGION, 2018–2022 (USD MILLION)
                               TABLE 50 LACTIC ACID MARKET SIZE IN DAIRY PRODUCTS, BY REGION, 2023–2028 (USD MILLION)
           9.3.4 MEAT PRODUCTS
                    9.3.4.1 Lactic acid to preserve taste and tenderness of meat & products
                               TABLE 51 LACTIC ACID MARKET SIZE IN MEAT PRODUCTS, BY REGION, 2018–2022 (USD MILLION)
                               TABLE 52 LACTIC ACID MARKET SIZE IN MEAT PRODUCTS, BY REGION, 2023–2028 (USD MILLION)
           9.3.5 OTHER FOOD PRODUCTS
                    9.3.5.1 Lactic acid to replace acetic acid and vinegar as food additives
                               TABLE 53 LACTIC ACID MARKET SIZE IN OTHER FOOD PRODUCTS, BY REGION, 2018–2022 (USD MILLION)
                               TABLE 54 LACTIC ACID MARKET SIZE IN OTHER FOOD PRODUCTS, BY REGION, 2023–2028 (USD MILLION)
    9.4 PERSONAL CARE PRODUCTS 
           9.4.1 CONSUMER PREFERENCE TO ENCOURAGE DEMAND FOR CLEAN-LABEL PERSONAL CARE AND COSMETIC PRODUCTS
                    TABLE 55 LACTIC ACID MARKET SIZE IN PERSONAL CARE PRODUCTS, BY REGION, 2018–2022 (USD MILLION)
                    TABLE 56 LACTIC ACID MARKET SIZE IN PERSONAL CARE PRODUCTS, BY REGION, 2023–2028 (USD MILLION)
    9.5 PHARMACEUTICAL PRODUCTS 
           9.5.1 LACTIC ACID TO BE USED AS ELECTROLYTE IN PARENTERAL & INTRAVENOUS SOLUTIONS
                    TABLE 57 LACTIC ACID MARKET SIZE IN PHARMACEUTICAL PRODUCTS, BY REGION, 2018–2022 (USD MILLION)
                    TABLE 58 LACTIC ACID MARKET SIZE IN PHARMACEUTICAL PRODUCTS, BY REGION, 2023–2028 (USD MILLION)
    9.6 OTHER APPLICATIONS 
           9.6.1 LACTIC ACID TO BE USED IN VARIOUS APPLICATIONS DUE TO ITS NON-TOXIC BIODEGRADABLE NATURE
                    TABLE 59 LACTIC ACID MARKET SIZE IN OTHER APPLICATIONS, BY REGION, 2018–2022 (USD MILLION)
                    TABLE 60 LACTIC ACID MARKET SIZE IN OTHER APPLICATIONS, BY REGION, 2023–2028 (USD MILLION)
 
10 POLYLACTIC ACID MARKET, BY APPLICATION (Page No. - 131)
     10.1 INTRODUCTION 
               FIGURE 47 POLYLACTIC ACID MARKET SIZE (VALUE), BY APPLICATION, 2023 VS. 2028
               TABLE 61 POLYLACTIC ACID MARKET SIZE, BY APPLICATION, 2018–2022 (USD MILLION)
               TABLE 62 POLYLACTIC ACID MARKET SIZE, BY APPLICATION, 2023–2028 (USD MILLION)
     10.2 PACKAGING 
               TABLE 63 POLYLACTIC ACID MARKET SIZE IN PACKAGING, BY REGION, 2018–2022 (USD MILLION)
               TABLE 64 POLYLACTIC ACID MARKET SIZE IN PACKAGING, BY REGION, 2023–2028 (USD MILLION)
             10.2.1 RIGID PACKAGING
                       10.2.1.1 Polylactic acid-based rigid packaging to be used in biodegradable and compostable food services packages
             10.2.2 COMPOST BAGS
                       10.2.2.1 Usage of composite bags to mitigate organic waste
             10.2.3 LOOSE-FILL PACKAGING
                       10.2.3.1 Loose-fill packaging to help reduce freight cost
     10.3 FIBER & FABRICS 
             10.3.1 RENEWABLE NATURE AND TRANSFORMATION ENERGY OF PLA TO DRIVE DEMAND IN TEXTILE
                       TABLE 65 POLYLACTIC ACID MARKET SIZE IN FIBER & FABRICS, BY REGION, 2018–2022 (USD MILLION)
                       TABLE 66 POLYLACTIC ACID MARKET SIZE IN FIBER & FABRICS, BY REGION, 2023–2028 (USD MILLION)
     10.4 AUTOMOBILES 
             10.4.1 INCREASED PREFERENCE FOR TENSILE PLASTIC ALTERNATIVE TO FUEL DEMAND
                       TABLE 67 POLYLACTIC ACID MARKET SIZE IN AUTOMOBILES, BY REGION, 2018–2022 (USD MILLION)
                       TABLE 68 POLYLACTIC ACID MARKET SIZE IN AUTOMOBILES, BY REGION, 2023–2028 (USD MILLION)
     10.5 ELECTRONICS & ELECTRICALS 
             10.5.1 USAGE OF POLYLACTIC ACID IN ELECTRONICS TO REMAIN LOW
                       TABLE 69 POLYLACTIC ACID MARKET SIZE IN ELECTRONICS & ELECTRICALS, BY REGION, 2018–2022 (USD MILLION)
                       TABLE 70 POLYLACTIC ACID MARKET SIZE IN ELECTRONICS & ELECTRICALS, BY REGION, 2023–2028 (USD MILLION)
     10.6 AGRICULTURE 
             10.6.1 POLYLACTIC ACID TO REPLACE MULCH FILMS IN AGRICULTURE
                       TABLE 71 POLYLACTIC ACID MARKET SIZE IN AGRICULTURE, BY REGION, 2018–2022 (USD MILLION)
                       TABLE 72 POLYLACTIC ACID MARKET SIZE IN AGRICULTURE, BY REGION, 2023–2028 (USD MILLION)
     10.7 OTHER APPLICATIONS 
             10.7.1 POLYLACTIC ACID TO BE USED IN VARIOUS APPLICATIONS DUE TO ITS BIOCOMPATIBLE NATURE
                       TABLE 73 POLYLACTIC ACID MARKET SIZE IN OTHER APPLICATIONS, BY REGION, 2018–2022(USD MILLION)
                       TABLE 74 POLYLACTIC ACID MARKET SIZE IN OTHER APPLICATIONS, BY REGION, 2023–2028 (USD MILLION)
 
11 LACTIC ACID MARKET, BY REGION (Page No. - 142)
     11.1 INTRODUCTION 
               FIGURE 48 REGIONAL SNAPSHOT: NEW HOTSPOTS TO EMERGE IN ASIA PACIFIC, 2023 VS. 2028
               TABLE 75 LACTIC ACID MARKET, BY REGION, 2018–2022 (USD MILLION)
               TABLE 76 LACTIC ACID MARKET, BY REGION, 2023–2028 (USD MILLION)
               TABLE 77 LACTIC ACID MARKET, BY REGION, 2018–2022 (KT)
               TABLE 78 LACTIC ACID MARKET, BY REGION, 2023–2028 (KT)
     11.2 NORTH AMERICA 
               FIGURE 49 NORTH AMERICA: LACTIC ACID MARKET SNAPSHOT
             11.2.1 NORTH AMERICA: RECESSION IMPACT
                       FIGURE 50 NORTH AMERICAN LACTIC ACID MARKET: RECESSION IMPACT ANALYSIS
                       TABLE 79 NORTH AMERICA: LACTIC ACID MARKET, BY COUNTRY, 2018–2022 (USD MILLION)
                       TABLE 80 NORTH AMERICA: LACTIC ACID MARKET, BY COUNTRY, 2023–2028 (USD MILLION)
                       TABLE 81 NORTH AMERICA: LACTIC ACID MARKET, BY COUNTRY, 2018–2022 (KT)
                       TABLE 82 NORTH AMERICA: LACTIC ACID MARKET, BY COUNTRY, 2023–2028 (KT)
                       TABLE 83 NORTH AMERICA: LACTIC ACID MARKET, BY APPLICATION, 2018–2022 (USD MILLION)
                       TABLE 84 NORTH AMERICA: LACTIC ACID MARKET, BY APPLICATION, 2023–2028 (USD MILLION)
                       TABLE 85 NORTH AMERICA: LACTIC ACID MARKET IN FOOD & BEVERAGES, BY SUB-APPLICATION, 2018–2022 (USD MILLION)
                       TABLE 86 NORTH AMERICA: LACTIC ACID MARKET SIZE IN FOOD & BEVERAGES, BY SUB-APPLICATION, 2023–2028 (USD MILLION)
                       TABLE 87 NORTH AMERICA: LACTIC ACID MARKET, BY RAW MATERIALS, 2018–2022 (USD MILLION)
                       TABLE 88 NORTH AMERICA: LACTIC ACID MARKET, BY RAW MATERIALS, 2023–2028 (USD MILLION)
                       TABLE 89 NORTH AMERICA: LACTIC ACID MARKET, BY FORM, 2018–2022 (USD MILLION)
                       TABLE 90 NORTH AMERICA: LACTIC ACID MARKET, BY FORM, 2023–2028 (USD MILLION)
             11.2.2 US
                       11.2.2.1 Increase in investments, expansions, and product launches to encourage growth of bioplastics & biopolymers
                                   TABLE 91 US: LACTIC ACID MARKET, BY APPLICATION, 2018–2022 (USD MILLION)
                                   TABLE 92 US: LACTIC ACID MARKET, BY APPLICATION, 2023–2028 (USD MILLION)
             11.2.3 CANADA
                       11.2.3.1 Reducing plastic waste and enhancing environmental sustainability to increase demand for alternative materials and packaging solutions
                                   TABLE 93 CANADA: LACTIC ACID MARKET, BY APPLICATION, 2018–2022 (USD MILLION)
                                   TABLE 94 CANADA: LACTIC ACID MARKET, BY APPLICATION, 2023–2028 (USD MILLION)
             11.2.4 MEXICO
                       11.2.4.1 Use of biodegradable plastics in various food packaging applications to drive demand for lactic acid
                                   TABLE 95 MEXICO: LACTIC ACID MARKET, BY APPLICATION, 2018–2022 (USD MILLION)
                                   TABLE 96 MEXICO: LACTIC ACID MARKET, BY APPLICATION, 2023–2028 (USD MILLION)
     11.3 EUROPE 
             11.3.1 EUROPE: RECESSION IMPACT
                       TABLE 97 EUROPE: LACTIC ACID MARKET, BY COUNTRY, 2018–2022 (USD MILLION)
                       TABLE 98 EUROPE: LACTIC ACID MARKET, BY COUNTRY, 2023–2028 (USD MILLION)
                       TABLE 99 EUROPE: LACTIC ACID MARKET, BY COUNTRY, 2018–2022 (KT)
                       TABLE 100 EUROPE: LACTIC ACID MARKET, BY COUNTRY, 2023–2028 (KT)
                       TABLE 101 EUROPE: LACTIC ACID MARKET, BY APPLICATION, 2018–2022 (USD MILLION)
                       TABLE 102 EUROPE: LACTIC ACID MARKET, BY APPLICATION, 2023–2028 (USD MILLION)
                       TABLE 103 EUROPE: LACTIC ACID MARKET IN FOOD & BEVERAGES, BY SUB-APPLICATION, 2018–2022 (USD MILLION)
                       TABLE 104 EUROPE: LACTIC ACID MARKET IN FOOD & BEVERAGES, BY SUB-APPLICATION, 2023–2028 (USD MILLION)
                       TABLE 105 EUROPE: LACTIC ACID MARKET, BY RAW MATERIALS, 2018–2022 (USD MILLION)
                       TABLE 106 EUROPE: LACTIC ACID MARKET, BY RAW MATERIALS, 2023–2028 (USD MILLION)
                       TABLE 107 EUROPE: LACTIC ACID MARKET, BY FORM, 2018–2022 (USD MILLION)
                       TABLE 108 EUROPE: LACTIC ACID MARKET, BY FORM, 2023–2028 (USD MILLION)
             11.3.2 GERMANY
                       11.3.2.1 Government regulations to encourage recycling of packaging waste
                                   TABLE 109 GERMANY: LACTIC ACID MARKET, BY APPLICATION, 2018–2022 (USD MILLION)
                                   TABLE 110 GERMANY: LACTIC ACID MARKET, BY APPLICATION, 2023–2028 (USD MILLION)
             11.3.3 ITALY
                       11.3.3.1 Ban on conventional plastic items to enhance demand for bioplastic materials
                                   TABLE 111 ITALY: LACTIC ACID MARKET, BY APPLICATION, 2018–2022 (USD MILLION)
                                   TABLE 112 ITALY: LACTIC ACID MARKET, BY APPLICATION, 2023–2028 (USD MILLION)
             11.3.4 SPAIN
                       11.3.4.1 Growing awareness regarding use of biodegradable polymers to boost market
                                   TABLE 113 SPAIN: LACTIC ACID MARKET, BY APPLICATION, 2018–2022 (USD MILLION)
                                   TABLE 114 SPAIN: LACTIC ACID MARKET, BY APPLICATION, 2023–2028 (USD MILLION)
             11.3.5 FRANCE
                       11.3.5.1 Demand for lactic acid as functional additive to drive market growth
                                   TABLE 115 FRANCE: LACTIC ACID MARKET, BY APPLICATION, 2018–2022 (USD MILLION)
                                   TABLE 116 FRANCE: LACTIC ACID MARKET, BY APPLICATION, 2023–2028 (USD MILLION)
             11.3.6 UK
                       11.3.6.1 Demand for bioplastic & biopolymer products projected to grow during forecast period
                                   TABLE 117 UK: LACTIC ACID MARKET, BY APPLICATION, 2018–2022 (USD MILLION)
                                   TABLE 118 UK: LACTIC ACID MARKET, BY APPLICATION, 2023–2028 (USD MILLION)
             11.3.7 REST OF EUROPE
                       11.3.7.1 Poland, Netherlands, and Belgium to be major consumers of lactic acid
                                   TABLE 119 REST OF EUROPE: LACTIC ACID MARKET, BY APPLICATION, 2018–2022 (USD MILLION)
                                   TABLE 120 REST OF EUROPE: LACTIC ACID MARKET, BY APPLICATION, 2023–2028 (USD MILLION)
     11.4 ASIA PACIFIC 
               FIGURE 51 ASIA PACIFIC: LACTIC ACID MARKET SNAPSHOT
             11.4.1 ASIA PACIFIC: RECESSION IMPACT
                       TABLE 121 ASIA PACIFIC: LACTIC ACID MARKET, BY COUNTRY, 2018–2022 (USD MILLION)
                       TABLE 122 ASIA PACIFIC: LACTIC ACID MARKET, BY COUNTRY, 2023–2028 (USD MILLION)
                       TABLE 123 ASIA PACIFIC: LACTIC ACID MARKET, BY COUNTRY, 2018–2022 (KT)
                       TABLE 124 ASIA PACIFIC: LACTIC ACID MARKET, BY COUNTRY, 2023–2028 (KT)
                       TABLE 125 ASIA PACIFIC: LACTIC ACID MARKET, BY APPLICATION, 2018–2022 (USD MILLION)
                       TABLE 126 ASIA PACIFIC: LACTIC ACID MARKET, BY APPLICATION, 2023–2028 (USD MILLION)
                       TABLE 127 ASIA PACIFIC: LACTIC ACID MARKET IN FOOD & BEVERAGES, BY SUB-APPLICATION, 2018–2022 (USD MILLION)
                       TABLE 128 ASIA PACIFIC: LACTIC ACID MARKET IN FOOD & BEVERAGES, BY SUB-APPLICATION, 2023–2028 (USD MILLION)
                       TABLE 129 ASIA PACIFIC: LACTIC ACID MARKET, BY RAW MATERIALS, 2018–2022 (USD MILLION)
                       TABLE 130 ASIA PACIFIC: LACTIC ACID MARKET, BY RAW MATERIALS, 2023–2028 (USD MILLION)
                       TABLE 131 ASIA PACIFIC: LACTIC ACID MARKET, BY FORM, 2018–2022 (USD MILLION)
                       TABLE 132 ASIA PACIFIC: LACTIC ACID MARKET, BY FORM, 2023–2028 (USD MILLION)
             11.4.2 CHINA
                       11.4.2.1 High demand for lactic acid among key players to drive growth of biodegradable polymers
                                   TABLE 133 CHINA: LACTIC ACID MARKET, BY APPLICATION, 2018–2022 (USD MILLION)
                                   TABLE 134 CHINA: LACTIC ACID MARKET, BY APPLICATION, 2023–2028 (USD MILLION)
             11.4.3 JAPAN
                       11.4.3.1 Advancements in pharmaceuticals to drive market growth
                                   TABLE 135 JAPAN: LACTIC ACID MARKET, BY APPLICATION, 2018–2022 (USD MILLION)
                                   TABLE 136 JAPAN: LACTIC ACID MARKET, BY APPLICATION, 2023–2028 (USD MILLION)
             11.4.4 INDIA
                       11.4.4.1 Advancements in technology for lactic acid usage in food & beverage applications to drive market growth
                                   TABLE 137 INDIA: LACTIC ACID MARKET, BY APPLICATION, 2018–2022 (USD MILLION)
                                   TABLE 138 INDIA: LACTIC ACID MARKET, BY APPLICATION, 2023–2028 (USD MILLION)
             11.4.5 AUSTRALIA & NEW ZEALAND
                       11.4.5.1 Rising demand for natural and safe ingredients in personal care products to lead to market growth
                                   TABLE 139 AUSTRALIA & NEW ZEALAND: LACTIC ACID MARKET, BY APPLICATION, 2018–2022 (USD MILLION)
                                   TABLE 140 AUSTRALIA & NEW ZEALAND: LACTIC ACID MARKET, BY APPLICATION, 2023–2028 (USD MILLION)
             11.4.6 REST OF ASIA PACIFIC
                       11.4.6.1 Food & beverage manufacturers to opt for lactic acid as alternative to traditional chemicals
                                   TABLE 141 REST OF ASIA PACIFIC: LACTIC ACID MARKET, BY APPLICATION, 2018–2022 (USD MILLION)
                                   TABLE 142 REST OF ASIA PACIFIC: LACTIC ACID MARKET, BY APPLICATION, 2023–2028 (USD MILLION)
     11.5 ROW 
             11.5.1 ROW: RECESSION IMPACT
                       TABLE 143 ROW: LACTIC ACID MARKET, BY COUNTRY, 2018–2022 (USD MILLION)
                       TABLE 144 ROW: LACTIC ACID MARKET, BY COUNTRY, 2023–2028 (USD MILLION)
                       TABLE 145 ROW: LACTIC ACID MARKET, BY REGION, 2018–2022 (KT)
                       TABLE 146 ROW: LACTIC ACID MARKET, BY REGION, 2023–2028 (KT)
                       TABLE 147 ROW: LACTIC ACID MARKET, BY APPLICATION, 2018–2022 (USD MILLION)
                       TABLE 148 ROW: LACTIC ACID MARKET, BY APPLICATION, 2023–2028 (USD MILLION)
                       TABLE 149 ROW: LACTIC ACID MARKET IN FOOD & BEVERAGES, BY SUB-APPLICATION, 2018–2022 (USD MILLION)
                       TABLE 150 ROW: LACTIC ACID MARKET SIZE IN FOOD & BEVERAGES, BY SUB-APPLICATION, 2023–2028 (USD MILLION)
                       TABLE 151 ROW: LACTIC ACID MARKET, BY RAW MATERIALS, 2018–2022 (USD MILLION)
                       TABLE 152 ROW: LACTIC ACID MARKET, BY RAW MATERIALS, 2023–2028 (USD MILLION)
                       TABLE 153 ROW: LACTIC ACID MARKET, BY FORM, 2018–2022 (USD MILLION)
                       TABLE 154 ROW: LACTIC ACID MARKET, BY FORM, 2023–2028 (USD MILLION)
             11.5.2 SOUTH AMERICA
                       11.5.2.1 Biodegradable polymers to witness significant demand as key companies set up manufacturing units in South America
                                   TABLE 155 SOUTH AMERICA: LACTIC ACID MARKET, BY APPLICATION, 2018–2022 (USD MILLION)
                                   TABLE 156 SOUTH AMERICA: LACTIC ACID MARKET, BY APPLICATION, 2023–2028 (USD MILLION)
             11.5.3 MIDDLE EAST
                       11.5.3.1 Expansion of food processing industry to drive market growth
                                   TABLE 157 MIDDLE EAST: LACTIC ACID MARKET, BY APPLICATION, 2018–2022 (USD MILLION)
                                   TABLE 158 MIDDLE EAST: LACTIC ACID MARKET, BY APPLICATION, 2023–2028 (USD MILLION)
             11.5.4 AFRICA
                       11.5.4.1 Rising plastic usage to lead to increased demand for lactic acid in Africa
                                   TABLE 159 AFRICA: LACTIC ACID MARKET, BY APPLICATION, 2018–2022 (USD MILLION)
                                   TABLE 160 AFRICA: LACTIC ACID MARKET, BY APPLICATION, 2023–2028 (USD MILLION)
 
12 POLYLACTIC ACID MARKET, BY REGION (Page No. - 183)
     12.1 INTRODUCTION 
               FIGURE 52 REGIONAL SNAPSHOT: CHINA RECORDS SIGNIFICANT GROWTH RATE
               TABLE 161 POLYLACTIC ACID MARKET SIZE, BY REGION, 2018–2022 (USD MILLION)
               TABLE 162 POLYLACTIC ACID MARKET SIZE, BY REGION, 2023–2028 (USD MILLION)
               TABLE 163 POLYLACTIC ACID MARKET SIZE, BY REGION, 2018–2022 (KT)
               TABLE 164 POLYLACTIC ACID MARKET SIZE, BY REGION, 2023–2028 (KT)
     12.2 NORTH AMERICA 
               TABLE 165 NORTH AMERICA: POLYLACTIC ACID MARKET SIZE, BY COUNTRY, 2018–2022 (USD MILLION)
               TABLE 166 NORTH AMERICA: POLYLACTIC ACID MARKET SIZE, BY COUNTRY, 2023–2028 (USD MILLION)
               TABLE 167 NORTH AMERICA: POLYLACTIC ACID MARKET SIZE, BY COUNTRY, 2018–2022 (KT)
               TABLE 168 NORTH AMERICA: POLYLACTIC ACID MARKET SIZE, BY COUNTRY, 2023–2028 (KT)
               TABLE 169 NORTH AMERICA: POLYLACTIC ACID MARKET SIZE, BY APPLICATION, 2018–2022 (USD MILLION)
               TABLE 170 NORTH AMERICA: POLYLACTIC ACID MARKET SIZE, BY APPLICATION, 2023–2028 (USD MILLION)
               TABLE 171 NORTH AMERICA: POLYLACTIC ACID MARKET SIZE, BY COUNTRY, 2018–2022 (USD MILLION)
               TABLE 172 NORTH AMERICA: POLYLACTIC ACID MARKET SIZE, BY COUNTRY, 2023–2028 (USD MILLION)
             12.2.1 US
                       12.2.1.1 Rising awareness for reducing plastic waste to drive market growth
                                   TABLE 173 US: POLYLACTIC ACID MARKET SIZE, BY APPLICATION, 2018–2022 (USD MILLION)
                                   TABLE 174 US: POLYLACTIC ACID MARKET SIZE, BY APPLICATION, 2023–2028 (USD MILLION)
             12.2.2 CANADA
                       12.2.2.1 Government regulations to deter plastic use to drive market growth
                                   TABLE 175 CANADA: POLYLACTIC ACID MARKET SIZE, BY APPLICATION, 2018–2022 (USD MILLION)
                                   TABLE 176 CANADA: POLYLACTIC ACID MARKET SIZE, BY APPLICATION, 2023–2028 (USD MILLION)
             12.2.3 MEXICO
                       12.2.3.1 Increased demand for biodegradable bags to drive market growth
                                   TABLE 177 MEXICO: POLYLACTIC ACID MARKET SIZE, BY APPLICATION, 2018–2022 (USD MILLION)
                                   TABLE 178 MEXICO: POLYLACTIC ACID MARKET SIZE, BY APPLICATION, 2023–2028 (USD MILLION)
     12.3 EUROPE 
               FIGURE 53 EUROPE: MARKET SNAPSHOT
               TABLE 179 EUROPE: Lactic Acid and Polylactic Acid Market SIZE, BY COUNTRY, 2018–2022 (USD MILLION)
               TABLE 180 EUROPE: Lactic Acid and Polylactic Acid Market SIZE, BY COUNTRY, 2023–2028 (USD MILLION)
               TABLE 181 EUROPE: Lactic Acid and Polylactic Acid Market SIZE, BY COUNTRY, 2018–2022 (KT)
               TABLE 182 EUROPE: Lactic Acid and Polylactic Acid Market SIZE, BY COUNTRY, 2023–2028 (KT)
               TABLE 183 EUROPE: Lactic Acid and Polylactic Acid Market SIZE, BY APPLICATION, 2018–2022 (USD MILLION)
               TABLE 184 EUROPE: Lactic Acid and Polylactic Acid Market SIZE, BY APPLICATION, 2023–2028 (USD MILLION)
             12.3.1 GERMANY
                       12.3.1.1 Increased demand for biopolymer automobile components to fuel market growth
                                   TABLE 185 GERMANY: POLYLACTIC ACID MARKET SIZE, BY APPLICATION, 2018–2022 (USD MILLION)
                                   TABLE 186 GERMANY: POLYLACTIC ACID MARKET SIZE, BY APPLICATION, 2023–2028 (USD MILLION)
             12.3.2 ITALY
                       12.3.2.1 Increased awareness for environmentally friendly products among Italian customers to drive market growth
                                   TABLE 187 ITALY: POLYLACTIC ACID MARKET SIZE, BY APPLICATION, 2018–2022 (USD MILLION)
                                   TABLE 188 ITALY: POLYLACTIC ACID MARKET SIZE, BY APPLICATION, 2023–2028 (USD MILLION)
             12.3.3 SPAIN
                       12.3.3.1 Rising demand for processed food products to boost market growth
                                   TABLE 189 SPAIN: POLYLACTIC ACID MARKET SIZE, BY APPLICATION, 2018–2022 (USD MILLION)
                                   TABLE 190 SPAIN: POLYLACTIC ACID MARKET SIZE, BY APPLICATION, 2023–2028 (USD MILLION)
             12.3.4 UK
                       12.3.4.1 Growth opportunities for manufacturers in automobile industry to drive market growth
                                   TABLE 191 UK: POLYLACTIC ACID MARKET SIZE, BY APPLICATION, 2018–2022 (USD MILLION)
                                   TABLE 192 UK: POLYLACTIC ACID MARKET SIZE, BY APPLICATION, 2023–2028 (USD MILLION)
             12.3.5 FRANCE
                       12.3.5.1 Expansion of key players to drive market growth
                                   TABLE 193 FRANCE: POLYLACTIC ACID MARKET SIZE, BY APPLICATION, 2018–2022 (USD MILLION)
                                   TABLE 194 FRANCE: POLYLACTIC ACID MARKET SIZE, BY APPLICATION, 2023–2028 (USD MILLION)
             12.3.6 REST OF EUROPE
                       12.3.6.1 Industrial developments to enhance use in packaging and agriculture
                                   TABLE 195 REST OF EUROPE: POLYLACTIC ACID MARKET SIZE, BY APPLICATION, 2018–2022 (USD MILLION)
                                   TABLE 196 REST OF EUROPE: POLYLACTIC ACID MARKET SIZE, BY APPLICATION, 2023–2028 (USD MILLION)
     12.4 ASIA PACIFIC 
               FIGURE 54 ASIA PACIFIC: Lactic Acid and Polylactic Acid Market SNAPSHOT
               TABLE 197 ASIA PACIFIC: Lactic Acid and Polylactic Acid Market SIZE, BY COUNTRY, 2018–2022 (USD MILLION)
               TABLE 198 ASIA PACIFIC: Lactic Acid and Polylactic Acid Market SIZE, BY COUNTRY, 2023–2028 (USD MILLION)
               TABLE 199 ASIA PACIFIC: Lactic Acid and Polylactic Acid Market SIZE, BY COUNTRY, 2018–2022 (KT)
               TABLE 200 ASIA PACIFIC: Lactic Acid and Polylactic Acid Market SIZE, BY COUNTRY, 2023–2028 (KT)
               TABLE 201 ASIA PACIFIC: Lactic Acid and Polylactic Acid Market SIZE, BY APPLICATION, 2018–2022 (USD MILLION)
               TABLE 202 ASIA PACIFIC: Lactic Acid and Polylactic Acid Market SIZE, BY APPLICATION, 2023–2028 (USD MILLION)
             12.4.1 CHINA
                       12.4.1.1 Biodegradable nature of PLA to fuel its demand in various industries
                                   TABLE 203 CHINA: POLYLACTIC ACID MARKET SIZE, BY APPLICATION, 2018–2022 (USD MILLION)
                                   TABLE 204 CHINA: POLYLACTIC ACID MARKET SIZE, BY APPLICATION, 2023–2028 (USD MILLION)
             12.4.2 JAPAN
                       12.4.2.1 Advancements in automobile industry to drive market growth
                                   TABLE 205 JAPAN: POLYLACTIC ACID MARKET SIZE, BY APPLICATION, 2018–2022 (USD MILLION)
                                   TABLE 206 JAPAN: POLYLACTIC ACID MARKET SIZE, BY APPLICATION, 2023–2028 (USD MILLION)
             12.4.3 INDIA
                       12.4.3.1 Rising demand for processed food to encourage growth of eco-friendly food packaging applications
                                   TABLE 207 INDIA: POLYLACTIC ACID MARKET SIZE, BY APPLICATION, 2018–2022 (USD MILLION)
                                   TABLE 208 INDIA: POLYLACTIC ACID MARKET SIZE, BY APPLICATION, 2023–2028 (USD MILLION)
             12.4.4 AUSTRALIA & NEW ZEALAND
                       12.4.4.1 Decrease in raw material prices to encourage usage of PLA
                                   TABLE 209 AUSTRALIA & NEW ZEALAND: POLYLACTIC ACID MARKET SIZE, BY APPLICATION, 2018–2022 (USD MILLION)
                                   TABLE 210 AUSTRALIA & NEW ZEALAND: POLYLACTIC ACID MARKET SIZE, BY APPLICATION, 2023–2028 (USD MILLION)
             12.4.5 REST OF ASIA PACIFIC
                       12.4.5.1 Manufacturers to opt for PLA as an alternative to traditional plastics
                                   TABLE 211 REST OF ASIA PACIFIC: POLYLACTIC ACID MARKET SIZE, BY APPLICATION, 2018–2022 (USD MILLION)
                                   TABLE 212 REST OF ASIA PACIFIC: POLYLACTIC ACID MARKET SIZE, BY APPLICATION, 2023–2028 (USD MILLION)
     12.5 REST OF THE WORLD (ROW) 
               TABLE 213 ROW: Lactic Acid and Polylactic Acid Market SIZE, BY COUNTRY, 2018–2022 (USD MILLION)
               TABLE 214 ROW: Lactic Acid and Polylactic Acid Market SIZE, BY COUNTRY, 2023–2028 (USD MILLION)
               TABLE 215 ROW: Lactic Acid and Polylactic Acid Market SIZE, BY COUNTRY, 2018–2022 (KT)
               TABLE 216 ROW: Lactic Acid and Polylactic Acid Market SIZE, BY COUNTRY, 2023–2028 (KT)
               TABLE 217 ROW: Lactic Acid and Polylactic Acid Market SIZE, BY APPLICATION, 2018–2022 (USD MILLION)
               TABLE 218 ROW: Lactic Acid and Polylactic Acid Market SIZE, BY APPLICATION, 2023–2028 (USD MILLION)
               TABLE 219 ROW: Lactic Acid and Polylactic Acid Market SIZE, BY COUNTRY, 2018–2022 (USD MILLION)
               TABLE 220 ROW: Lactic Acid and Polylactic Acid Market SIZE, BY COUNTRY, 2023–2028 (USD MILLION)
             12.5.1 SOUTH AMERICA
                       12.5.1.1 Increased export of biopolymers to drive market growth
                                   TABLE 221 SOUTH AMERICA: POLYLACTIC ACID MARKET SIZE, BY APPLICATION, 2018–2022 (USD MILLION)
                                   TABLE 222 SOUTH AMERICA: POLYLACTIC ACID MARKET SIZE, BY APPLICATION, 2023–2028 (USD MILLION)
             12.5.2 MIDDLE EAST
                       12.5.2.1 Key manufacturers to opt for biodegradable materials for usage in industrial applications
                                   TABLE 223 MIDDLE EAST: POLYLACTIC ACID MARKET SIZE, BY APPLICATION, 2018–2022 (USD MILLION)
                                   TABLE 224 MIDDLE EAST: POLYLACTIC ACID MARKET SIZE, BY APPLICATION, 2023–2028 (USD MILLION)
             12.5.3 AFRICA
                       12.5.3.1 Sluggish economic growth and low-technological development to lead to muted market demand
                                   TABLE 225 AFRICA: POLYLACTIC ACID MARKET SIZE, BY APPLICATION, 2018–2022 (USD MILLION)
                                   TABLE 226 AFRICA: POLYLACTIC ACID MARKET SIZE, BY APPLICATION, 2023–2028 (USD MILLION)
 
13 COMPETITIVE LANDSCAPE (Page No. - 217)
     13.1 OVERVIEW 
     13.2 STRATEGIES ADOPTED BY KEY PLAYERS 
               TABLE 227 OVERVIEW OF STRATEGIES ADOPTED BY KEY PLAYERS
     13.3 HISTORICAL REVENUE ANALYSIS OF KEY PLAYERS 
               FIGURE 55 REVENUE ANALYSIS OF KEY PLAYERS IN Lactic Acid and Polylactic Acid Market, 2020–2022 (USD BILLION)
     13.4 MARKET SHARE ANALYSIS 
               TABLE 228 MARKET SHARE ANALYSIS OF Lactic Acid and Polylactic Acid Market, 2022
     13.5 COMPANY EVALUATION QUADRANT (KEY PLAYERS) 
             13.5.1 STARS
             13.5.2 EMERGING LEADERS
             13.5.3 PERVASIVE PLAYERS
             13.5.4 EMERGING COMPANIES
                       FIGURE 56 GLOBAL LACTIC ACID & POLYLACTIC ACID MARKET, COMPANY EVALUATION QUADRANT, KEY PLAYERS, 2022
             13.5.5 COMPETITIVE BENCHMARKING
                       TABLE 229 LACTIC ACID MARKET: COMPANY APPLICATION FOOTPRINT
                       TABLE 230 LACTIC ACID MARKET: COMPANY REGION FOOTPRINT
                       TABLE 231 POLYLACTIC ACID MARKET: COMPANY APPLICATION FOOTPRINT
                       TABLE 232 POLYLACTIC ACID MARKET: COMPANY REGION FOOTPRINT
     13.6 Lactic Acid and Polylactic Acid Market: EVALUATION QUADRANT OF STARTUPS/SMES 
             13.6.1 PROGRESSIVE COMPANIES
             13.6.2 STARTING BLOCKS
             13.6.3 RESPONSIVE COMPANIES
             13.6.4 DYNAMIC COMPANIES
                       FIGURE 57 LACTIC ACID MARKET: EVALUATION QUADRANT OF STARTUPS/SMES
             13.6.5 COMPETITIVE BENCHMARKING
                       TABLE 233 LACTIC ACID MARKET: DETAILED LIST OF KEY STARTUPS/SMES
                       TABLE 234 LACTIC ACID MARKET: COMPETITIVE BENCHMARKING OF STARTUPS/SMES
                       TABLE 235 POLYLACTIC ACID MARKET: COMPETITIVE BENCHMARKING OF STARTUPS/SMES
     13.7 COMPETITIVE SCENARIO 
             13.7.1 PRODUCT LAUNCHES
                       TABLE 236 LACTIC ACID MARKET: PRODUCT LAUNCHES, 2019–2022
                       TABLE 237 LACTIC ACID MARKET: DEALS, 2019–2022
                       TABLE 238 LACTIC ACID MARKET: OTHERS, 2019–2022
 
14 COMPANY PROFILES (Page No. - 232)
(Business Overview, Products/Solutions/Services Offered, Recent Developments, MnM view (Key strengths/Right to win, Strategic choices made, Weakness/competitive threats)*
     14.1 KEY PLAYERS 
             14.1.1 CORBION
                       TABLE 239 CORBION: BUSINESS OVERVIEW
                       FIGURE 58 CORBION: COMPANY SNAPSHOT
                       TABLE 240 CORBION: PRODUCTS OFFERED
                       TABLE 241 CORBION: OTHERS
             14.1.2 CARGILL, INCORPORATED
                       TABLE 242 CARGILL, INCORPORATED: BUSINESS OVERVIEW
                       FIGURE 59 CARGILL, INCORPORATED: COMPANY SNAPSHOT
                       TABLE 243 CARGILL, INCORPORATED: PRODUCTS OFFERED
                       TABLE 244 CARGILL, INCORPORATED: PRODUCT LAUNCHES
                       TABLE 245 CARGILL, INCORPORATED: DEALS
                       TABLE 246 CARGILL, INCORPORATED: OTHERS
             14.1.3 GALACTIC
                       TABLE 247 GALACTIC: BUSINESS OVERVIEW
                       TABLE 248 GALACTIC: PRODUCTS OFFERED
                       TABLE 249 GALACTIC: OTHERS
             14.1.4 UNITIKA LTD
                       TABLE 250 UNITIKA LTD: BUSINESS OVERVIEW
                       FIGURE 60 UNITIKA LTD: COMPANY SNAPSHOT
                       TABLE 251 UNITIKA LTD: PRODUCTS OFFERED
             14.1.5 SULZER LTD
                       TABLE 252 SULZER LTD: COMPANY OVERVIEW
                       FIGURE 61 SULZER LTD: COMPANY SNAPSHOT
                       TABLE 253 SULZER LTD: PRODUCT OFFERINGS
                       TABLE 254 SULZER LTD: OTHERS
             14.1.6 TORAY INDUSTRIES
                       TABLE 255 TORAY INDUSTRIES: COMPANY OVERVIEW
                       FIGURE 62 TORAY INDUSTRIES: COMPANY SNAPSHOT
                       TABLE 256 TORAY INDUSTRIES: PRODUCT OFFERINGS
                       TABLE 257 TORAY INDUSTRIES: PRODUCT LAUNCHES
             14.1.7 HENAN JINDAN LACTIC ACID TECHNOLOGY CO., LTD.
                       TABLE 258 HENAN JINDAN LACTIC ACID TECHNOLOGY CO., LTD.: BUSINESS OVERVIEW
                       FIGURE 63 HENAN JINDAN LACTIC ACID TECHNOLOGY CO., LTD: COMPANY SNAPSHOT
                       TABLE 259 HENAN JINDAN LACTIC ACID TECHNOLOGY CO., LTD: OTHERS
             14.1.8 MUSASHINO CHEMICAL LABORATORY, LTD
                       TABLE 260 MUSASHINO CHEMICAL LABORATORY, LTD: BUSINESS OVERVIEW
             14.1.9 VIGON INTERNATIONAL, LLC
                       TABLE 261 VIGON INTERNATIONAL, LLC: BUSINESS OVERVIEW
             14.1.10 HENAN XINGHAN BIOTECHNOLOGY CO. LTD
                       TABLE 262 HENAN XINGHAN BIOTECHNOLOGY CO. LTD: BUSINESS OVERVIEW
             14.1.11 DANIMER SCIENTIFIC
                       TABLE 263 DANIMER SCIENTIFIC: BUSINESS OVERVIEW
             14.1.12 JUNGBUNZLAUER SUISSE AG
                       TABLE 264 JUNGBUNZLAUER SUISSE AG: BUSINESS OVERVIEW
             14.1.13 FOODCHEM INTERNATIONAL CORPORATION
                       TABLE 265 FOODCHEM INTERNATIONAL CORPORATION: BUSINESS OVERVIEW
             14.1.14 VAISHNAVI BIO TECH INTERNATIONAL LIMITED
                       TABLE 266 VAISHNAVI BIO-TECH INTERNATIONAL LIMITED: BUSINESS OVERVIEW
             14.1.15 SPECTRUM CHEMICAL
                       TABLE 267 SPECTRUM CHEMICAL: BUSINESS OVERVIEW
             14.1.16 GODAVARI BIOREFINERIES LTD
                       TABLE 268 GODAVARI BIO-REFINERIES LTD: BUSINESS OVERVIEW
             14.1.17 PROAGRO GMBH
                       TABLE 269 PROAGRO GMBH: BUSINESS OVERVIEW
             14.1.18 QINGDAO ABEL TECHNOLOGY CO. LTD
             14.1.19 ABMCOMPOSITE
             14.1.20 JIAAN BIOTECH
*Details on Business Overview, Products/Solutions/Services Offered, Recent Developments, MnM view (Key strengths/Right to win, Strategic choices made, Weakness/competitive threats)* might not be captured in case of unlisted companies.
 
15 ADJACENT & RELATED MARKETS (Page No. - 272)
     15.1 INTRODUCTION 
     15.2 LIMITATIONS 
     15.3 BIOPLASTICS & BIOPOLYMERS MARKET 
             15.3.1 MARKET DEFINITION
                       TABLE 270 BIOPLASTICS & BIOPOLYMERS: DEFINITION
             15.3.2 MARKET OVERVIEW
             15.3.3 BIOPLASTICS & BIOPOLYMERS MARKET, BY PRODUCT TYPE
                       TABLE 271 BIOPLASTICS & BIOPOLYMERS MARKET, BY PRODUCT TYPE, 2018–2021 (KT)
                       TABLE 272 BIOPLASTICS & BIOPOLYMERS MARKET, BY PRODUCT TYPE, 2022–2027 (KT)
                       TABLE 273 BIOPLASTICS & BIOPOLYMERS MARKET, BY PRODUCT TYPE, 2018–2021 (USD MILLION)
                       TABLE 274 BIOPLASTICS & BIOPOLYMERS MARKET, BY PRODUCT TYPE, 2022–2027 (USD MILLION)
             15.3.4 BIOPLASTICS & BIOPOLYMERS MARKET, BY REGION
                       TABLE 275 BIOPLASTICS & BIOPOLYMERS MARKET, BY REGION, 2018–2021 (KILOTON)
                       TABLE 276 BIOPLASTICS & BIOPOLYMERS MARKET, BY REGION, 2022–2027 (KILOTON)
                       TABLE 277 BIOPLASTICS & BIOPOLYMERS MARKET, BY REGION, 2018–2021 (USD MILLION)
                       TABLE 278 BIOPLASTICS & BIOPOLYMERS MARKET, BY REGION, 2022–2027 (USD MILLION)
     15.4 ORGANIC ACID MARKET 
             15.4.1 MARKET DEFINITION
             15.4.2 MARKET OVERVIEW
             15.4.3 ORGANIC ACID MARKET, BY APPLICATION
                       TABLE 279 ORGANIC ACID MARKET, BY APPLICATION, 2015–2022 (USD MILLION)
                       TABLE 280 ORGANIC ACID MARKET, BY APPLICATION, 2015–2022 (KT)
             15.4.4 ORGANIC ACID MARKET, BY REGION
                       TABLE 281 ORGANIC ACID MARKET, BY REGION, 2015–2022 (USD MILLION)
                       TABLE 282 ORGANIC ACID MARKET, BY REGION, 2015–2022 (KT)
 
16 APPENDIX (Page No. - 283)
     16.1 DISCUSSION GUIDE 
     16.2 KNOWLEDGESTORE: MARKETSANDMARKETS’ SUBSCRIPTION PORTAL 
     16.3 CUSTOMIZATION OPTIONS 
     16.4 RELATED REPORTS 
     16.5 AUTHOR DETAILS 

This research study involved the extensive use of secondary sources—directories and databases such as Bloomberg Businessweek and Factiva—to identify and collect information useful for a technical, market-oriented, and commercial study of the lactic acid and polylactic acid market. In-depth interviews were conducted with various primary respondents—such as key industry participants, subject matter experts (SMEs), C-level executives of key market players, and industry consultants—to obtain and verify critical qualitative and quantitative information as well as to assess prospects.

Secondary Research

The secondary sources referred for this research study include government sources, EU Commission, The Food and Agriculture Organization (FAO), Food and Drug Administration (FDA), US Department of Agriculture (USDA), European Food Safety Agency (EFSA), Agriculture and Agri-Food Canada, European bioplastics, BBIA – Bio-Based and Biodegradable Industries Associations, Australian Bioplastics Association (ABA), and Plastics Industry Association have been referred to, to identify and collect information for this study. The secondary sources also included lactic acid and polylactic acid  annual reports, press releases & investor presentations of companies, white papers, food journals, certified publications, articles from recognized authors, gold & silver standard websites, regulatory bodies, trade directories, and paid databases

Secondary research was used to obtain key information about the industry’s supply chain, the total pool of key players, and market classification and segmentation according to industry trends to the bottom-most level, regional markets, and key developments from both market and technology-oriented perspectives. The secondary data was collected and analyzed to arrive at the overall market size, which was further validated by primary research. It was also used to obtain information on the key developments from a market-oriented perspective.

Primary Research

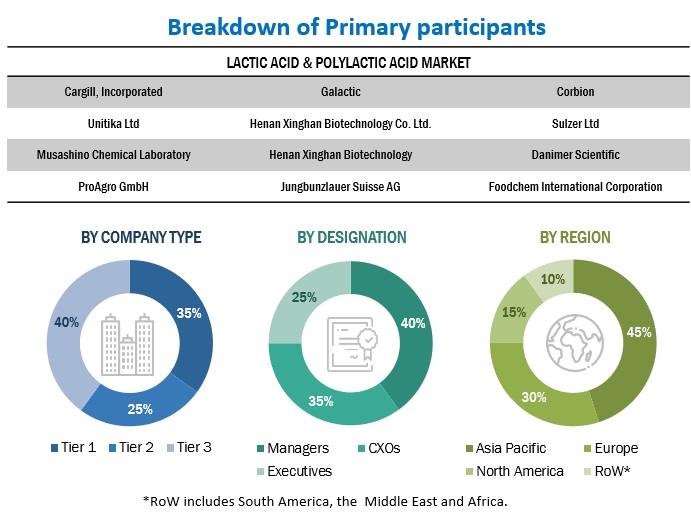
The lactic acid and polylactic acid market comprises of multiple stakeholders, including raw material suppliers, processed food suppliers, and regulatory organizations in the supply chain. Various primary sources from the supply and demand sides of the market were interviewed to obtain qualitative and quantitative information. Primary interviewees from the supply side include research institutions involved in R&D to introduce to the manufacturers, and importers & exporters of lactic acid and polylactic acid from the demand side include distributors, wholesalers, and key opinion leaders through questionnaires, emails, and telephonic interviews.
Lactic Acid and Polylactic Acid Market  Size, and Share

To know about the assumptions considered for the study, download the pdf brochure

Market Size Estimation

The following approaches represent the overall market size estimation process employed for the purpose of this study.

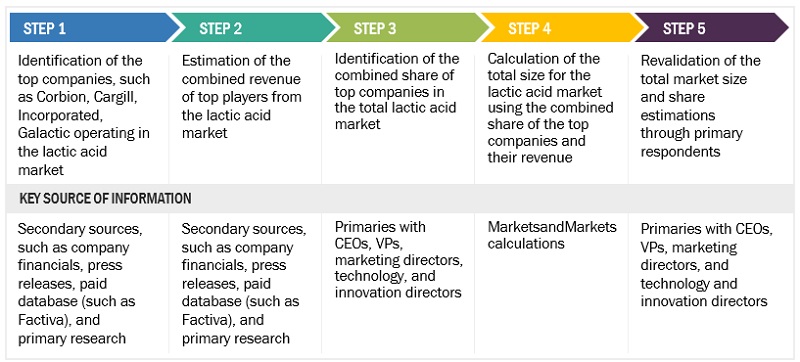
Both top-down and bottom-up approaches were used to estimate and validate the total size of the market. These approaches were also used extensively to estimate the size of various dependent submarkets. The research methodology used to estimate the market size includes the following:

Top-down approach:

  • The key players in the industry and the market were identified through extensive secondary research.
  • The revenues of major lactic acid and polylactic acid manufacturers were determined through primary and secondary research, such as paid databases, which were used as the basis for market estimation.
  • Based on the market share analysis of key industry players from all regions, the final market size of the lactic acid and polylactic acid market has been arrived at.

Bottom-up approach:

  • Based on the share of lactic acid and polylactic acid for each application at regional and country levels, the market sizes were analyzed. Thus, with a bottom-up approach to the application at the country level, the global market for lactic acid and polylactic acid were estimated.
  • Based on the demand for applications, offerings of key players, and the region-wise market share of major players, the global market for applications was estimated.
  • Other factors considered include the penetration rate of lactic acid and polylactic acid, are the demand for biopolymers, environmental concerns, consumer awareness, functional trends, the adoption rate, patents registered, and organic & inorganic growth attempts.
  • From this, market sizes for each region were derived.
  • All percentage shares, splits, and breakdowns were determined using secondary sources and verified through primary sources.
  • All macroeconomic and microeconomic factors affecting the growth of the lactic acid and polylactic acid market were considered while estimating the market size.
  • All parameters that affect the market covered in this research study were accounted for, viewed in extensive detail, verified through primary research, and analyzed to obtain final quantitative and qualitative data.

The following sections (bottom-up & top-down) (supply-demand) depict the overall market size estimation process employed for this study.
Lactic Acid and Polylactic Acid Market  Size, and Share

To know about the assumptions considered for the study, Request for Free Sample Report

Data Triangulation

After arriving at the global market size from the estimation process explained above, the total market was split into various segments and subsegments. The data triangulation and market breakdown procedures were employed, wherever applicable, to estimate the lactic acid and polylactic acid market and arrive at the exact statistics for all segments and subsegments. The data was triangulated by studying a range of factors and trends from the demand and supply sides. Additionally, the market size was validated using both the top-down and bottom-up approaches.

Market Definition

According to the US FDA, “Lactic acid is a chemical 2-hydroxypropanoic acid, which occurs naturally in several foods. It is produced commercially either by fermentation of carbohydrates, such as glucose, sucrose, or lactose or by a procedure involving the formation of lactonitrile from acetaldehyde and hydrogen cyanide and subsequent hydrolysis to lactic acid.

Lactic acid is one of the bio-based chemicals that finds applications in the food & beverages, polymer, cosmetics & personal care, and pharmaceutical industry. Lactic acid is used in the production of polylactic acid (PLA) plastics that are mainly used in packaging products that comply with the environmental norms.

Polylactic acid is a thermoplastic aliphatic polyester that is derived by the polymerization of lactic acid. It is a versatile polymer that has many potential applications in packaging, textile, and medical. It is similar to traditional plastic in terms of physical and mechanical properties, allowing the user to handle the polymer in the way plastics are handled.

Stakeholders

  • Intermediate suppliers such as traders and distributors of lactic acid and polylactic acid
  • Manufacturers of food & beverage ingredients and processed food products
  • Other manufacturing industries such as personal care, pharmaceutical, automobiles, fiber & fabrics, electronics & agriculture
  • Renewable chemical suppliers
  • Packaging services providers
  • Packaging film producers
  • Biodegradable plastics manufacturers
  • Polymer manufacturers
  • Government and research organizations
  • Associations, regulatory bodies, and other industry-related bodies:
    • The Food and Agriculture Organization (FAO)
    • Food and Drug Administration (FDA)
    • US Department of Agriculture (USDA)
    • European Food Safety Agency (EFSA)
    • Agriculture and Agri-Food Canada
    • European bioplastics
    • BBIA – Bio-Based and Biodegradable Industries Associations
    • Australian Bioplastics Association (ABA)
  • Plastics Industry Association

Report Objectives

Market Intelligence

  • Determining and projecting the size of the lactic acid market, with respect to raw material, application, form, and regions over a five-year period, ranging from 2023 to 2028.
  • Determining and projecting the size of the polylactic acid market, with respect to application and regions over a five-year period, ranging from 2023 to 2028.
  • Identifying the attractive opportunities in the market by determining the largest and fastest-growing segments across regions
  • Providing detailed information about the key factors influencing the growth of the market (drivers, restraints, opportunities, and industry-specific challenges)
  • Providing the regulatory framework for significant countries related to the lactic acid and polylactic acid market
  • Analyzing the micro markets, with respect to individual growth trends, prospects, and their contribution to the total market
  • Impact of macro- and micro-economic factors on the market
  • Shift in demand patterns across different subsegments and regions

Competitive Intelligence

  • Identifying and profiling the key players in the global lactic acid and polylactic acid market
  • Providing a comparative analysis of market leaders on the basis of the following:
    • Product offerings
    • Business strategies
    • Strengths and weaknesses
    • Key financials
  • Understanding the competitive landscape and identifying the major growth strategies adopted by players across the key regions
  • Analyzing the value chain and products across the key regions and their impact on the prominent market players
  • Providing insights on key product innovations and investments in the global lactic acid and polylactic acid market.

Available Customizations

With the given market data, MarketsandMarkets offers customizations according to company-specific scientific needs.

The following customization options are available for the report:

Product Analysis

  • Product Matrix, which gives a detailed comparison of the product portfolio of each company

Geographic Analysis

With the given market data, MarketsandMarkets offers customizations according to the company-specific scientific needs.

  • Further breakdown of the Rest of Europe market for Lactic acid and polylactic acid into the Poland, Netherlands, Denmark, Belgium, Switzerland, Sweden, Greece, and other EU and non-EU countries.
  • Further breakdown of the Rest of South America market for Lactic acid and polylactic acid into Colombia, Peru, Paraguay, Chile, and Venezuela
  • Further breakdown of the Rest of Asia Pacific for Lactic acid and polylactic acid into the Malaysia, Singapore, Philippines, Vietnam, South Korea, and other Asian  countries.

Company Information

  • Detailed analyses and profiling of additional market players (up to five)
Custom Market Research Services

We will customize the research for you, in case the report listed above does not meet with your exact requirements. Our custom research will comprehensively cover the business information you require to help you arrive at strategic and profitable business decisions.

Request Customization
Report Code
FB 2647
Published ON
Jun, 2023
Choose License Type
BUY NOW
  • SHARE
X
Request Customization
Speak to Analyst
Speak to Analyst
OR FACE-TO-FACE MEETING
PERSONALIZE THIS RESEARCH
  • Triangulate with your Own Data
  • Get Data as per your Format and Definition
  • Gain a Deeper Dive on a Specific Application, Geography, Customer or Competitor
  • Any level of Personalization
REQUEST A FREE CUSTOMIZATION
LET US HELP YOU!
  • What are the Known and Unknown Adjacencies Impacting the Lactic Acid and Polylactic Acid Market
  • What will your New Revenue Sources be?
  • Who will be your Top Customer; what will make them switch?
  • Defend your Market Share or Win Competitors
  • Get a Scorecard for Target Partners
CUSTOMIZED WORKSHOP REQUEST
+1-888-600-6441
  • Call Us
  • +1-888-600-6441 (Corporate office hours)
  • +1-888-600-6441 (US/Can toll free)
  • +44-800-368-9399 (UK office hours)
CONNECT WITH US
ABOUT TRUST ONLINE
©2024 MarketsandMarkets Research Private Ltd. All rights reserved
DMCA.com Protection Status Website Feedback