Polyalkylene Glycols Market by Type (Polyethylene Glycol, Polypropylene Glycol, and Others), and by Application (Lubricants, Surface Active Agents, Pharmaceutical, Personal Care, and Others) - Global Trends & Forecasts to 2020


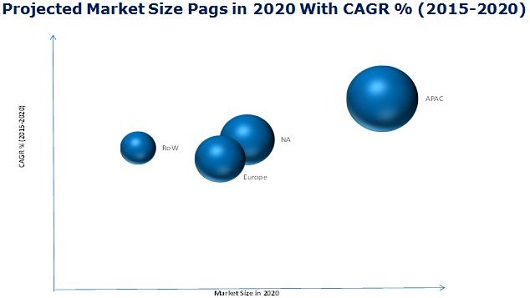
The global Polyalkylene glycol market has been segmented on the basis of type, application, and geography. The application segment is sub-divided into lubricants, surface active agents, pharmaceutical, personal care, and others. Lubricants application is the leading segment, capturing the maximum share of the overall PAGs market in 2014. The automotive industry is the largest consumer of PAGs for lubricant application and the rapid growth of the industry is expected to drive the demand for polyalkylene glycols. The PAGs market size is estimated at USD 1.33 Billion in 2014 and is projected to reach USD 2.62 Billion by 2020, at a CAGR of 11.7% between 2015 and 2020. In this report, 2014 is considered as the base year and the forecast period is between 2015 and 2020.
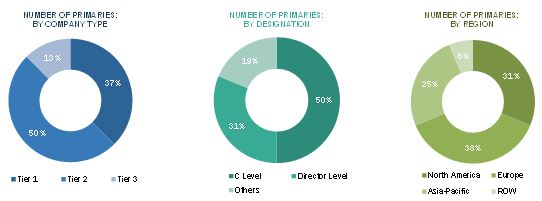
This research study used extensive secondary sources, directories, and databases such as Hoovers, Bloomberg BusinessWeek, and Factiva to identify and collect information useful for this technical, market-oriented, and commercial study of the polyalkylene glycol market. The primary sources are mainly several industry experts from core and related industries and preferred suppliers, manufacturers, distributors, service providers, and organizations related to all segments of the industry’s supply chain.
The raw material suppliers for PAGs identified in the study are ethane, propane petroleum, and catalyst suppliers. The major PAGs manufacturers are profiled in the report. The polyalkylene glycol value chain starts with the procurement of raw materials required for the manufacturing of raw materials. The main raw materials for the production of PAGs are derived from petrochemical feedstocks and are known as olefins. Once these raw materials reach the polyalkylene glycol manufacturers, they are processed to make a final product and are delivered to OEM manufacturers or other end-use industries. The end user for PAGs are automobile manufacturers, oil & natural gas producing companies, textile producers, food processing companies, healthcare industry, and so on.
The target audience for the Polyalkylene glycol market report would be PAGs manufacturers, dealers, suppliers, end-use companies, raw material suppliers, and others. The major players operational in the global PAGs market are the Dow Chemical Company (U.S.), BASF SE (Germany), Ineos Group (Japan), Clariant AG (U.S.), Huntsman Corporation (Japan), Idemitsu Kosan Co. (U.S.), Ashland Inc. (U.S.), Exxon Mobil (U.S.), AkzoNobel N.V. (Netherlands), Stepan Company (U.S.), and others. These companies have adopted various strategies such as new product launch, expansion, and R&D, among others to achieve growth in the global PAGs market.
Scope of the Report:
This report categorizes the global market for PAGs on the basis of type, application, and geography.
Market Segmentation, by Type:
The PAGs market has been segmented on the basis of type into polyethylene glycol polypropylene glycol, and others.
Market Segmentation, by Application:
The Polyalkylene glycol market has been segmented on the basis of application into lubricants, surface active agents, pharmaceutical, personal care, and others.
Market Segmentation, by Geography:
The geographic analysis covers North America, Europe, Asia-Pacific, and Rest of the World.
Available Customizations
With the given market data, MarketsandMarkets offers customizations according to the company’s specific needs. The following customization options are available for the report:
Product Analysis
- Product Matrix that gives a detailed comparison of product portfolio of each company
Regional Analysis
- Further breakdown of a region with respect to a particular country
Company Information
- Detailed analysis and profiling of additional market players (Up to 5)
The global Polyalkylene glycol market was estimated to be worth USD 1.33 Billion in 2014 and is projected to reach USD 2.62 Billion by 2020, at a CAGR of 11.7% between 2015 and 2020. This high growth of the market is owed to the increasing demand from end-use industries in the U.S., Germany, France, China, India, and Japan. The increased usage of PAGs in a variety of applications is also one of the key factor driving the PAGs market. The growing demand for processed food, metal working fluids, surfactants, compressor lubricants, and increased vehicle production is supporting the growth of the global PAGs market. The major restraints of the PAGs market are fluctuating crude oil price. The price of PAGs are quite expensive compared to other conventional oils.
The lubricants application segment dominated the Polyalkylene glycol market and is also expected to witness the highest CAGR during the forecast period. Surface active agents is the second-largest application of PAGs and is also expected to witness a significant growth rate. The growing automotive industry, improved standard of living, and shifting customer preference towards processed food in emerging economies are the main factors driving the growth of this market.
The PAGs market is classified on the basis of type: polyethylene glycol (PEG) and polypropylene glycol (PPG). The PAGs market is dominated by polyethylene glycol because of its high performance and environment friendly properties. PEG is also the fastest-growing application during the forecast period. It is most commonly used in the lubricants application.
Currently, Asia-Pacific is the largest market for PAGs, closely followed by North America. It is also the fastest-growing market for PAGs due to high demand from China, India, and Japan, which are the major market for PAGs. The growing automotive industry and the emerging industrial sector in this region is expected to drive the growth of the polyalkylene glycol market.
Asia-Pacific and North America are the most active markets in terms of strategic initiatives undertaken. Some of the factors driving the growth of the polyalkylene glycols market are high end-use industry growth, amplified local manufacturing, and increased number of domestic players in various vertical market segments. Expansion is the most preferred strategy adopted by the key market players to sustain in this highly competitive market.
Some of the important polyalkylene glycols companies are the Dow Chemical Company (U.S.), BASF SE (Germany), Ineos Group (Japan), Clariant AG (U.S.), Huntsman Corporation (Japan), Idemitsu Kosan Co. (U.S.), Ashland Inc. (U.S.), Exxon Mobil (U.S.), AkzoNobel N.V. (Netherlands), and Stepan Company (U.S.). The companies in this market need to compete with each other with respect to prices and product offering to meet the market requirements.
 Exclusive indicates content/data unique to MarketsandMarkets and not available with any competitors.
Table of Contents
1 Introduction (Page No. - 16)
1.1 Objectives of the Study
1.2 Market Definition
1.3 Markets Scope
1.3.1 Markets Covered
1.3.1.1 Scope of the Report, By Region
1.3.2 Years Considered
1.3.3 Currency
1.3.4 Limitations
1.4 Stakeholders
2 Research Methodology (Page No. - 20)
2.1 Research Data
2.1.1 Secondary Data
2.1.1.1 Key Data From Secondary Sources
2.1.2 Primary Data
2.1.2.1 Key Data From Primary Sources
2.1.2.2 Key Industry Insights
2.1.2.3 Breakdown of Primaries
2.2 Market Size Estimation
2.2.1 Bottom-Up Approach
2.2.2 Top Down
2.3 Market Breakdown and Data Triangulation
2.4 Assumptions
3 Executive Summary (Page No. - 28)
4 Premium Insights (Page No. - 32)
4.1 Attractive Market Opportunities for PAGs Manufacturers
4.2 Polyalkylene Glycol Market Growing at A Fast Pace
4.3 Polyalkylene Glycol Market Attractiveness
4.4 Market Attractiveness, By Application
4.5 Life Cycle Analysis
5 Market Overview (Page No. - 36)
5.1 Introduction
5.2 Market Segmentation
5.2.1 Polyalkylene Glycol Market Segmentation, By Type
5.2.2 Polyalkylene Glycols Market Segmentation, By Application
5.3 Market Dynamics
5.3.1 Drivers
5.3.1.1 Properties of PAGs Such as Water Solubility, High Viscosity Indexes, and Bio-Degradability
5.3.1.2 Growing Automotive Industry in Asia-Pacific
5.3.2 Restraints
5.3.2.1 Fluctuating Crude Oil Prices
5.3.2.2 PAGs are Expensive Compared to Conventional Mineral Oils
5.3.3 Opportunities
5.3.3.1 Emerging Application of PAGs
5.4 Value Chain Analysis
5.4.1 Raw Material
5.4.1.1 Ethane
5.4.1.2 Propane
5.4.1.3 Butane
5.5 Porter’s Five Forces Analysis
5.5.1 Threat From New Entrants
5.5.2 Bargaining Power of Suppliers
5.5.3 Threat of Substitutes
5.5.4 Bargaining Power of Buyers
5.5.5 Intensity of Competitive Rivalry
5.6 Market Share Analysis
5.7 Regulatory Framework
6 Polyalkylene Glycol Market, By Type (Page No. - 50)
6.1 Introduction
6.2 Polyethylene Glycol (PEG)
6.3 Polypropylene Glycol (PPG)
6.4 Others
7 Polyalkylene Glycol Market, By Application (Page No. - 55)
7.1 Introduction
7.2 Lubricants
7.2.1 Refrigeration Oil
7.2.2 Fire Resistant Hydraulic Fluids
7.2.3 Compressor Lubricants
7.2.4 Gear Lubricants
7.2.5 Automotive Applications
7.2.6 Textile Lubricants
7.2.7 Metal Working Fluids
7.2.8 Food Grade Lubricants
7.3 Surface Active Agents
7.4 Pharmaceutcal
7.5 Personal Care
7.6 Others
8 Regional Analysis (Page No. - 65)
8.1 Introduction
8.2 North America
8.2.1 U.S.
8.2.2 Canada
8.2.3 Mexico
8.3 Asia-Pacific
8.3.1 China
8.3.2 India
8.3.3 Japan
8.3.4 Others
8.4 Europe
8.4.1 Russia
8.4.2 Germany
8.4.3 France
8.4.4 U.K.
8.4.5 Turkey
8.4.6 Italy
8.4.7 Others
8.5 RoW
8.5.1 South America
8.5.2 Africa
8.5.3 The Middle East
9 Competitive Landscape (Page No. - 111)
9.1 Overview
9.2 Expansion: the Most Popular Growth Strategy
9.3 Maximum Developments in North America
9.4 Competitive Situation and Trends
9.4.1 Expansions
9.4.2 Research & Development
9.4.3 New Product Launches
9.4.4 Others
10 Company Profiles (Page No. - 116)
10.1 Introduction
10.2 The DOW Chemical Company
10.2.1 Business Overview
10.2.1 Products Offered
10.2.2 Recent Developments
10.2.3 SWOT Analysis
10.2.4 MnM View
10.3 BASF SE
10.3.1 Business Overview
10.3.2 Products Offered
10.3.3 Recent Developments
10.3.4 SWOT Analysis
10.3.5 MnM View
10.4 Ineos Group
10.4.1 Business Overview
10.4.2 Products Offered
10.4.3 Recent Developments
10.4.4 SWOT Analysis
10.4.5 MnM View
10.5 Clariant AG
10.5.1 Business Overview
10.5.2 Products Offered
10.5.3 Recent Developments
10.5.4 SWOT Analysis
10.5.5 MnM View
10.6 Huntsman International Llc
10.6.1 Business Overview
10.6.2 Products Offered
10.6.3 MnM View
10.7 Idemitsu Kosan Co.
10.7.1 Business Overview
10.7.2 Products Offered
10.7.3 SWOT Analysis
10.7.4 MnM View
10.8 Akzonobel N.V.
10.8.1 Business Overview
10.8.2 Products Offered
10.8.3 Recent Developments
10.8.4 MnM View
10.9 Exxon Mobil
10.9.1 Business Overview
10.9.2 Products Offered
10.9.3 Recent Developments
10.9.4 MnM View
10.10 Croda International PLC.
10.10.1 Business Overview
10.10.2 Products Offered
10.10.3 MnM View
10.11 PAN Asia Chemical Corporation
10.11.1 Business Overview
10.11.2 Products Offered
10.11.3 MnM View
11 Appendix (Page No. - 138)
11.1 Discussion Guide
11.2 Introducing RT: Real Time Market Intelligence
11.3 Available Customizations
11.4 Related Reports
List of Tables (72 Tables)
Table 1 Polyalkylene Glycol Market Segmentation, By Type
Table 2 Polyalkylene Glycol Market, By Application
Table 3 Key Features of PAGs
Table 4 Mineral Oil vs Pag
Table 5 Cost Comparision: Mineral Oil vs Eals
Table 6 Global Ethane Prices, 2013–2020 (USD/Barrel)
Table 7 Global Propane Prices, 2013–2020 (USD/Barrel)
Table 8 Global Butane Prices, 2013–2020 (USD/Barrel)
Table 9 Polyalkylene Glycol Market Size, By Type, 2015–2020 (Kiloton)
Table 10 Polyethylene Glycol Market Size, By Region, 2015–2020 (Kiloton)
Table 11 Polypropylene Glycol Market Size, By Region, 2013–2020 (Kiloton)
Table 12 Others Polyalkylene Glycol Market Size, By Region, 2013–2020 (Kiloton)
Table 13 Polyalkylene Glycols Market Size, By Application, 2013-2020 (Kiloton)
Table 14 Lubricants Polyalkylene Glycol Market Size, By Region, 2013–2020 (Kiloton)
Table 15 Surfactants Polyalkylene Glycols Market Size, By Region, 2013–2020 (Kiloton)
Table 16 Pharmaceutical Polyalkylene Glycol Market Size, By Region, 2013–2020 (Kiloton)
Table 17 Personal Care Polyalkylene Glycols Market Size, By Region, 2013–2020 (Kiloton)
Table 18 Others Polyalkylene Glycol Market Size, By Region, 2013–2020 (Kiloton)
Table 19 Market Size, By Region , 2013–2020 (Kiloton)
Table 20 Market Size, By Region, 2013–2020 (USD Million)
Table 21 North America: Polyalkylene Glycol Market Size, By Application, 2013–2020 (Kiloton)
Table 22 North America: Market Size, By Type, 2013–2020 (Kiloton)
Table 23 North America: Market Size, By Country, 2013–2020 (Kiloton)
Table 24 North America: Market Size, By Country 2013–2020 (USD Million)
Table 25 U.S.: Polyalkylene Glycol Market Size, By Application, 2015–2020 (Kiloton)
Table 26 U.S.: Market Size, By Type 2015–2020 (Kiloton)
Table 27 Canada: Polyalkylene Glycol Market Size, By Application, 2013–2020 (Kiloton)
Table 28 Canada: Market Size, By Type, 2013–2020 (Kiloton)
Table 29 Mexico: Market Size, By Application, 2013–2020 (Kiloton)
Table 30 Mexico: Market Size, By Type, 2013–2020 (Kiloton)
Table 31 Asia-Pacific: Polyalkylene Glycol Market Size, By Application, 2013–2020 (Kiloton)
Table 32 Asia-Pacific: Market Size, By Type, 2013–2020 (Kiloton)
Table 33 Asia-Pacific: Market Size, By Country, 2013–2020 (Kiloton)
Table 34 Asia-Pacific: Market Size, By Country, 2013–2020 (USD Million)
Table 35 China: Market Size, By Application, 2013–2020 (Kiloton)
Table 36 China: Market Size, By Type, 2013–2020 (Kiloton)
Table 37 India: Market Size, By Application, 2013–2020 (Kiloton)
Table 38 India: Market Size, By Type, 2013–2020 (Kiloton)
Table 39 Japan: Market Size, By Application, 2013–2020 (Kiloton)
Table 40 Japan: Market Size, By Type, 2013–2020 (Kiloton)
Table 41 Others: Polyalkylene Glycol Market Size, By Application, 2013–2020 (Kiloton)
Table 42 Others: Polyalkylene Glycol Market Size, By Type, 2013–2020 (Kiloton)
Table 43 Europe: Market Size, By Application, 2013–2020 (Kiloton)
Table 44 Europe: Polyalkylene Glycol Market Size, By Type, 2013–2020 (Kiloton)
Table 45 Europe: Market Size, By Country, 2013–2020 (Kiloton)
Table 46 Europe: Market Size, By Country, 2013–2020 (USD Million)
Table 47 Russia: Polyalkylene Glycol Market Size, By Application, 2013–2020 (Kiloton)
Table 48 Russia: Market Size, By Type, 2013–2020 (Kiloton)
Table 49 Germany: Market Size, By Application, 2013–2020 (Kiloton)
Table 50 Germany: Market Size, By Type, 2013–2020 (Kiloton)
Table 51 France: Polyalkylene Glycol Market Size, By Application, 2013–2020 (Kiloton)
Table 52 France: Market Size, By Type, 2013–2020 (Kiloton)
Table 53 U.K.: Market Size, By Application, 2013–2020 (Kiloton)
Table 54 U.K.: Market Size, By Type, 2013–2020 (Kiloton)
Table 55 Turkey: Market Size, By Application, 2013–2020 (Kiloton)
Table 56 Italy: Market Size, By Application, 2013–2020 (Kiloton)
Table 57 Spain: Polyalkylene Glycol Market Size, By Application, 2013–2020 (Kiloton)
Table 58 Others: Market Size, By Application, 2013–2020 (Kiloton)
Table 59 RoW: Market Size, By Application, 2013–2020 (Kiloton)
Table 60 RoW: Market Size, By Type, 2013–2020 (Kiloton)
Table 61 RoW: Market Size, By Country, 2013–2020 (Kiloton)
Table 62 RoW: Polyalkylene Glycol Market Size, By Country, 2013–2020 (USD Million)
Table 63 South America: Market Size, By Application, 2013–2020 (Kiloton)
Table 64 South America: Market Size, By Type, 2013–2020 (Kiloton)
Table 65 Africa: Polyalkylene Glycol Market Size, By Application, 2013–2020 (Kiloton)
Table 66 Africa: Market Size, By Type, 2013–2020 (Kiloton)
Table 67 The Middle East: Market Size, By Application, 2013–2020 (Kiloton)
Table 68 The Middle East: Polyalkylene Glycol Market Size, By Type, 2013–2020 (Kiloton)
Table 69 Expansions, 2012–2015
Table 70 Research & Development, 2012–2015
Table 71 New Product Launches, 2012–2015
Table 72 Others, 2012–2015
List of Figures (78 Figures)
Figure 1 Polyalkylene Glycol Market: Research Design
Figure 2 Key Data From Secondary Sources
Figure 3 Key Data From Primary Sources
Figure 4 Breakdown of Primary Interviews
Figure 5 Market Size Estimation: Bottom-Up Approach
Figure 6 Market Size Estimation: Top-Down Approach
Figure 7 Market Breakdown and Data Triangulation
Figure 8 Polyethylene Glycol Dominates the PAGs Market
Figure 9 Lubricants to Be the Largest- and Fastest-Growing Application Segment
Figure 10 Asia-Pacific Estimated to Be the Largest Market, in Terms of Value, 2015–2020
Figure 11 Attractive Opportunities in the Polyalkylene Glycol Market
Figure 12 Rapid Growth Expected in Asia-Pacific Between 2015 and 2020
Figure 13 Asia-Pacific to Boost Demand for PAGs Between 2015 and 2020
Figure 14 Lubricants Driving the Growth of PAGs Market
Figure 15 China Captures the Largest Market Share in the Asia-Pacific Region
Figure 16 Asia-Pacific to Be the Fastest Growing Polyalkylene Glycol Market
Figure 17 Drivers, Restraints and Opportunities for the PAGs Market
Figure 18 Asia-Pacific: Vehicles in Use (2009–2013)
Figure 19 Average Crude Oil Prices, 2014–2015 (USD/Barrel)
Figure 20 Porter’s Five Forces Analysis
Figure 21 Polyethylene Glycol Dominates the Polyalkylene Glycol Market
Figure 22 Asia-Pacific is the Largest-Market for Polyethylene Glycol
Figure 23 Asia-Pacific is the Largest Market for Polyalkylene Glycols
Figure 24 Asia-Pacific is Projected to Experience Highest Growth for Others Polyalkylene Glycols Between 2015 and 2020
Figure 25 Lubricant is the Largest Application of Polyalkylene Glycols
Figure 26 Growing Automobile Industry Driving the PAG’s Market in Lubricants Application
Figure 27 Growing Pharmaceutical Industry in Asia-Pacific Driving the Surfactants Market
Figure 28 Asia-Pacific is the Largest Market for PAGs in Pharmaceutical Application
Figure 29 Growing Personal Care Industry in Asia-Pacific Driving the Polyalkylene Glycol Market
Figure 30 Asia-Pacific is the Largest Market for PAGs in Other Applications
Figure 31 Asia-Pacific Projected to Emerge as Fastest-Growing Polyalkylene Glycols Market Between 2015 and 2020
Figure 32 Asia-Pacific Dominated Polyalkylene Glycols Market in 2014
Figure 33 Regional Snapshot of Polyalkylene Glycol Market: India Driving the Growth of Market
Figure 34 North America: Polyalkylene Glycols Market Snapshot
Figure 35 Lubricants is the Largest Application of PAGs in North America
Figure 36 PEG Dominates the Polyalkylene Glycol Market in North America
Figure 37 The U.S. is the Largest Consumer of Polyalkylene Glycols in North America
Figure 38 Canada is the Fastest-Growing Market in North America
Figure 39 Lubricants Captures the Largest Share of the U.S. PAGs Market
Figure 40 Canada: Polyalkylene Glycol Market Size, By Type, 2013–2020 (Kiloton)
Figure 41 Lubricants is the Largest Application of PAGs in Mexico
Figure 42 Asia Pacific: Polyalkylene Glycol Market Snapshot
Figure 43 Lubricants is the Largest Application for PAGs in Asia-Pacific
Figure 44 Polyethylene Glycol Dominates the PAGs Market in Asia-Pacific
Figure 45 China Dominates the Polyalkylene Glycol Market in Asia-Pacific
Figure 46 China is Expected to Be the Largest Market During the Forecast Period
Figure 47 PAGs in Lubricants Application Witnessing Highest Growth in China
Figure 48 India: Polyalkylene Glycol Market Size, By Type, 2015–2020 (Kiloton)
Figure 49 Lubricants Application Dominates the PAGs Market in Japan
Figure 50 Lubricants Application Dominates the European Polyalkylene Glycol Market
Figure 51 PEG Dominates European PAGs Market
Figure 52 Russia Dominates the Polyalkylene Glycols Market in Europe
Figure 53 Turkey Projected to Witness Highest Growth Rate
Figure 54 Lubricants is the Largest Application of PAGs in Russia
Figure 55 Germany Polyalkylene Glycols Market Share, By Type, 2015–2020 (Kiloton)
Figure 56 France: Polyalkylene Glycol Market Size , By Type, 2015–2020 (Kiloton)
Figure 57 U.K.: Polyalkylene Glycols Marketsize, By Type, 2015–2020 (Kiloton)
Figure 58 Turkey: Polyalkylene Glycol Market Size, By Type, 2015–2020 (Kiloton)
Figure 59 Italy: Polyalkylene Glycols Market size, By Type, 2015–2020 (Kiloton)
Figure 60 Spain: Polyalkylene Glycol Market size, By Type, 2015–2020 (Kiloton)
Figure 61 RoW: Polyalkylene Glycols Market Size, By Application, 2015–2020 (Kiloton)
Figure 62 PEG Dominates RoW’s Polyalkylene Glycols Market
Figure 63 The Middle East Dominates the RoW Polyalkylene Glycol Market
Figure 64 The Middle East is the Fastest Growing Polyalkylene Glycol Market in the RoW
Figure 65 South America: Polyalkylene Glycol Market Size, By Application, 2015–2020 (Kiloton)
Figure 66 Africa: Polyalkylene Glycol Market Size, By Application, 2015–2020 (Kiloton)
Figure 67 The Middle East: Polyalkylene Glycols Market Size, By Application, 2015–2020 (Kiloton)
Figure 68 Companies Primarily Adopted Organic Growth Strategies to Retain Their Market Position
Figure 69 Expansions in North America Made It the Most Active Region During 2012–2015
Figure 70 Regional Revenue Mix of Top Three Market Players
Figure 71 The DOW Chemical Company: Company Snapshot
Figure 72 BASF SE: Company Snapshot
Figure 73 Clariant AG : Company Snapshot
Figure 74 Huntsman International Inc.: Company Snapshot
Figure 75 Idemitsu Kosan Co.: Company Snapshot
Figure 76 Akzonobel N.V.: Company Snapshot
Figure 77 Exxon Mobil: Company Snapshot
Figure 78 Croda International PLC: Company Snapshot


Growth opportunities and latent adjacency in Polyalkylene Glycols Market