PMI Foam Market and Other High Performance Foam Core Market by Type (PMI, PES), by Application (A&D, Wind, Sporting Goods, Transportation), by A&D Sub-Application (Interior, Exterior), & by Region - Global Forecast to 2021


[115 Pages Report] The PMI foam market was valued at USD 29.19 million in 2015 and is projected to reach USD 53.32 million by 2021, at a CAGR of 10.6% during the forecast period. In this study, 2015 has been considered as the base year, while the forecast period is from 2016 to 2021.
Market Dynamics
Drivers
- Growing use of composite in aerospace & defense application
- Exceptional properties offered by PMI foam
Opportunities
- Use of PMI foam in new application markets and increasing penetration in existing applications
Challenges
- To compete with nomex honeycomb and other core materials
- To produce low cost products
Growing use of composite in aerospace & defense application
The use of composite materials and related core materials including PMI foam in the aerospace & defense industry has gained momentum in the past few decades. The aerospace & defense application is estimated to witness high growth rates due to the increasing penetration of PMI foam into aircraft such as Airbus A340, Airbus A380, Gulfstream Aerospace G150, and Comac�s ARJ21 and C919. Moreover, the penetration of PMI foam is also increasing in the components of helicopter, missiles, and space vehicles. The primary benefits that PMI foam offers are reduced weight, emissions, and maintenance costs. High impact strength compared to honeycomb core product is also increasing the penetration of PMI foam in this application.
Objectives of the Study:
- To define, describe, and forecast the PMI foam market on the basis of aerospace & defense application, application, and region
- To provide detailed information about the key factors influencing the growth of the market (drivers, restraints, opportunities, and challenges)
- To strategically analyze micromarkets1 with respect to individual growth trends, future prospects, and contribution to the total market
- To analyze the opportunities in the market for stakeholders and provide a competitive landscape for market leaders
- To strategically profile key players and comprehensively analyze their market shares and core competencies2
Note1: Micromarkets are the subsegments of the PMI foam market included in the report
Note2: Core competencies of companies are determined in terms of their key developments, SWOT analysis, and key strategies adopted by them to sustain in the market
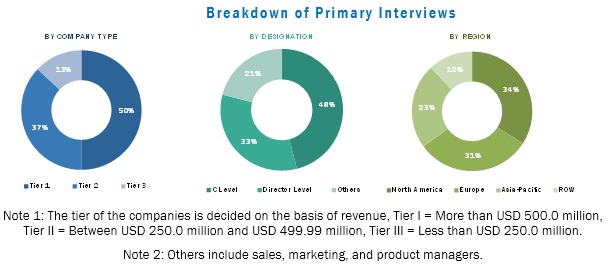
The research methodology used to estimate and forecast the PMI foam market begins with capturing data on key company revenues and raw material costs through secondary research. The product offerings are also taken into consideration to determine the market segmentation. The bottom-up procedure was employed to arrive at the overall market size of the global PMI foam from the revenue of the key players in the market. After arriving at the overall market size, the total market was split into several segments and sub-segments which are then verified through primary research by conducting extensive interviews with key people such as CEOs, VPs, Directors and executives. This data triangulation and market breakdown procedures were employed to complete the overall market engineering process and arrive at the exact statistics for all segments and sub-segments.
The figure below illustrates the breakdown of profiles of primary interview participants.
To know about the assumptions considered for the study, download the pdf brochure
The market for PMI foam has a diversified and established ecosystem of its upstream players such as raw material suppliers, and the downstream stakeholders such as component manufacturers, vendors, end users, and government organizations. The PMI foam market comprises manufacturers such as Evonik Industries AG (Germany), Jiaxing Sky Composites Co., Ltd. (China), Baoding Meiwo Engineering Materials Technology Co., Ltd. (China), and Cashem Advanced Materials Hi-tech Co., Ltd (China).
Major Market Developments
- In January 2016, Evonik Industries inaugurated a new PMI foam manufacturing facility in Shanghai, China. By opening this third manufacturing facility, the company targets to distribute its products to the local customers and create a steady and regular supply of products in Asia-Pacific.
- In September 2013, Evonik Industries and Secar Technologie GmbH (Austria) established a joint venture, LiteCon GmbH, for manufacturing advanced composite products that use PMI foam as a core material. LiteCon GmbH is established in Austria and Evonik owns 49% of the shares in this joint venture, which mainly focuses on the automotive and aviation industries.
Key Target Audience:
- PMI Foam Manufacturers
- PMI Foam Traders, Distributors, and Suppliers
- Raw Material Suppliers
- Governments and Research Organizations
- Associations and Industrial Bodies
- R&D Institutions
Scope Of The Report
The research report segments the PMI foam market to following submarkets:
By Application:
- Aerospace & Defense
- Wind Energy
- Sporting Goods
- Transportation
- Others
Aerospace & defense: Subsegment, by application:
- Exterior
- Interior
By Region
- North America
- Asia-Pacific
- Europe
- RoW
Each region has been further segmented into key countries in that region.
Critical questions which the report answers
- What are the upcoming trends for PMI foam in developing nations?
- Which are the key players in the market and how intense is the competition?
Available Customizations:
With the given market data, MarketsandMarkets offers customizations as per the company�s specific needs. The following customization options are available for the report:
Product Analysis
- Product matrix which gives a detailed comparison of product portfolio of each company
Geographic Analysis
- Further breakdown of the North America PMI foam market
- Further breakdown of the Europe PMI foam market
- Further breakdown of the Asia-Pacific PMI foam market
- Further breakdown of the RoW PMI foam market
Company Information
- Detailed analysis and profiling of additional market players
The global PMI foam market is estimated at USD 29.2 million in 2015 and is projected to reach USD 53.3 million by 2021, at a CAGR of 10.6% from 2016 to 2021. The global PMI foam market has witnessed a strong growth in the past few years owing to its high demand from the aerospace & defense application segment. PMI foam offers superior fire, smoke, and toxicity retardant properties and can be processed with all commonly used resin systems.
The major applications of PMI foam are in aerospace & defense, wind energy, sporting goods, transportation, and other sectors. The aerospace & defense application is estimated to be the fastest-growing application in the PMI foam market during the forecast period. The properties offered by PMI foam, such as high impact strength, creep resistance, and excellent mechanical strength, encourage its use in high performance applications. PMI foam core, is majorly used in exterior structures of aircraft, helicopters, and space vehicles.
High production and processing costs of PMI foam have been posing a serious threat to the growth of the market. PMI foam has a large number of applications; however, commercialization of these applications is yet to begin owing to their high cost. Developing low cost products is a major challenge for all researchers and key manufacturers, as manufacturing cost-effective materials require new detailed manufacturing cost analysis and processing cost models. Therefore, currently, the use of PMI foam is restricted to the aerospace industry, as the industry is not cost-sensitive and requires high-performance parts and components, thus preferring only high-grade core materials.
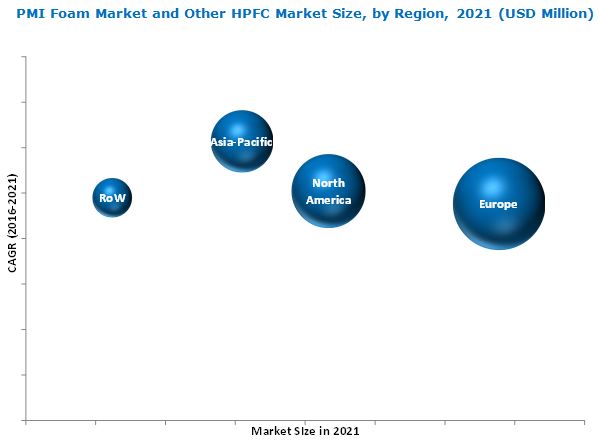
Currently, Europe is the largest consumer of PMI foam. The U.S., Germany, China, France, and the U.K, are among the major global markets of PMI foam. The market for PMI foam in Asia-Pacific is projected to register the highest CAGR during the forecast period. Growth of the aerospace & defense, wind energy, and sporting goods industries in the region has led to an increase in demand for PMI foam in the region.
The PMI foam market by application type is segmented into aerospace & defense, wind energy, sporting goods, and transportation among others.
Aerospace & Defense
The aerospace & defense industry has seen several changes in its components manufacturing process in the last few decades. Consumption of metal for manufacturing aircraft components has been replaced by various lightweight composites. Composites are important for this industry because they provide more structural strength than metallic alloys and are lightweight. This leads to improved fuel efficiency and performance of the aircraft.
Wind Energy
Wind energy is one of the world�s fastest-growing green energy sources. Recently, the blades for large wind turbines are being made from various low weight composites. These blades are made by combining core materials and glass-reinforced polyester/epoxy. PMI foam can be effectively used in both offshore and onshore turbine blades. Low density and closed cell properties of PMI foam minimize resin uptake and scales down resin absorption in comparison to balsa and other foam cores.
Sporting Goods
The properties offered by PMI foam, such as good thermoforming capacity and creep resistance make it suitable for use in many sporting goods such as skis, hockey sticks, snowboards, surfboards, and racing bicycle wheels. Using PMI foam in sporting goods make them lightweight and durable with high mechanical properties.
Transportation
The transportation industry faces many challenges such as, improving energy efficiency, reducing vehicle emissions, and increasing durability. It increasingly prefers composites to achieve improved performance, which includes high mechanical properties and low weight requirement. The performance of a vehicle depends on the weight of its components; the lighter the weight of the components, better is the performance. PMI foam that has high weight-reduction potential is used in both automotive and rail applications.
Critical questions the report answers:
- What are the upcoming hot bets for the PMI foam market?
- How market dynamics is with regards to development of new applications of PMI foam?
Evonik Industries AG (Germany), Baoding Meiwo Engineering Materials Technology Co., Ltd. (China), and Jiaxing Sky Composites Co., Ltd. (China) are the important active players in the PMI foam market. These companies have the highest strategic adoptions among other players in the global PMI foam market.
To speak to our analyst for a discussion on the above findings, click Speak to Analyst
 Exclusive indicates content/data unique to MarketsandMarkets and not available with any competitors.
Table of Contents
1 Introduction (Page No. - 13)
1.1 Objectives of the Study
1.2 Market Definition
1.3 Market Scope
1.3.1 Markets Covered
1.3.2 Years Considered for the Study
1.4 Currency
1.5 Package Size
1.6 Limitation
1.7 Stakeholders
2 Research Methodology (Page No. - 16)
2.1 Research Data
2.2 Secondary Data
2.3 Primary Data
2.4 Breakdown of Primaries
2.5 Market Size Estimation
2.6 Bottom-Up Approach
2.7 Top-Down Approach
2.8 Market Breakdown and Data Triangulation
2.9 Research Assumption
3 Executive Summary (Page No. - 23)
4 Premium Insights (Page No. - 27)
4.1 HPFC Market Size, 2016 vs. 2021
4.2 HPFC Market, By Application
4.3 Aerospace & Defense Application Accounted for the Largest Share of the HPFC Market in 2015
4.4 U.S. and Germany Account for Major Share of HPFC Market
4.5 HPFC Market, By Aerospace & Defense Application
5 Market Overview (Page No. - 32)
5.1 Introduction
5.2 Market Segmentation
5.2.1 HPFC Market, By Type
5.2.2 HPFC Market, By Application
5.2.3 HPFC Market, By Aerospace & Defense Application
5.3 Market Dynamics
5.3.1 Drivers
5.3.1.1 Growing Use of Foam Core Material in Aerospace & Defense Application
5.3.1.2 Exceptional Properties Offered By HPFC
5.3.2 Restraints
5.3.2.1 High Cost of HPFC Foam
5.3.3 Opportunities
5.3.3.1 Use of HPFC in New Application Markets and Increasing Consumption in Existing Applications
5.3.4 Challenges
5.3.4.1 to Compete With Nomex Honeycomb and Other Core Materials
5.3.4.2 to Produce Low-Cost Products
5.4 Porter�s Five Forces Analysis
5.4.1 Threat of New Entrants
5.4.2 Threat of Substitutes
5.4.3 Bargaining Power of Suppliers
5.4.4 Bargaining Power of Buyers
5.4.5 Intensity of Competitive Rivalry
6 HPFC Market, By Type (Page No. - 42)
6.1 Introduction
6.2 PMI Foam
6.3 PES Foam
6.4 Other HPFC Foam
7 HPFC Market, By Application (Page No. - 45)
7.1 Introduction
7.2 Aerospace & Defense
7.3 Wind Energy
7.4 Sporting Goods
7.5 Transportation
7.6 Other Applications
8 HPFC Market, in Aerospace & Defense Sub-Application (Page No. - 60)
8.1 Introduction
8.2 Exterior
8.3 Interior
9 HPFC Market, By Region (Page No. - 65)
9.1 Introduction
9.2 North America
9.2.1 North America: HPFC Market
9.3 Europe
9.3.1 Europe: HPFC Market
9.4 Asia-Pacific
9.4.1 Asia-Pacific: HPFC Market
9.5 RoW
10 Competitive Landscape (Page No. - 83)
10.1 Overview
10.2 Competitive Situations and Trends
10.2.1 Agreements
10.2.2 Expansions
10.2.3 New Product Launches
10.2.4 Joint Venture
11 Company Profiles (Page No. - 88)
(Overview, Financial*, Products & Services, Strategy, and Developments)
11.1 Evonik Industries AG
11.2 DIAB Group (Ratos)
11.3 SABIC
11.4 BASF SE
11.5 3A Composites
11.6 Solvay S.A.
11.7 Zotefoams PLC
11.8 Baoding Meiwo Science & Technology Development Co., Ltd.
11.9 Cashem Advanced Materials Hi-Tech Co., Ltd.
11.10 Jiaxing Sky Composites Co., Ltd.
*Details Might Not Be Captured in Case of Unlisted Companies.
12 Appendix (Page No. - 109)
12.1 Insights From Industry Experts
12.2 Discussion Guide
12.3 Knowledge Store: Marketsandmarkets� Subscription Portal
12.4 Introducing RT: Real-Time Market Intelligence
12.5 Related Reports
List of Tables (65 Tables)
Table 1 HPFC Market Size, 2014�2021
Table 2 HPFC Market Size, By Type, 2014�2021 (USD Million)
Table 3 HPFC Market Size, By Type, 2014�2021 (Ton)
Table 4 HPFC Market Size, By Application, 2014�2021 (USD Million)
Table 5 HPFC Market Size, By Application, 2014�2021 (Ton)
Table 6 PMI Foam Market Size, By Application, 2014�2021 (USD Million)
Table 7 PMI Foam Market Size, By Application, 2014�2021 (Ton)
Table 8 HPFC Market Size in Aerospace & Defense Application, By Region, 2014�2021 (USD Million)
Table 9 HPFC Market Size in Aerospace & Defense Application, By Region,2014�2021 (Ton)
Table 10 PMI Foam Market Size in Aerospace & Defense Application, By Region, 2014�2021 (USD Million)
Table 11 PMI Foam Market Size in Aerospace & Defense Application, By Region, 2014�2021 (Ton)
Table 12 HPFC Market Size in Wind Energy Application, By Region, 2014�2021 (USD Million)
Table 13 HPFC Market Size in Wind Energy Application, By Region,2014�2021 (Ton)
Table 14 PMI Foam Market Size in Wind Energy Application, By Region, 2014�2021 (USD Million)
Table 15 PMI Foam Market Size in Wind Energy Application, By Region,2014�2021 (Ton)
Table 16 HPFC Market Size in Sporting Goods Application, By Region, 2014�2021 (USD Million)
Table 17 HPFC Market Size in Sporting Goods Application, By Region,2014�2021 (Ton)
Table 18 PMI Foam Market Size in Sporting Goods Application, By Region, 2014�2021 (USD Million)
Table 19 PMI Foam Market Size in Sporting Goods Application, By Region, 2014�2021 (Ton)
Table 20 HPFC Market Size in Transportation Application, By Region, 2014�2021 (USD Million)
Table 21 HPFC Market Size in Transportation Application, By Region,2014�2021 (Ton)
Table 22 PMI Foam Market Size in Transportation Application, By Region, 2014�2021 (USD Million)
Table 23 PMI Foam Market Size in Transportation Application, By Region,2014�2021 (Ton)
Table 24 HPFC Market Size in Other Applications, By Region,2014�2021 (USD Million)
Table 25 HPFC Market Size in Other Applications, By Region, 2014�2021 (Ton)
Table 26 PMI Foam Market Size in Other Applications, By Region, 2014�2021 (USD Million)
Table 27 PMI Foam Market Size in Other Applications, By Region, 2014�2021 (Ton)
Table 28 HPFC Market Size: By Aerospace & Defense Application, 2014�2021 (USD Million)
Table 29 HPFC Market Size: By Aerospace & Defense Application, 2014�2021 (Ton)
Table 30 PMI Foam Market Size: By Aerospace & Defense Application, 2014�2021 (USD Million)
Table 31 PMI Foam Market Size: By Aerospace & Defense Application,2014�2021 (Ton)
Table 32 HPFC Market Size: By Exterior Aerospace & Defense Application, 2014�2021 (USD Million)
Table 33 HPFC Market Size: By Exterior Aerospace & Defense Application, 2014�2021 (Ton)
Table 34 HPFC Market Size: By Interior Aerospace & Defense Application, 2014�2021 (USD Million)
Table 35 HPFC Market Size: By Interior Aerospace & Defense Application, 2014�2021 (Ton)
Table 36 HPFC Market Size, By Region, 2014�2021 (USD Million)
Table 37 HPFC Market Size, By Region, 2014�2021 (Ton)
Table 38 PMI Foam Market Size, By Region, 2014�2021 (USD Million)
Table 39 PMI Foam Market Size, By Region, 2014�2021 (Ton)
Table 40 North America: HPFC Market Size, By Application,2014�2021 (USD Million)
Table 41 North America: HPFC Market Size, By Application, 2014�2021 (Ton)
Table 42 North America: PMI Foam Market Size, By Application, 2014�2021 (USD Million)
Table 43 North America: Market Size, By Application, 2014�2021 (Ton)
Table 44 North America: HPFC Market Size, By Country, 2014�2021 (USD Million)
Table 45 North America: HPFC Market Size, By Country, 2014�2021 (Ton)
Table 46 Europe: HPFC Market Size, By Application, 2014�2021 (USD Million)
Table 47 Europe: HPFC Market Size, By Application, 2014�2021 (Ton)
Table 48 Europe: Market Size, By Application, 2014�2021 (USD Million)
Table 49 Europe: PMI Foam Market Size, By Application, 2014�2021 (Ton)
Table 50 Europe: HPFC Market Size, By Country, 2014�2021 (USD Million)
Table 51 Europe: HPFC Market Size, By Country, 2014�2021 (Ton)
Table 52 Asia-Pacific: HPFC Market Size, By Application, 2014�2021 (USD Million)
Table 53 Asia-Pacific: HPFC Market Size, By Application, 2014�2021 (Ton)
Table 54 Asia-Pacific: PMI Foam Market Size, By Application,2014�2021 (USD Million)
Table 55 Asia-Pacific: Market Size, By Application, 2014�2021 (Ton)
Table 56 Asia-Pacific: HPFC Market Size, By Country, 2014�2021 (USD Million)
Table 57 Asia-Pacific: HPFC Market Size, By Country, 2014�2021 (Ton)
Table 58 RoW: HPFC Market Size, By Application, 2014�2021 (USD Million)
Table 59 RoW: HPFC Market Size, By Application, 2014�2021 (Ton)
Table 60 RoW: PMI Foam Market Size, By Application, 2014�2021 (USD Million)
Table 61 RoW: PMI Foam Market Size, By Application, 2014�2021 (Ton)
Table 62 Agreements, 2013�2016
Table 63 Expansions, 2013�2016
Table 64 New Product Launches, 2013�2016
Table 65 Joint Venture, 2013�2016
List of Figures (44 Figures)
Figure 1 HPFC Market Segmentation
Figure 2 HPFC Market: Research Design
Figure 3 Key Data From Secondary Sources
Figure 4 Key Data From Primary Sources
Figure 5 Breakdown of Primary Interviews: By Designation and Region
Figure 6 Market Size Estimation Methodology: Bottom-Up Approach
Figure 7 Market Size Estimation Methodology: Top-Down Approach
Figure 8 Data Triangulation: HPFC Market
Figure 9 Assumptions for the Research Study
Figure 10 Aerospace & Defense Application to Register the Highest CAGR in the HPFC Market
Figure 11 China is Projected to Be the Fastest-Growing Country in the HPFC Market
Figure 12 Europe Dominated the HPFC Market in 2015
Figure 13 Attractive Opportunities in the HPFC Market
Figure 14 Aerospace & Defense is Projected to Be the Fastest-Growing Application
Figure 15 Europe is the Largest HPFC Market, in Terms of Value
Figure 16 Germany is Expected to Drive the HPFC Market in Europe
Figure 17 Exterior Aerospace & Defense Application to Witness the Highest Growth Rate
Figure 18 Drivers, Restraints, Opportunities, and Challenges in the HPFC Market
Figure 19 Porter�s Five Forces Analysis
Figure 20 PMI Foam Segment to Have the Highest Growth Between 2016 and 2021
Figure 21 Aerospace & Defense Application to Dominate the HPFC Market, 2016 vs. 2021
Figure 22 The HPFC Market in Asia-Pacific to Register the Highest CAGR in Aerospace & Defense Application During the Forecast Period
Figure 23 Exterior Aerospace & Defense Application Segment to Have the Highest Growth Between 2016 and 2021
Figure 24 China Expected to Drive the HPFC Market in Asia-Pacific (2016�2021)
Figure 25 U.S. is the Most Lucrative Market in North America
Figure 26 Germany is the Fastest-Growing Market in Europe (2016�2021)
Figure 27 China is the Key HPFC Market in Asia-Pacific (2016�2021)
Figure 28 Both Organic and Inorganic Growth Strategies were Adopted By Major Players Between 2013 and 2016
Figure 29 Key Growth Strategies in High Performance Foam Core Market, 2013�2016
Figure 30 Yearly Market Development in High Performance Foam Core Market, 2013-2016
Figure 31 Evonik Industries AG: Company Snapshot
Figure 32 Evonik Industries AG: SWOT Analysis
Figure 33 DIAB Group: Company Snapshot
Figure 34 DIAB Group : SWOT Analysis
Figure 35 SABIC: Company Snapshot
Figure 36 SABIC: SWOT Analysis
Figure 37 BASF SE: Company Snapshot
Figure 38 BASF SE: SWOT Analysis
Figure 39 3A Composites: Company Snapshot
Figure 40 3A Composite : SWOT Analysis
Figure 41 Solvay S.A.: Company Snapshot
Figure 42 Solvay S.A.: SWOT Analysis
Figure 43 Zotefoams PLC: Company Snapshot
Figure 44 Zotefoams PLC: SWOT Analysis


Growth opportunities and latent adjacency in PMI Foam Market