Photocatalytic Coatings Market by Type (TiO2, ZnO), Application (Self-Cleaning, Air Purification, Water Treatment, Anti-fogging), End-use (Building & Construction, Transportation) & Region(North America, Europe, APAC, SA & MEA) - Global Forecast to 2028
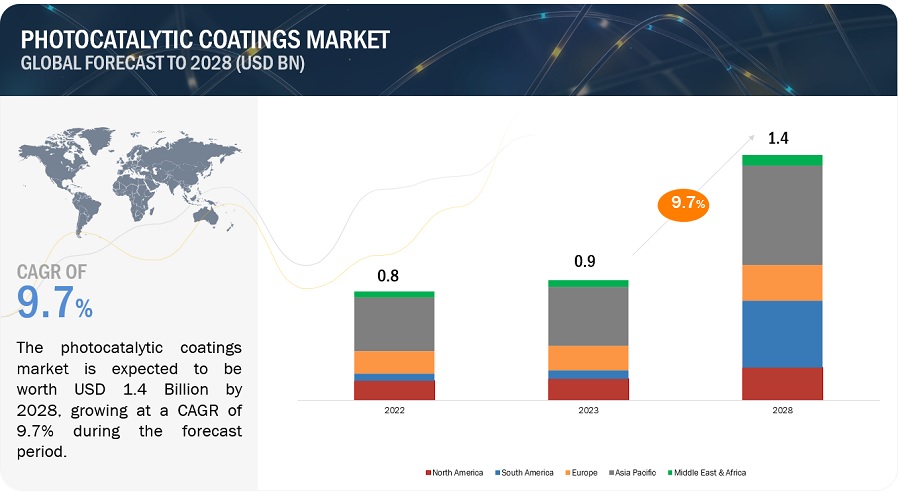
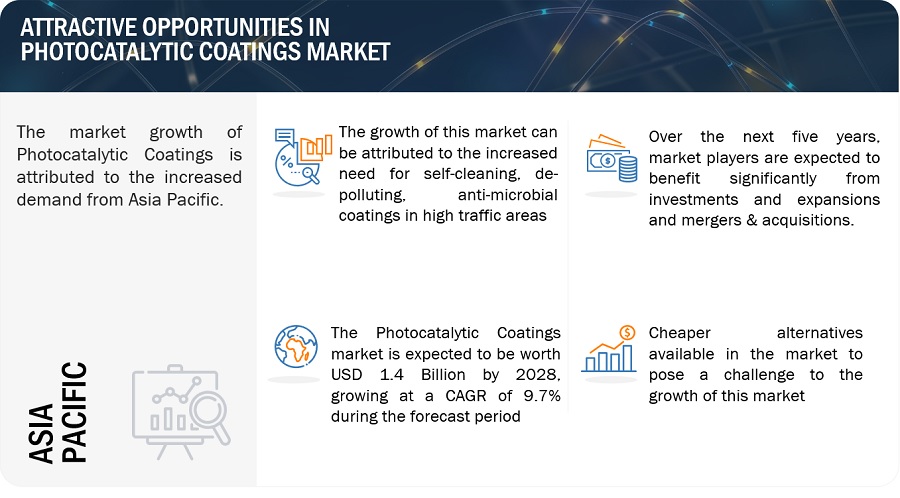
The Photocatalytic Coatings market is projected to grow from USD 0.9 billion in 2023 to USD 1.4 billion by 2028, at a CAGR of 9.7% between 2023-2028 respectively. Self-cleaning, de-polluting, and anti-microbial properties to drive the demand in high traffic areas for Photocatalytic Coatings.
Attractive Opportunities in the Photocatalytic Coatings Market
To know about the assumptions considered for the study, Request for Free Sample Report
Source: Expert Interviews, Secondary Sources, and MarketsandMarkets Analysis
Market Dynamics
Driver: Low VOC emissions
Indoor air quality is becoming a growing concern for consumers and business owners. Indoor air pollutants (VOCs — volatile organic compounds) can come from sources such as carpets, furnaces, furniture, insulation, pets, refuse and fuels from the garage. Photocatalysts are mainly added in the dispersion form to the coating systems. There are a few water based systems available in the market like low-solids gloss polish, higher solids gloss polish, satin 2K urethane system, etc. A lot of research are ongoing over the water based photocatalytic TiO2 coatings using different compositions. For example, in 2017, the photocatalytic efficiency of TIO2 nanoparticles is tested that are embedded in water-based styrene-acrylic coatings. Color characteristics, photocatalytic behavior, and resistance of the coating materials to VOC emissions and self-degradation was said suitable and can be used for indoor applications, even in the absence of suitable UV stabilizers.
Restraint: Increased cost for photocatalyst activation in a normal interior surface
Nanotechnology plays an important role in manufacturing photocatalytic coatings. This seeks not only to improve the traditional properties of the coating, but it also looks forward to providing conventional coatings with new functionalities, such as self-cleaning, antimicrobial, and air-purifying properties. However, although intensive research has been done during almost 20 years on TiO2 photocatalysis towards the above-mentioned properties, but the current restraint in applying this light-driven technology, have limited its efficiency in in-situ application and lead to increased costs for the users. Therefore, the TiO2 fundamentals in relation to the interior surfaces has main research gaps of the multifunctional properties obtained at the laboratory scale and in pilot projects.
Also, it has been observed that the initial activity of conventional photocatalytic titanium dioxide coatings is poor unless the coating has been pre-activated, such as by washing with water. This additional step makes application of a photocatalytic titanium dioxide coating inconvenient because it is time consuming and adds additional costs to the application process. In low light conditions (i.e., indoors) the de-pollution properties of the coating are less than optimal. It is desirable to provide a coating for use in low light environments that incorporates high levels of photocatalyst for optimal de-pollution and which is resistant to degradation yet provides high catalytic activity under indoor lighting conditions.
Opportunities: increased demand for visible light activated photocatalytic coatings
Photocatalytic coatings are frequently made with inorganic binders or organic polymers that are resistant to photocatalytic oxidation at low catalyst concentrations. However, the coating's de-pollution characteristics are less than perfect in low light situations. It would be desired to develop a coating for usage in low light areas that incorporates high levels of photocatalyst for optimal de-pollution and is resistant to deterioration while still providing high catalytic activity under indoor conditions.
The current invention seeks to produce coating formulations, particularly paint compositions, that contain titanium dioxide photocatalysts capable of eliminating pollutants from the air, and that have high initial activity without prior activation. Another goal of the invention is to create long-lasting coatings with high quantities of photocatalytic titanium dioxide that exhibit de-pollution activity in low-light environments, particularly in the presence of visible light.
Challenge: Cheaper alternatives available in the market
Titanium dioxide may play a key role in helping to reduce mankind's reliance on fossil fuels, while at the same time helping to create a more sterile environment inside a hospital. It is almost certain that new applications for this material will emerge in the future. But the challenge for researchers now lies in scaling up and developing photocatalytic coatings for economic production.
There are different alternatives available in the market like conventional solvent based and water-based coatings which are cheaper than photocatalytic coatings. Other alternatives include bio-based coatings, green coatings, and anti-microbial coatings. These coatings offer a great challenge to photocatalytic coatings in paints and coatings industry providing similar characteristics like low VOC emissions, reducing greenhouse effect, reducing CO2 emissions, defying microbes (bacteria, mold, and mildew) on the walls, etc. Also, these alternatives offer greater efficiency than that of photocatalytic coatings.
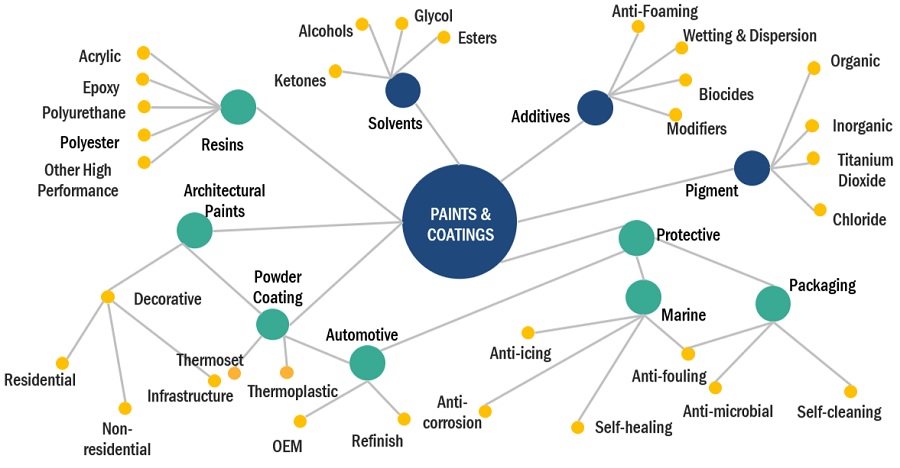
Market Ecosystem: Photocatalytic Coatings
The ecosystem of Photocatalytic coatings industry includes the entire process of converting raw materials—titanium dioxide, zinc oxide, tin oxide—into finished Photocatalytic coatings for various applications in end-use industries, such as residential, commercial, and educational installations. The Photocatalytic coatings industry focuses on advanced, cost-effective, high-performance materials that take less preparation, thereby increasing the air quality and protecting the substrate underneath. It is undergoing continuous technological upgrades in terms of the design and development of raw materials.
ZnO is the fastest-growing segment in Photocatalytic Coatings market between 2023 and 2028.
ZnO based photocatalytic coatings are very versatile and can by used for different purposes. One of the most important purpose of ZnO NPs is their ability to inhibit the growth of various bacterial and fungal strains, both in solution or on the surfaces. ZnO particles attracted the attention of many researchers due to its applications of UV absorption. Different scientists reported that zinc oxide has attracted much attention for photocatalytic coatings because of its property of high photosensitivity, which causes degradation of various pollutants. ZnO has potential as photocatalyst material because its property of wide band gap. Zinc oxide is an N-type semiconductor with a wide band gap of 3.37 eV and a large exciton binding energy of 60 meV.
Building & Construction is the largest end-use segment in the market of Photocatalytic Coatings between 2023 and 2028.
Buildings and construction is the largest end-use industry of Photocatalytic coatings because in this particular end-use industry the demand for such coatings is required for larger surface areas. There are numerous application areas such as building walls, glass, and metal claddings, historical building protection, fountain, sculpture, industrial facilities, etc. The benefits of these coatings includes the protection from sun’s UV radiation. They use UV radiation along with the oxygen and water vapor present in the air, to create active oxygen ions. The active oxygen ions, in turn, decompose the organic dirt into natural components by an oxidation-reduction reaction which then washed off when it rains.
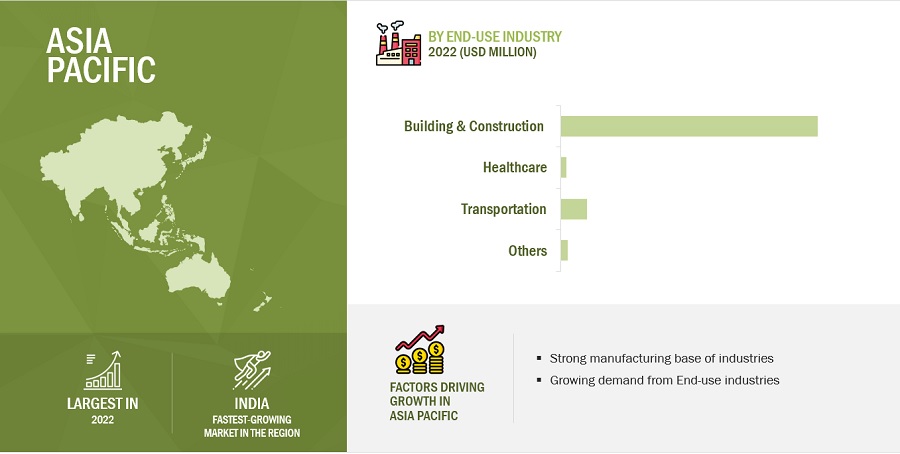
Asia Pacific is the fastest-growing region in Photocatalytic Coatings market.
Asia Pacific is the fastest growing market for Photocatalytic coatings market. It is the most industrialized and populous region. The building & construction sector in the region is evolving especially in India, China, and other emerging economies which further lead to the increased demand for these coatings. Moreover, after the widespread of COVID-19, every country has taken various measures towards the health of their residents and environment. Consumers are also learning about different coating alternatives that can fight with microbes and does not harm environment leading to rise in opportunities for the given market.
To know about the assumptions considered for the study, download the pdf brochure
Key Market Players
Mitsubishi Chemical Corporation (Japan), Kon Corporation (US), Photocatalytic Coatings Ltd. (New Zealand), USA Nanocoat (US), and Green Millennium (US) are the key players in the global Photocatalytic Coatings market.
Please visit 360Quadrants to see the vendor listing of Top paint and coating companies
Scope of the report
|
Report Metric |
Details |
|
Years Considered for the Study |
2021-2028 |
|
Base year |
2022 |
|
Forecast period |
2023–2028 |
|
Units considered |
Value (USD Billion/Million) and Volume (Kiloton) |
|
Segments |
By Type, Application, End-use Industry, and Region |
|
Regions covered |
North America, Europe, Asia Pacific, South America, and Middle East & Africa |
|
Companies profiled |
Mitsubishi Chemical Corporation (Japan), Kon Corporation (US), Saint-Gobain (France), USA Nanocoat (US), and Green Millennium (US). A total of 20 players have been covered. |
This research report categorizes the Photocatalytic coatings market based on type, application, end-use industry, and region.
By Type:
- Titanium dioxide
- Zinc oxide
By Aplication:
- Self-Cleaning
- Air Purification
- Water Treatment
- Anti-Fogging
By End-use Industry:
- Building & Construction
- Healthcare
- Transportation
By Region:
- North America
- Europe
- Asia Pacific
- South America
- Middle East & Africa
Frequently Asked Questions (FAQ):
What are the factors influencing the growth of Photocatalytic Coatings?
The Photocatalytic Coatings market is driven by increasing demand for low VOC emitting coatings.
What are the major applications for Photocatalytic Coatings?
The major applications of Photocatalytic Coatings are self-cleaning, air-purification, water treatment, and anti-fogging.
Which type is gaining popularity for Photocatalytic Coatings?
The ZnO based coatings are gaining popularity at the fastest rate in the Photocatalytic Coatings market.
Who are the major manufacturers?
Mitsubishi Chemical Corporation (Japan), Kon Corporation (US), Saint-Gobain (France), USA Nanocoat (US), and Green Millennium (US) are some of the leading players operating in the global Photocatalytic Coatings market.
Why Photocatalytic Coatings are gaining market share?
The growth of this market is attributed to the different properties of coatings like de-pollution, air purification, anti-fogging effect, and water treatment etc. .
To speak to our analyst for a discussion on the above findings, click Speak to Analyst


- 5.1 INTRODUCTION
-
5.2 MARKET DYNAMICSDRIVERS- Growing demand for self-cleaning, de-polluting, and anti-microbial coatings in high-traffic areas- Low VOC emissionsRESTRAINTS- Increased cost for photocatalyst activation in normal interior surface- Limited durability of photocatalytic coatingsOPPORTUNITIES- Increasing demand for visible light-activated photocatalytic coatings- Technological advancementsCHALLENGES- Availability of cheaper alternatives- Less awareness among consumers
-
5.3 PORTER'S FIVE FORCES ANALYSISTHREAT OF NEW ENTRANTSTHREAT OF SUBSTITUTESBARGAINING POWER OF BUYERSBARGAINING POWER OF SUPPLIERSINTENSITY OF COMPETITIVE RIVALRY
-
5.4 KEY STAKEHOLDERS AND BUYING CRITERIAKEY STAKEHOLDERS IN BUYING PROCESSBUYING CRITERIA- Key buying criteria for photocatalytic coatings
-
5.5 MACROECONOMIC INDICATOR ANALYSISINTRODUCTIONGDP TRENDS AND FORECASTTRENDS AND FORECAST OF GLOBAL CONSTRUCTION INDUSTRY
-
5.6 GLOBAL ECONOMIC SCENARIO AFFECTING MARKET GROWTHRUSSIA–UKRAINE WARCHINA- China's debt problem- Australia-China trade war- Environmental commitmentsEUROPE- Energy crisis in Europe
- 5.7 VALUE CHAIN ANALYSIS
-
5.8 PHOTOCATALYTIC COATINGS ECOSYSTEM AND INTERCONNECTED MARKETS
- 5.9 TRENDS AND DISRUPTIONS IMPACTING CUSTOMER BUSINESS
- 5.10 TRADE ANALYSIS
-
5.11 PATENT ANALYSISMETHODOLOGYPUBLICATION TRENDSTOP JURISDICTIONSTOP APPLICANTS
- 5.12 CASE STUDY ANALYSIS
-
5.13 PRICING ANALYSISAVERAGE SELLING PRICE TREND BY REGIONAVERAGE SELLING PRICE TREND BY TYPEAVERAGE SELLING PRICE TREND OF KEY PLAYERS, BY END USE INDUSTRY, 2022
- 5.14 TECHNOLOGY ANALYSIS
- 5.15 KEY CONFERENCES AND EVENTS IN 2023
-
5.16 TARIFF AND REGULATORY LANDSCAPEREGULATORY BODIES, GOVERNMENT AGENCIES, AND OTHER ORGANIZATIONS
- 6.1 INTRODUCTION
-
6.2 SELF-CLEANINGPHOTOCATALYTIC COATINGS USED TO REDUCE MAINTENANCE COSTS
-
6.3 AIR PURIFICATIONAPPLICATION OF PHOTOCATALYTIC COATINGS INCREASING TO IMPROVE AIR QUALITY IN INDOOR ENVIRONMENTS
-
6.4 WATER TREATMENTINNOVATIVE APPROACH TO PROVIDE ADDITIONAL PURIFICATION
-
6.5 ANTI-FOGGINGAUTOMOTIVE SECTOR TO BENEFIT SIGNIFICANTLY FROM ANTI-FOGGING APPLICATION OF PHOTOCATALYTIC COATINGS
- 6.6 OTHERS
- 7.1 INTRODUCTION
-
7.2 BUILDING & CONSTRUCTIONPHOTOCATALYTIC COATINGS INCREASINGLY USED TO REDUCE MAINTENANCE COSTS IN BUILDING & CONSTRUCTION
-
7.3 HEALTHCARERESEARCH & DEVELOPMENT IN HEALTHCARE INDUSTRY TO BOOST DEMAND FOR PHOTOCATALYTIC COATINGS
-
7.4 TRANSPORTATIONINCREASING DEMAND FOR PHOTOCATALYTIC COATINGS DUE TO THEIR ANTI-FOGGING PROPERTIES
- 7.5 OTHERS
- 8.1 INTRODUCTION
-
8.2 TITANIUM DIOXIDEMOST WIDELY USED TYPE OF PHOTOCATALYTIC COATING
-
8.3 ZINC OXIDEINCREASED USE IN BIOMEDICAL SECTOR TO DRIVE DEMAND
- 8.4 OTHERS
- 9.1 INTRODUCTION
-
9.2 ASIA PACIFICRECESSION IMPACT ON ASIA PACIFICCHINA- Increasing R&D in advancement of coatings to strengthen photocatalytic coatings marketINDIA- Modernization and economic development to support market growthJAPAN- Presence of well-established automotive industry to boost demandSOUTH KOREA- Transportation to be major end user of photocatalytic coatingsREST OF ASIA PACIFIC
-
9.3 EUROPERECESSION IMPACT ON EUROPEGERMANY- Adoption of new technologies to increase demand for photocatalytic coatings in automotive industryUK- Strong manufacturing sector to fuel market for photocatalytic coatingsFRANCE- Aerospace segment to boost photocatalytic coatings marketITALY- Automobile industry to fuel demand for photocatalytic coatingsSPAIN- Presence of prominent automotive and transportation sectors to drive marketTURKEY- Rapid urbanization and diversification to provide lucrative opportunitiesREST OF EUROPE
-
9.4 NORTH AMERICARECESSION IMPACT ON NORTH AMERICAUS- Increasing demand from infrastructure & transportation sectors to drive marketCANADA- Growing investment in infrastructure and development projects to boost demandMEXICO- Expanding building & construction industry to fuel demand for photocatalytic coatings
-
9.5 SOUTH AMERICARECESSION IMPACT ON SOUTH AMERICABRAZIL- Implementation of various construction projects to drive marketREST OF SOUTH AMERICA
-
9.6 MIDDLE EAST & AFRICARECESSION IMPACT ON MIDDLE EAST & AFRICASAUDI ARABIA- Mega housing projects to boost demand for photocatalytic coatingsUAE- Strong investments in infrastructure and urbanization to drive marketREST OF MIDDLE EAST & AFRICA

-
10.1 OVERVIEWOVERVIEW OF STRATEGIES ADOPTED BY PHOTOCATALYTIC COATING PLAYERS
-
10.2 COMPANY EVALUATION MATRIX (TIER 1 COMPANIES)STARSEMERGING LEADERSPERVASIVE PLAYERSPARTICIPANTS
- 10.3 STRENGTH OF PRODUCT PORTFOLIO
-
10.4 COMPANY EVALUATION MATRIX (START-UPS & SMES)RESPONSIVE COMPANIESPROGRESSIVE COMPANIESSTARTING BLOCKSDYNAMIC COMPANIES
- 10.5 MARKET SHARE ANALYSIS
- 10.6 REVENUE ANALYSIS OF KEY COMPANIES
-
10.7 COMPETITIVE SCENARIOMARKET EVALUATION FRAMEWORKCOMPETITIVE BENCHMARKINGCOMPETITIVE SITUATION AND TRENDS
-
11.1 KEY PLAYERSMITSUBISHI CHEMICAL GROUP CORPORATION- Business overview- Products offered- Recent developments- MnM viewKON CORPORATION- Business overview- Products offered- MnM viewUSA NANOCOAT- Business overview- Products offered- MnM viewGREEN MILLENNIUM- Business overview- Products offered- MnM viewSAINT-GOBAIN- Business overview- Products offered- MnM viewPHOTOCATALYST COATINGS NZ LTD.- Business overview- Products offeredACTIVA COATING- Business overview- Products offeredKEIM- Business overview- Products offeredECOACTIVE SOLUTIONS- Business overview- Products offeredFN-NANO- Business overview- Products offered
-
11.2 OTHER KEY PLAYERSSHIN-ETSU CHEMICAL CO., LTD.- Products offeredPOWER COLLOID GMBH- Products offeredNANOKSI- Products offeredRESYSTEN- Products offeredGXC COATINGS GMBH- Products offeredGREEN EARTH NANO SCIENCE INC.- Products offeredCODELOCKS LIMITED- Products offered- Recent developmentsSHREE HANS ENTERPRISES- Products offeredPIALEX TECHNOLOGIES CO., LTD.- Products offeredECOTONE COATINGS- Products offered
- 12.1 DISCUSSION GUIDE
- 12.2 KNOWLEDGESTORE: MARKETSANDMARKETS’ SUBSCRIPTION PORTAL
- 12.3 CUSTOMIZATION OPTIONS
- 12.4 RELATED REPORTS
- 12.5 AUTHOR DETAILS
- TABLE 1 PHOTOCATALYTIC COATINGS MARKET SNAPSHOT, 2023 VS. 2028
- TABLE 2 PHOTOCATALYTIC COATINGS MARKET: PORTER'S FIVE FORCES ANALYSIS
- TABLE 3 INFLUENCE OF STAKEHOLDERS ON BUYING PROCESS FOR TOP THREE END-USE INDUSTRIES (%)
- TABLE 4 KEY BUYING CRITERIA FOR PHOTOCATALYTIC COATINGS
- TABLE 5 TRENDS AND FORECAST OF GDP, PERCENTAGE CHANGE (2020–2027)
- TABLE 6 PHOTOCATALYTIC COATINGS MARKET: ROLE IN ECOSYSTEM
- TABLE 7 COUNTRY-WISE EXPORT DATA OF PAINTS AND VARNISHES (HS CODE 3209), 2019–2022 (USD THOUSAND)
- TABLE 8 COUNTRY-WISE IMPORT DATA OF PAINTS AND VARNISHES (HS CODE 3209), 2019–2022 (USD THOUSAND)
- TABLE 9 TOP PATENT OWNERS
- TABLE 10 PHOTOCATALYTIC COATINGS MARKET: KEY CONFERENCES AND EVENTS
- TABLE 11 NORTH AMERICA: REGULATORY BODIES, GOVERNMENT AGENCIES, AND OTHER ORGANIZATIONS
- TABLE 12 EUROPE: REGULATORY BODIES, GOVERNMENT AGENCIES, AND OTHER ORGANIZATIONS
- TABLE 13 MIDDLE EAST & AFRICA: REGULATORY BODIES, GOVERNMENT AGENCIES, AND OTHER ORGANIZATIONS
- TABLE 14 ASIA PACIFIC: REGULATORY BODIES, GOVERNMENT AGENCIES, AND OTHER ORGANIZATIONS
- TABLE 15 PHOTOCATALYTIC COATINGS MARKET SIZE, BY END-USE INDUSTRY, 2021–2022 (USD MILLION)
- TABLE 16 PHOTOCATALYTIC COATINGS MARKET SIZE, BY END-USE INDUSTRY, 2023–2028 (USD MILLION)
- TABLE 17 PHOTOCATALYTIC COATINGS MARKET SIZE, BY END-USE INDUSTRY, 2021–2022 (KILOTON)
- TABLE 18 PHOTOCATALYTIC COATINGS MARKET SIZE, BY END-USE INDUSTRY, 2023–2028 (KILOTON)
- TABLE 19 PHOTOCATALYTIC COATINGS MARKET SIZE IN BUILDING & CONSTRUCTION, BY REGION, 2021–2022 (USD MILLION)
- TABLE 20 PHOTOCATALYTIC COATINGS MARKET SIZE IN BUILDING & CONSTRUCTION, BY REGION, 2023–2028 (USD MILLION)
- TABLE 21 PHOTOCATALYTIC COATINGS MARKET SIZE IN BUILDING & CONSTRUCTION, BY REGION, 2021–2022 (KILOTON)
- TABLE 22 PHOTOCATALYTIC COATINGS MARKET SIZE IN BUILDING & CONSTRUCTION, BY REGION, 2023–2028 (KILOTON)
- TABLE 23 PHOTOCATALYTIC COATINGS MARKET SIZE IN HEALTHCARE, BY REGION, 2021–2022 (USD MILLION)
- TABLE 24 PHOTOCATALYTIC COATINGS MARKET SIZE IN HEALTHCARE, BY REGION, 2023–2028 (USD MILLION)
- TABLE 25 PHOTOCATALYTIC COATINGS MARKET SIZE IN HEALTHCARE, BY REGION, 2021–2022 (KILOTON)
- TABLE 26 PHOTOCATALYTIC COATINGS MARKET SIZE IN HEALTHCARE, BY REGION, 2023–2028 (KILOTON)
- TABLE 27 PHOTOCATALYTIC COATINGS MARKET SIZE IN TRANSPORTATION, BY REGION, 2021–2022 (USD MILLION)
- TABLE 28 PHOTOCATALYTIC COATINGS MARKET SIZE IN TRANSPORTATION, BY REGION, 2023–2028 (USD MILLION)
- TABLE 29 PHOTOCATALYTIC COATINGS MARKET SIZE IN TRANSPORTATION, BY REGION, 2021–2022 (KILOTON)
- TABLE 30 PHOTOCATALYTIC COATINGS MARKET SIZE IN TRANSPORTATION, BY REGION, 2023–2028 (KILOTON)
- TABLE 31 PHOTOCATALYTIC COATINGS MARKET SIZE IN OTHER INDUSTRIES, BY REGION, 2021–2022 (USD MILLION)
- TABLE 32 PHOTOCATALYTIC COATINGS MARKET SIZE IN OTHER INDUSTRIES, BY REGION, 2023–2028 (USD MILLION)
- TABLE 33 PHOTOCATALYTIC COATINGS MARKET SIZE IN OTHER INDUSTRIES, BY REGION, 2021–2022 (KILOTON)
- TABLE 34 PHOTOCATALYTIC COATINGS MARKET SIZE IN OTHER INDUSTRIES, BY REGION, 2023–2028 (KILOTON)
- TABLE 35 PHOTOCATALYTIC COATINGS MARKET SIZE, BY TYPE, 2021–2022 (USD MILLION)
- TABLE 36 PHOTOCATALYTIC COATINGS MARKET SIZE, BY TYPE, 2023–2028 (USD MILLION)
- TABLE 37 PHOTOCATALYTIC COATINGS MARKET SIZE, BY TYPE, 2021–2022 (KILOTON)
- TABLE 38 PHOTOCATALYTIC COATINGS MARKET SIZE, BY TYPE, 2023–2028 (KILOTON)
- TABLE 39 TITANIUM DIOXIDE PHOTOCATALYTIC COATINGS MARKET SIZE, BY REGION, 2021–2022 (USD MILLION)
- TABLE 40 TITANIUM DIOXIDE PHOTOCATALYTIC COATINGS MARKET SIZE, BY REGION, 2023–2028 (USD MILLION)
- TABLE 41 TITANIUM DIOXIDE PHOTOCATALYTIC COATINGS MARKET SIZE, BY REGION, 2021–2022 (KILOTON)
- TABLE 42 TITANIUM DIOXIDE PHOTOCATALYTIC COATINGS MARKET SIZE, BY REGION, 2023–2028 (KILOTON)
- TABLE 43 ZINC OXIDE PHOTOCATALYTIC COATINGS MARKET SIZE, BY REGION, 2021–2022 (USD MILLION)
- TABLE 44 ZINC OXIDE PHOTOCATALYTIC COATINGS MARKET SIZE, BY REGION, 2023–2028 (USD MILLION)
- TABLE 45 ZINC OXIDE PHOTOCATALYTIC COATINGS MARKET SIZE, BY REGION, 2021–2022 (KILOTON)
- TABLE 46 ZINC OXIDE PHOTOCATALYTIC COATINGS MARKET SIZE, BY REGION, 2023–2028 (KILOTON)
- TABLE 47 OTHER PHOTOCATALYTIC COATINGS MARKET SIZE, BY REGION, 2021–2022 (USD MILLION)
- TABLE 48 OTHER PHOTOCATALYTIC COATINGS MARKET SIZE, BY REGION, 2023–2028 (USD MILLION)
- TABLE 49 OTHER PHOTOCATALYTIC COATINGS MARKET SIZE, BY REGION, 2021–2022 (KILOTON)
- TABLE 50 OTHER PHOTOCATALYTIC COATINGS MARKET SIZE, BY REGION, 2023–2028 (KILOTON)
- TABLE 51 PHOTOCATALYTIC COATINGS MARKET SIZE, BY REGION, 2021–2022 (USD MILLION)
- TABLE 52 PHOTOCATALYTIC COATINGS MARKET SIZE, BY REGION, 2023–2028 (USD MILLION)
- TABLE 53 PHOTOCATALYTIC COATINGS MARKET SIZE, BY REGION, 2021–2022 (KILOTON)
- TABLE 54 PHOTOCATALYTIC COATINGS MARKET SIZE, BY REGION, 2023–2028 (KILOTON)
- TABLE 55 ASIA PACIFIC: PHOTOCATALYTIC COATINGS MARKET SIZE, BY TYPE, 2021–2022 (USD MILLION)
- TABLE 56 ASIA PACIFIC: PHOTOCATALYTIC COATINGS MARKET SIZE, BY TYPE, 2023–2028 (USD MILLION)
- TABLE 57 ASIA PACIFIC: PHOTOCATALYTIC COATINGS MARKET SIZE, BY TYPE, 2021–2022 (KILOTON)
- TABLE 58 ASIA PACIFIC: PHOTOCATALYTIC COATINGS MARKET SIZE, BY TYPE, 2023–2028 (KILOTON)
- TABLE 59 ASIA PACIFIC: PHOTOCATALYTIC COATINGS MARKET SIZE, BY END-USE INDUSTRY, 2021–2022 (USD MILLION)
- TABLE 60 ASIA PACIFIC: PHOTOCATALYTIC COATINGS MARKET SIZE, BY END-USE INDUSTRY, 2023–2028 (USD MILLION)
- TABLE 61 ASIA PACIFIC: PHOTOCATALYTIC COATINGS MARKET SIZE, BY END-USE INDUSTRY, 2021–2022 (KILOTON)
- TABLE 62 ASIA PACIFIC: PHOTOCATALYTIC COATINGS MARKET SIZE, BY END-USE INDUSTRY, 2023–2028 (KILOTON)
- TABLE 63 ASIA PACIFIC: PHOTOCATALYTIC COATINGS MARKET SIZE, BY COUNTRY, 2021–2022 (USD MILLION)
- TABLE 64 ASIA PACIFIC: PHOTOCATALYTIC COATINGS MARKET SIZE, BY COUNTRY, 2023–2028 (USD MILLION)
- TABLE 65 ASIA PACIFIC: PHOTOCATALYTIC COATINGS MARKET SIZE, BY COUNTRY, 2021–2022 (KILOTON)
- TABLE 66 ASIA PACIFIC: PHOTOCATALYTIC COATINGS MARKET SIZE, BY COUNTRY, 2023–2028 (KILOTON)
- TABLE 67 EUROPE: PHOTOCATALYTIC COATINGS MARKET SIZE, BY TYPE, 2021–2022 (USD MILLION)
- TABLE 68 EUROPE: PHOTOCATALYTIC COATINGS MARKET SIZE, BY TYPE, 2023–2028 (USD MILLION)
- TABLE 69 EUROPE: PHOTOCATALYTIC COATINGS MARKET SIZE, BY TYPE, 2021–2022 (KILOTON)
- TABLE 70 EUROPE: PHOTOCATALYTIC COATINGS MARKET SIZE, BY TYPE, 2023–2028 (KILOTON)
- TABLE 71 EUROPE: PHOTOCATALYTIC COATINGS MARKET SIZE, BY END-USE INDUSTRY, 2021–2022 (USD MILLION)
- TABLE 72 EUROPE: PHOTOCATALYTIC COATINGS MARKET SIZE, BY END-USE INDUSTRY, 2023–2028 (USD MILLION)
- TABLE 73 EUROPE: PHOTOCATALYTIC COATINGS MARKET SIZE, BY END-USE INDUSTRY, 2021–2022 (KILOTON)
- TABLE 74 EUROPE: PHOTOCATALYTIC COATINGS MARKET SIZE, BY END-USE INDUSTRY, 2023–2028 (KILOTON)
- TABLE 75 EUROPE: PHOTOCATALYTIC COATINGS MARKET SIZE, BY COUNTRY, 2021–2022 (USD MILLION)
- TABLE 76 EUROPE: PHOTOCATALYTIC COATINGS MARKET SIZE, BY COUNTRY, 2023–2028 (USD MILLION)
- TABLE 77 EUROPE: PHOTOCATALYTIC COATINGS MARKET SIZE, BY COUNTRY, 2021–2022 (KILOTON)
- TABLE 78 EUROPE: PHOTOCATALYTIC COATINGS MARKET SIZE, BY COUNTRY, 2023–2028 (KILOTON)
- TABLE 79 NORTH AMERICA: PHOTOCATALYTIC COATINGS MARKET SIZE, BY TYPE, 2021–2022 (USD MILLION)
- TABLE 80 NORTH AMERICA: PHOTOCATALYTIC COATINGS MARKET SIZE, BY TYPE, 2023–2028 (USD MILLION)
- TABLE 81 NORTH AMERICA: PHOTOCATALYTIC COATINGS MARKET SIZE, BY TYPE, 2021–2022 (KILOTON)
- TABLE 82 NORTH AMERICA: PHOTOCATALYTIC COATINGS MARKET SIZE, BY TYPE, 2023–2028 (KILOTON)
- TABLE 83 NORTH AMERICA: PHOTOCATALYTIC COATINGS MARKET SIZE, BY END-USE INDUSTRY, 2021–2022 (USD MILLION)
- TABLE 84 NORTH AMERICA: PHOTOCATALYTIC COATINGS MARKET SIZE, BY END-USE INDUSTRY, 2023–2028 (USD MILLION)
- TABLE 85 NORTH AMERICA: PHOTOCATALYTIC COATINGS MARKET SIZE, BY END-USE INDUSTRY, 2021–2022 (KILOTON)
- TABLE 86 NORTH AMERICA: PHOTOCATALYTIC COATINGS MARKET SIZE, BY END-USE INDUSTRY, 2023–2028 (KILOTON)
- TABLE 87 NORTH AMERICA: PHOTOCATALYTIC COATINGS MARKET SIZE, BY COUNTRY, 2021–2022 (USD MILLION)
- TABLE 88 NORTH AMERICA: PHOTOCATALYTIC COATINGS MARKET SIZE, BY COUNTRY, 2023–2028 (USD MILLION)
- TABLE 89 NORTH AMERICA: PHOTOCATALYTIC COATINGS MARKET SIZE, BY COUNTRY, 2021–2022 (KILOTON)
- TABLE 90 NORTH AMERICA: PHOTOCATALYTIC COATINGS MARKET SIZE, BY COUNTRY, 2023–2028 (KILOTON)
- TABLE 91 SOUTH AMERICA: PHOTOCATALYTIC COATINGS MARKET SIZE, BY TYPE, 2021–2022 (USD MILLION)
- TABLE 92 SOUTH AMERICA: PHOTOCATALYTIC COATINGS MARKET SIZE, BY TYPE, 2023–2028 (USD MILLION)
- TABLE 93 SOUTH AMERICA: PHOTOCATALYTIC COATINGS MARKET SIZE, BY TYPE, 2021–2022 (KILOTON)
- TABLE 94 SOUTH AMERICA: PHOTOCATALYTIC COATINGS MARKET SIZE, BY TYPE, 2023–2028 (KILOTON)
- TABLE 95 SOUTH AMERICA: PHOTOCATALYTIC COATINGS MARKET SIZE, BY END-USE INDUSTRY, 2021–2022 (USD MILLION)
- TABLE 96 SOUTH AMERICA: PHOTOCATALYTIC COATINGS MARKET SIZE, BY END-USE INDUSTRY, 2023–2028 (USD MILLION)
- TABLE 97 SOUTH AMERICA: PHOTOCATALYTIC COATINGS MARKET SIZE, BY END-USE INDUSTRY, 2021–2022 (KILOTON)
- TABLE 98 SOUTH AMERICA: PHOTOCATALYTIC COATINGS MARKET SIZE, BY END-USE INDUSTRY, 2023–2028 (KILOTON)
- TABLE 99 SOUTH AMERICA: PHOTOCATALYTIC COATINGS MARKET SIZE, BY COUNTRY, 2021–2022 (USD MILLION)
- TABLE 100 SOUTH AMERICA: PHOTOCATALYTIC COATINGS MARKET SIZE, BY COUNTRY, 2023–2028 (USD MILLION)
- TABLE 101 SOUTH AMERICA: PHOTOCATALYTIC COATINGS MARKET SIZE, BY COUNTRY, 2021–2022 (KILOTON)
- TABLE 102 SOUTH AMERICA: PHOTOCATALYTIC COATINGS MARKET SIZE, BY COUNTRY, 2023–2028 (KILOTON)
- TABLE 103 MIDDLE EAST & AFRICA: PHOTOCATALYTIC COATINGS MARKET SIZE, BY TYPE, 2021–2022 (USD MILLION)
- TABLE 104 MIDDLE EAST & AFRICA: PHOTOCATALYTIC COATINGS MARKET SIZE, BY TYPE, 2023–2028 (USD MILLION)
- TABLE 105 MIDDLE EAST & AFRICA: PHOTOCATALYTIC COATINGS MARKET SIZE, BY TYPE, 2021–2022 (KILOTON)
- TABLE 106 MIDDLE EAST & AFRICA: PHOTOCATALYTIC COATINGS MARKET SIZE, BY TYPE, 2023–2028 (KILOTON)
- TABLE 107 MIDDLE EAST & AFRICA: PHOTOCATALYTIC COATINGS MARKET SIZE, BY END-USE INDUSTRY, 2021–2022 (USD MILLION)
- TABLE 108 MIDDLE EAST & AFRICA: PHOTOCATALYTIC COATINGS MARKET SIZE, BY END-USE INDUSTRY, 2023–2028 (USD MILLION)
- TABLE 109 MIDDLE EAST & AFRICA: PHOTOCATALYTIC COATINGS MARKET SIZE, BY END-USE INDUSTRY, 2021–2022 (KILOTON)
- TABLE 110 MIDDLE EAST & AFRICA: PHOTOCATALYTIC COATINGS MARKET SIZE, BY END-USE INDUSTRY, 2023–2028 (KILOTON)
- TABLE 111 MIDDLE EAST & AFRICA: PHOTOCATALYTIC COATINGS MARKET SIZE, BY COUNTRY, 2021–2022 (USD MILLION)
- TABLE 112 MIDDLE EAST & AFRICA: PHOTOCATALYTIC COATINGS MARKET SIZE, BY COUNTRY, 2023–2028 (USD MILLION)
- TABLE 113 MIDDLE EAST & AFRICA: PHOTOCATALYTIC COATINGS MARKET SIZE, BY COUNTRY, 2021–2022 (KILOTON)
- TABLE 114 MIDDLE EAST & AFRICA: PHOTOCATALYTIC COATINGS MARKET SIZE, BY COUNTRY, 2023–2028 (KILOTON)
- TABLE 115 PHOTOCATALYTIC COATINGS MARKET: INTENSITY OF COMPETITIVE RIVALRY, 2022
- TABLE 116 STRATEGIC DEVELOPMENTS, BY COMPANY
- TABLE 117 HIGHEST ADOPTED STRATEGIES
- TABLE 118 NUMBER OF GROWTH STRATEGIES ADOPTED BY KEY COMPANIES
- TABLE 119 COMPANY FOOTPRINT, BY APPLICATION
- TABLE 120 COMPANY FOOTPRINT, BY REGION
- TABLE 121 COMPANY OVERALL FOOTPRINT
- TABLE 122 PHOTOCATALYTIC COATINGS MARKET: PRODUCT LAUNCHES, 2016–2022
- TABLE 123 MITSUBISHI CHEMICAL GROUP CORPORATION: COMPANY OVERVIEW
- TABLE 124 MITSUBISHI CHEMICAL GROUP CORPORATION: PRODUCT LAUNCHES
- TABLE 125 KON CORPORATION: COMPANY OVERVIEW
- TABLE 126 USA NANOCOAT: COMPANY OVERVIEW
- TABLE 127 GREEN MILLENNIUM: COMPANY OVERVIEW
- TABLE 128 SAINT-GOBAIN: COMPANY OVERVIEW
- TABLE 129 PHOTOCATALYST COATINGS NZ LTD.: COMPANY OVERVIEW
- TABLE 130 ACTIVA COATING: COMPANY OVERVIEW
- TABLE 131 KEIM: COMPANY OVERVIEW
- TABLE 132 ECOACTIVE SOLUTIONS: COMPANY OVERVIEW
- TABLE 133 FN-NANO: COMPANY OVERVIEW
- TABLE 134 SHIN-ETSU CHEMICAL CO., LTD.: COMPANY OVERVIEW
- TABLE 135 POWER COLLOID GMBH: COMPANY OVERVIEW
- TABLE 136 NANOKSI: COMPANY OVERVIEW
- TABLE 137 RESYSTEN: COMPANY OVERVIEW
- TABLE 138 GXC COATINGS GMBH: COMPANY OVERVIEW
- TABLE 139 GREEN EARTH NANO SCIENCE INC.: COMPANY OVERVIEW
- TABLE 140 CODELOCKS LIMITED: COMPANY OVERVIEW
- TABLE 141 CODELOCKS LIMITED: PRODUCT LAUNCHES
- TABLE 142 SHREE HANS ENTERPRISES: COMPANY OVERVIEW
- TABLE 143 PIALEX TECHNOLOGIES CO., LTD.: COMPANY OVERVIEW
- TABLE 144 ECOTONE COATINGS: COMPANY OVERVIEW
- FIGURE 1 PHOTOCATALYTIC COATINGS MARKET: RESEARCH DESIGN
- FIGURE 2 MARKET SIZE ESTIMATION: BOTTOM-UP APPROACH
- FIGURE 3 PHOTOCATALYTIC COATINGS MARKET SIZE ESTIMATION, BY VALUE
- FIGURE 4 PHOTOCATALYTIC COATINGS MARKET SIZE ESTIMATION, BY REGION
- FIGURE 5 PHOTOCATALYTIC COATINGS MARKET SIZE ESTIMATION, BY TYPE
- FIGURE 6 PHOTOCATALYTIC COATINGS MARKET: SUPPLY-SIDE FORECAST
- FIGURE 7 METHODOLOGY FOR SUPPLY-SIDE SIZING OF PHOTOCATALYTIC COATINGS MARKET
- FIGURE 8 FACTOR ANALYSIS OF PHOTOCATALYTIC COATINGS MARKET
- FIGURE 9 PHOTOCATALYTIC COATINGS MARKET: DATA TRIANGULATION
- FIGURE 10 TITANIUM DIOXIDE TO DOMINATE MARKET DURING FORECAST PERIOD
- FIGURE 11 BUILDING & CONSTRUCTION INDUSTRY TO ACCOUNT FOR LARGEST SHARE OF PHOTOCATALYTIC COATINGS MARKET
- FIGURE 12 EMERGING ECONOMIES TO OFFER LUCRATIVE GROWTH OPPORTUNITIES FOR MARKET PLAYERS BETWEEN 2023 AND 2028
- FIGURE 13 TITANIUM DIOXIDE TO BE LARGEST SEGMENT BY 2028
- FIGURE 14 ASIA PACIFIC ACCOUNTED FOR LARGEST SHARE OF PHOTOCATALYTIC COATINGS MARKETS
- FIGURE 15 ASIA PACIFIC TO GROW AT HIGHEST RATE DURING FORECAST PERIOD
- FIGURE 16 DRIVERS, RESTRAINTS, OPPORTUNITIES, AND CHALLENGES IN PHOTOCATALYTIC COATINGS MARKET
- FIGURE 17 PORTER'S FIVE FORCES ANALYSIS: PHOTOCATALYTIC COATINGS MARKET
- FIGURE 18 GLOBAL SPENDING IN CONSTRUCTION INDUSTRY, 2014–2035
- FIGURE 19 PHOTOCATALYTIC COATINGS MARKET: VALUE CHAIN ANALYSIS
- FIGURE 20 PAINTS & COATINGS MARKET: ECOSYSTEM MAPPING
- FIGURE 21 NUMBER OF PATENTS PUBLISHED, 2019–2023
- FIGURE 22 PATENTS PUBLISHED, BY JURISDICTION (2019–2023)
- FIGURE 23 PATENTS PUBLISHED BY MAJOR APPLICANTS, 2019–2023
- FIGURE 24 AVERAGE SELLING PRICE TREND OF PHOTOCATALYTIC COATINGS, BY REGION, 2022
- FIGURE 25 AVERAGE SELLING PRICE TREND OF PHOTOCATALYTIC COATINGS, BY TYPE, 2022
- FIGURE 26 AVERAGE SELLING PRICE TREND OF PHOTOCATALYTIC COATINGS, BY END USE, 2022
- FIGURE 27 AVERAGE SELLING PRICE TREND OF PHOTOCATALYTIC COATINGS OF KEY PLAYERS, BY END-USE INDUSTRY, 2022
- FIGURE 28 BUILDING & CONSTRUCTION SEGMENT TO REGISTER HIGHEST CAGR DURING FORECAST PERIOD
- FIGURE 29 TITANIUM DIOXIDE SEGMENT TO LEAD PHOTOCATALYTIC COATINGS MARKET
- FIGURE 30 ASIA PACIFIC TO BE FASTEST-GROWING PHOTOCATALYTIC COATINGS MARKET
- FIGURE 31 ASIA PACIFIC: PHOTOCATALYTIC COATINGS MARKET SNAPSHOT
- FIGURE 32 EUROPE: PHOTOCATALYTIC COATINGS MARKET SNAPSHOT
- FIGURE 33 NORTH AMERICA: PHOTOCATALYTIC COATINGS MARKET SNAPSHOT
- FIGURE 34 PHOTOCATALYTIC COATINGS MARKET: COMPANY EVALUATION MATRIX (TIER 1 COMPANIES)
- FIGURE 35 PHOTOCATALYTIC COATINGS MARKET: COMPANY EVALUATION MATRIX (START-UPS & SMES)
- FIGURE 36 MARKET SHARE, BY KEY PLAYERS (2022)
- FIGURE 37 REVENUE ANALYSIS OF TOP FIVE PLAYERS, 2021-2022
- FIGURE 38 MITSUBISHI CHEMICAL GROUP CORPORATION: COMPANY SNAPSHOT
- FIGURE 39 SAINT-GOBAIN: COMPANY SNAPSHOT
The study involves four major activities in estimating the current market size of Photocatalytic coatings. Exhaustive secondary research was done to collect information on the market, peer, and parent markets. The next step was to validate these findings, assumptions, and sizing with industry experts across the value chain through primary research. Both the top-down and bottom-up approaches were employed to estimate the complete market size. After that, the market breakdown and data triangulation methods were used to estimate the size of the segments and sub-segments of the overall market.
Secondary Research
In the secondary research process, various secondary sources, such as Hoovers, Bloomberg BusinessWeek, and Dun & Bradstreet, have been referred to for identifying and collecting information for this study. These secondary sources also included annual reports, press releases & investor presentations of companies; white papers; certified publications; articles by recognized authors; gold standard & silver standard websites; regulatory bodies; trade directories; and databases.
Primary Research
The Photocatalytic coatings market comprises several stakeholders, such as raw material suppliers, end-product manufacturers, and regulatory organizations. The demand side of this market is characterized by the development in end-use industries such as building and construction, healthcare, transportation, etc. Advancements in formulations characterize the supply side. Various primary sources from both the supply and demand sides of the market were interviewed to obtain qualitative and quantitative information.
Following is the breakdown of primary respondents:
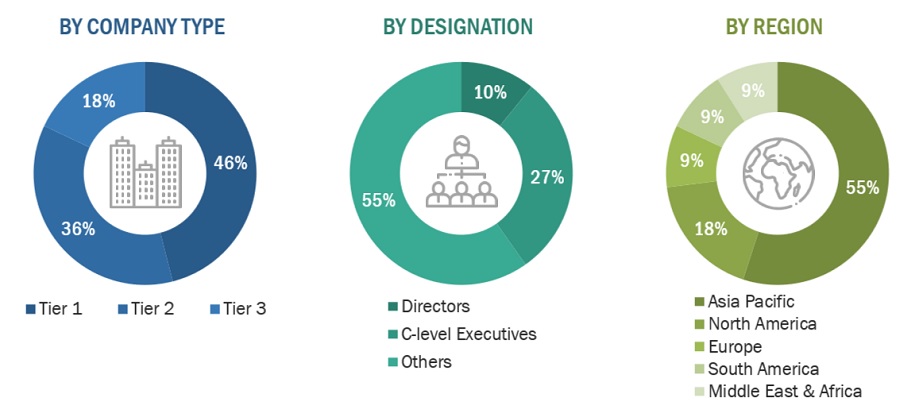
To know about the assumptions considered for the study, download the pdf brochure
Market Size Estimation
Both the top-down and bottom-up approaches were used to estimate and validate the total size of the Photocatalytic coatings market. These methods were also used extensively to estimate the sizes of various sub-segments in the market. The research methodology used to estimate the size of the photocatalytic coatings market includes the following details. The market sizing of the market was undertaken from the demand side. The market was upsized based on procurements and modernizations in Titanium Dioxide, Zinc Oxide and Others at a regional level. Such procurements provide information on the demand aspects of photocatalytic coatings.
Global Photocatalytic coatings Market Size: Bottom-Up Approach
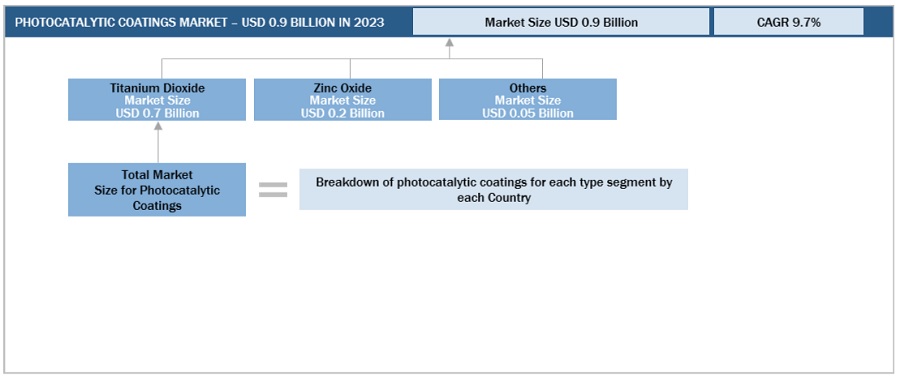
To know about the assumptions considered for the study, Request for Free Sample Report
Global Photocatalytic Coatings Market Size: Top-Down Approach

Data Triangulation
After arriving at the overall size from the market size estimation process explained above, the total market was split into several segments and subsegments. The data triangulation and market breakdown procedures explained below were implemented, wherever applicable, to complete the overall market engineering process and arrive at the exact statistics for various market segments and subsegments. The data was triangulated by studying various factors and trends from the demand and supply sides. Along with this, the market size was validated using both the top-down and bottom-up approaches.
Market Definition
Photocatalytic Coating contains photocatalysts as ingredients which absorb light and catalyze the reaction. The excitation of the photocatalyst causes several reactions at the surface of the coating. This light stimulation of the photocatalyst transforms the properties of the coated surface, creating air purification and self-cleaning properties. Photocatalyst Coatings are transparent and designed for a wide variety of everyday surfaces.
Key Stakeholders
- Manufacturers of Photocatalytic Coatings and their raw materials
- Manufacturers of Photocatalytic Coatings for various end-use industries in sectors such as building & construction, healthcare, transportation, and others
- Traders, Distributors, and Suppliers of Photocatalytic Coatings
- Regional manufacturers’ Associations and Photocatalytic Coatings Associations
- Government and Regional Agencies and Research Organizations
Report Objectives
- To analyze and forecast the size of the Photocatalytic coatings market in terms of value and volume
- To define, describe, and forecast the Photocatalytic coatings market by type, application, end-use industry, and region
- To provide detailed information about the drivers, restraints, opportunities, and challenges influencing the growth of the market
- To forecast the market size of the Photocatalytic coatings market concerning the five major region i.e., North America, Europe, Asia Pacific, South America, and Middle East & Africa
- To strategically analyze micromarkets1 with respect to individual growth trends, growth prospects, and their contribution to the overall market
- To analyze the opportunities in the market for stakeholders and provide a competitive landscape for the market leaders
- To analyze competitive developments, such as mergers & acquisitions, new product launches, and investments & expansions, in the Photocatalytic coatings market
- To strategically profile key players and comprehensively analyze their market shares and core competencies2
Note: 1. Micromarkets are defined as the sub-segments of the Photocatalytic coatings market included in the report.
Note 2: Core competencies of the companies are captured in terms of their key developments and key strategies adopted to sustain their position in the market.
Available Customizations
MarketsandMarkets offers customizations according to the specific needs of the companies with the given market data.
The following customization options are available for the report:
Product Analysis
- Product matrix, which gives a detailed comparison of the product portfolio of each company
Regional Analysis
- Further breakdown of the Photocatalytic coatings market, by region
Company Information
- Detailed analysis and profiling of additional market players (up to five)


Growth opportunities and latent adjacency in Photocatalytic Coatings Market