Phosphate Ester Market by Type (Triaryl Phosphate Esters, Trialkyl Phosphate Esters, Alkyl Aryl Phosphate Ester), Application (Lubricants, Surfactants, Pesticides, Fire Retardants), Region (North America, Europe, Asia-Pacific) - Global Forecast to 2022


The phosphate ester market is projected to reach at USD 1,179.8 Million by 2022, at a CAGR of 6.9% from 2017 to 2022.
The Objectives of Phosphate Ester Market Study are:
- To identify statistics of the phosphate esters market with detailed classifications, in terms of volume and value
- To provide a detailed segmentation of the phosphate ester market, on the basis of application, type, and region
- To identify emerging trends and opportunities in the phosphate esters market
- To analyze the phosphate ester market with focus on high-growth applications and fastest-growing market segments
- To analyze the impact of the factors that are currently driving and restraining the growth of the phosphate esters market
- To strategically analyze micromarkets with respect to individual growth trends, growth prospects, and contribution to the total market
- To analyze the opportunities in the phosphate ester market for stakeholders and study the competitive landscape for market leaders
- To project the size of market segments, in terms of value, with respect to five main regions, namely, Asia Pacific, North America, Europe, South America, and the Middle East & Africa
- To track and analyze competitive developments, such as new product launches, acquisitions, investments, expansions, partnerships, agreements, joint ventures, collaborations, product approvals, and other developments in the phosphate esters market
- To strategically profile key players and comprehensively analyze their core competencies
The years considered for the study are:
- Base Year – 2016
- Estimated Year – 2017
- Projected Year – 2022
- Forecast Period – 2017 to 2022
For company profiles in the report, 2016 has been considered as the base year. In certain cases, wherein information is unavailable for the base year, the years prior to it have been considered.
Phosphate Ester Market Research Methodology
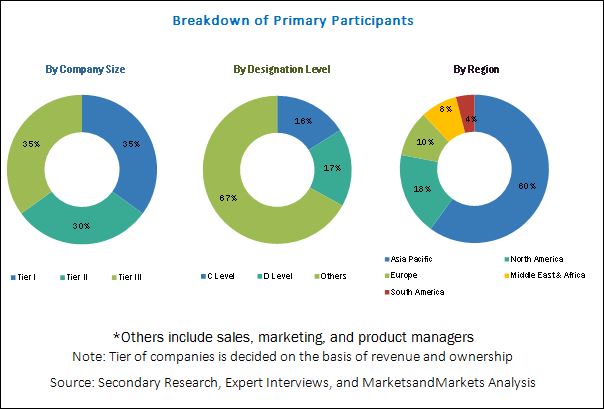
The research methodology used to estimate and forecast the global phosphate esters market began with capturing data on key vendor revenues through secondary sources, such as Hoovers, Bloomberg, Chemical Weekly, Factiva, and various other government and private websites. The vendor offerings have also been taken into consideration to determine the market segmentation. After arriving at the overall market size, the total market was split into several segments and subsegments, which were later verified through primary research by conducting extensive interviews with key personnel, such as CEOs, VPs, directors, and executives. Data triangulation and market breakdown procedures were employed to complete the overall market engineering process and arrive at the exact statistics for all segments and subsegments of the market. The breakdown of profiles of primaries is depicted in the figure below.
To know about the assumptions considered for the study, download the pdf brochure
Key Phosphate Ester Market Players
The phosphate esters market has a diversified ecosystem of upstream players, including raw material suppliers, along with downstream stakeholders, vendors, end users, and government organizations. Companies operating in the phosphate ester market include Lanxess AG (Germany), Elementis plc (UK), Akzo Nobel N.V. (Netherlands), Solvay S.A. (Belgium), Exxon Mobil Corporation (US), Ashland Inc. (US), and Stepan Company (US), among others.
Target Audience in Phosphate Ester Market
- Manufacturers, Dealers, and Suppliers of Phosphate Esters
- Government and Research Organizations
- End Users
- Companies Operational in Material R&D
- Associations and Industrial Bodies
- Investment Banks
- Consulting Companies/Consultants in Chemical and Material Sectors
- Industry Associations
“This study answers several questions for the stakeholders, primarily the market segments which they need to focus upon during the next two to five years so that they may prioritize their efforts and investments accordingly”.
Phosphate Ester Market Report Scope
This research report categorizes the phosphate esters market based on type, application, and region, forecasting revenues as well as analyzing trends in each of the submarkets.
On the basis of Type:
- Triaryl Phosphate Esters
- Trialkyl Phosphate Esters
- Alkyl Aryl Phosphate Esters
- Others
On the basis of Application:
- Lubricants
- Fire Retardants
- Surfactants
- Hydraulic Fluids
- Paints & Coating
- Plasticizers
- Pesticides
- Others
On the basis of Region:
- Asia Pacific
- North America
- Europe
- Middle East & Africa
- South America
The following customization options are available for the report:
Along with the given market data, MarketsandMarkets offers customizations as per the company’s specific needs. The following customization options are available for the report:
Phosphate Ester Market Product Analysis
- Product matrix, which gives a detailed comparison of the product portfolio of each company
Phosphate Ester Market Geographic Analysis
- Further breakdown of the rest of Asia-Pacific, rest of Middle East & Africa, rest of Europe, and rest of South America phosphate esters markets
Phosphate Ester Market Company Information
- Detailed analysis and profiling of additional market players (up to five companies)
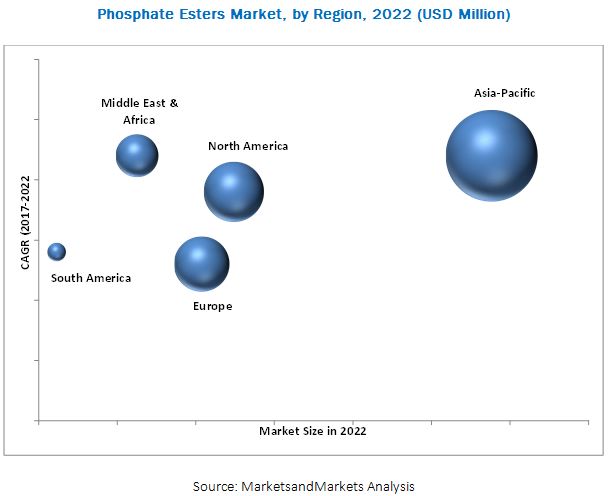
The phosphate esters market is estimated to be USD 843.9 Million in 2017 and is projected to reach USD 1,179.8 Million by 2022, at a CAGR of 6.9% from 2017 to 2022. The growth of the phosphate ester market is primarily driven by the increasing demand from the Asia Pacific and Middle East & Africa regions and the increased use of non-halogenated phosphorus esters in various applications, such as lubricants, paints & coatings, and surfactants, among others.
The triaryl phosphate esters segment is estimated to be the largest type segment of the phosphate esters market in 2017. Triaryl phosphate esters are widely used as fire retardants and hydraulic fluids owing to their self-extinguishing properties. Asia-Pacific and North America are the major markets for triaryl phosphate esters, in terms of value and volume.
The plasticizers application segment is projected to be the fastest-growing segment during the forecast period from 2017 to 2022. Phosphate esters are typically used as plasticizers with various polymers, such as chloride, thermoplastic polyurethane, and polyurethane foams, as they offer good gelling behavior and low-temperature performance. They offer good fire retardant and self-extinguishing properties, which are useful in various applications to improve the behavior of plasticized polymers. Triaryl phosphates (such as triphenyl phosphate) are most commonly used plasticizers.
Asia Pacific is expected to be the fastest-growing market for phosphate esters during the forecast period, owing to the presence of high growth economies in the region. Emerging countries, such as China and India are the world’s major producers and consumers of phosphate esters.
Key Players in Phosphate Ester Market Industry
Phosphate esters are more environment-friendly as compared to other fire retardants but are priced higher than these retardants. Any low-cost substitute will pose a threat to the phosphate esters market during the forecast period. Key players operating in the phosphate ester market include Lanxess AG (Germany), Elementis plc (UK), Akzo Nobel N.V. (Netherlands), Solvay S.A. (Belgium), Exxon Mobil Corporation (US), Ashland Inc. (US), and Stepan Company (US), among others. These companies are focusing on investing in plant capacity expansions to achieve growth in the market.
To speak to our analyst for a discussion on the above findings, click Speak to Analyst
 Exclusive indicates content/data unique to MarketsandMarkets and not available with any competitors.
Table of Contents
1 Introduction (Page No. - 18)
1.1 Objectives of the Study
1.2 Market Definition
1.3 Scope of the Study
1.3.1 Years Considered for the Study
1.4 Currency
1.5 Stakeholders
1.6 Package Size
2 Research Methodology (Page No. - 22)
2.1 Research Data
2.1.1 Secondary Data
2.1.1.1 Key Data From Secondary Sources
2.1.2 Primary Data
2.1.2.1 Key Data From Primary Sources
2.1.2.2 Key Industry Insights
2.1.2.3 Breakdown of Primary Interviews
2.2 Market Size Estimation
2.2.1 Bottom-Up Approach
2.2.2 Top-Down Approach
2.3 Data Triangulation
2.4 Research Assumptions
2.5 Limitations
3 Executive Summary (Page No. - 30)
4 Premium Insights (Page No. - 35)
4.1 Attractive Opportunities in the Phosphate Esters Market
4.2 Phosphate Ester Market, By Region
4.3 Phosphate Esters Market Share, By Application and Region
4.4 Phosphate Ester Market, Developed & Emerging Nations
4.5 Phosphate Esters Market, By Type
5 Market Overview (Page No. - 40)
5.1 Introduction
5.2 Regulations Related to Usage of Phosphate Esters in Various Applications
5.3 Market Dynamics
5.3.1 Drivers
5.3.1.1 Increasing Emphasis on Safety
5.3.1.2 Growing End-Use Industries
5.3.2 Opportunities
5.3.2.1 Manufacturing of Environment-Friendly Products
5.3.2.2 Growing Demand for Non-Halogenated Flame Retardants
5.3.3 Challenges
5.3.3.1 Production of Cost-Effective Fire Retardants
5.3.3.2 Increasing Prices of Raw Materials
5.4 Porter’s Five Forces Analysis
5.4.1 Threat of New Entrants
5.4.2 Threat of Substitutes
5.4.3 Bargaining Power of Suppliers
5.4.4 Bargaining Power of Buyers
5.4.5 Intensity of Competitive Rivalry
5.5 Industry Outlook
5.5.1 Lubricants
6 Phosphate Esters Market, By Type (Page No. - 48)
6.1 Introduction
6.2 Triaryl Phosphate Esters
6.3 Alkyl Aryl Phosphate Esters
6.4 Trialkyl Phosphate Esters
6.5 Others
7 Phosphate Esters Market, By Application (Page No. - 57)
7.1 Introduction
7.2 Lubricants
7.3 Fire Retardants
7.4 Surfactants
7.5 Hydraulic Fluids
7.6 Paints & Coatings
7.7 Plasticizers
7.8 Pesticides
7.9 Others
8 Phosphate Ester Market, By Region (Page No. - 72)
8.1 Introduction
8.2 Asia Pacific
8.2.1 China
8.2.2 India
8.2.3 Japan
8.2.4 South Korea
8.2.5 Taiwan
8.2.6 Indonesia
8.2.7 Australia & New Zealand
8.2.8 Rest of Asia Pacific
8.3 North America
8.3.1 US
8.3.2 Canada
8.3.3 Mexico
8.4 Europe
8.4.1 Germany
8.4.2 France
8.4.3 UK
8.4.4 Italy
8.4.5 Russia
8.4.6 Poland
8.4.7 Spain
8.4.8 Rest of Europe
8.5 Middle East & Africa
8.5.1 Saudi Arabia
8.5.2 UAE
8.5.3 Jordan
8.5.4 Rest of Middle East & Africa
8.6 South America
8.6.1 Brazil
8.6.2 Chile
8.6.3 Rest of South America
9 Competitive Landscape (Page No. - 135)
9.1 Introduction
9.2 Competitive Leadership Mapping, 2016
9.2.1 Visionary Leaders
9.2.2 Innovators
9.2.3 Dynamic Differentiators
9.2.4 Emerging Companies
9.3 Competitive Benchmarking
9.3.1 Strength of Product Portfolio
9.3.2 Business Strategy Excellence
9.4 Market Ranking Analysis
10 Company Profiles (Page No. - 140)
(Business Overview, Products Offered, Scorecard of Product Offering, Scorecard of Business Strategy, and New Product Launch)
10.1 Lanxess AG
10.2 Akzo Nobel N.V.
10.3 Elementis PLC
10.4 Solvay S.A.
10.5 Exxon Mobil Corporation
10.6 Eastman Chemical Company
10.7 Ashland Inc.
10.8 Castrol Limited
10.9 Stepan Company
10.10 DOW Chemical Company
10.11 Croda International PLC
10.12 Israel Chemicals Ltd.
10.13 BASF SE
10.14 Custom Synthesis, LLC
10.15 Colonial Chemical, Inc.
10.16 Other Companies
10.16.1 Lakeland Laboratories Limited
10.16.2 Tina Organics (P) Ltd.
10.16.3 Clariant
10.16.4 Kao Corporation
10.16.5 Valtris Specialty Chemicals, Inc.
10.16.6 Libra Specialty Chemicals Limited
10.16.7 Gujarat Chemicals
10.16.8 Zhangjiagang Fortune Chemical Co., Ltd.
10.16.9 Islechem LLC
10.16.10 Ethox Chemicals
*Details Might Not Be Captured in Case of Unlisted Companies
11 Appendix (Page No. - 193)
11.1 Discussion Guides
11.2 Knowledge Store: Marketsandmarkets Subscription Portal
11.3 Introducing RT: Real-Time Market Intelligence
11.4 Available Customizations
11.5 Related Reports
11.6 Author Details
List of Tables (165 Tables)
Table 1 Asia Pacific Phosphate Esters Market to Witness High Growth Between 2017 and 2022
Table 2 Lubricants Consumption, By Country, 2014–2021 (KT)
Table 3 Phosphate Ester Market, By Type, 2015–2022 (USD Million)
Table 4 Phosphate Esters Market, By Type, 2015–2022 (Kilotons)
Table 5 Triaryl Phosphate Ester Market, By Region, 2015–2022 (USD Million)
Table 6 Triaryl Phosphate Esters Market, By Region, 2015–2022 (Kilotons)
Table 7 Alkyl Aryl Phosphate Ester Market, By Region, 2015–2022 (USD Million)
Table 8 Alkyl Aryl Phosphate Esters Market, By Region, 2015–2022 (Kilotons)
Table 9 Trialkyl Phosphate Ester Market, By Region, 2015–2022 (USD Million)
Table 10 Trialkyl Phosphate Esters Market, By Region, 2015–2022 (Kilotons)
Table 11 Other Phosphate Ester Market, By Region, 2015–2022 (USD Million)
Table 12 Other Phosphate Esters Market, By Region, 2015–2022 (Kilotons)
Table 13 Phosphate Ester Market Size, By Application, 2015-2022 (USD Million)
Table 14 Phosphate Esters Market Size, By Application, 2015-2022 (Kilotons)
Table 15 Phosphate Ester Market in Lubricants, By Region, 2015–2022 (USD Million)
Table 16 Phosphate Esters Market in Lubricants, By Region, 2015–2022 (Kilotons)
Table 17 Phosphate Ester Market in Fire Retardants, By Region, 2015–2022 (USD Million)
Table 18 Phosphate Esters Market in Fire Retardants, By Region, 2015–2022 (Kilotons)
Table 19 Phosphate Ester Market in Surfactants, By Region, 2015–2022 (USD Million)
Table 20 Phosphate Esters Market in Surfactants, By Region, 2015–2022 (Kilotons)
Table 21 Phosphate Ester Market in Hydraulic Fluids, By Region, 2015–2022 (USD Million)
Table 22 Phosphate Esters Market in Hydraulic Fluids, By Region, 2015–2022 (Kilotons)
Table 23 Phosphate Ester Market in Paints & Coatings, By Region, 2015–2022 (USD Million)
Table 24 Phosphate Esters Market in Paints & Coatings, By Region, 2015–2022 (Kilotons)
Table 25 Phosphate Ester Market in Plasticizers, By Region, 2015–2022 (USD Million)
Table 26 Phosphate Esters Market in Plasticizers, By Region, 2015–2022 (Kilotons)
Table 27 Phosphate Ester Market in Pesticides, By Region, 2015–2022 (USD Million)
Table 28 Phosphate Esters Market in Pesticides, By Region, 2015–2022 (Kilotons)
Table 29 Phosphate Ester Market in Others, By Region, 2015–2022 (USD Million)
Table 30 Phosphate Esters Market in Others, By Region, 2015–2022 (USD Million)
Table 31 Phosphate Ester Market, By Region, 2015–2022 (USD Million)
Table 32 Phosphate Esters Market, By Region, 2015–2022 (Kilotons)
Table 33 Asia Pacific Phosphate Ester Market, By Country, 2015–2022 (USD Million)
Table 34 Asia Pacific Market, By Country, 2015–2022 (Kilotons)
Table 35 Asia Pacific Market, By Application, 2015–2022 (USD Million)
Table 36 Asia Pacific Market, By Application, 2015–2022 (Kilotons)
Table 37 Asia Pacific Market, By Type, 2015–2022 (USD Million)
Table 38 Asia Pacific Market, By Type, 2015–2022 (Kilotons)
Table 39 China Phosphate Esters Market, By Application, 2015–2022 (USD Million)
Table 40 China Market, By Application, 2015–2022 (Kilotons)
Table 41 China Market, By Type, 2015–2022 (USD Million)
Table 42 China Market, By Type, 2015–2022 (Kilotons)
Table 43 India Phosphate Ester Market, By Application, 2015–2022 (USD Million)
Table 44 India Market, By Application, 2015–2022 (Kilotons)
Table 45 India Market, By Type, 2015–2022 (USD Million)
Table 46 India Market, By Type, 2015–2022 (Kilotons)
Table 47 Japan Phosphate Esters Market, By Application, 2015–2022 (USD Million)
Table 48 Japan Market, By Application, 2015–2022 (Kilotons)
Table 49 Japan Market, By Type, 2015–2022 (USD Million)
Table 50 Japan Market, By Type, 2015–2022 (Kilotons)
Table 51 South Korea Phosphate Ester Market, By Application, 2015–2022 (USD Million)
Table 52 South Korea Market, By Application, 2015–2022 (Kilotons)
Table 53 South Korea Market, By Type, 2015–2022 (USD Million)
Table 54 South Korea Market, By Type, 2015–2022 (Kilotons)
Table 55 Taiwan Phosphate Esters Market, By Application, 2015–2022 (USD Million)
Table 56 Taiwan Market, By Application, 2015–2022 (Kilotons)
Table 57 Taiwan Market, By Type, 2015–2022 (USD Million)
Table 58 Taiwan Market, By Type, 2015–2022 (Kilotons)
Table 59 Indonesia Phosphate Ester Market, By Application, 2015–2022 (USD Million)
Table 60 Indonesia Market, By Type, 2015–2022 (USD Million)
Table 61 Indonesia Market, By Type, 2015–2022 (Kilotons)
Table 62 Australia & New Zealand Phosphate Esters Market, By Application, 2015–2022 (USD Million)
Table 63 Australia & New Zealand Market, By Application, 2015–2022 (Kilotons)
Table 64 Australia & New Zealand Market, By Type, 2015–2022 (USD Million)
Table 65 Australia & New Zealand Market, By Type, 2015–2022 (Kilotons)
Table 66 Rest of Asia Pacific Phosphate Ester Market, By Application, 2015–2022 (USD Million)
Table 67 Rest of Asia Pacific Market, By Application, 2015–2022 (Kilotons)
Table 68 Rest of Asia Pacific Market, By Type, 2015–2022 (USD Million)
Table 69 Rest of Asia Pacific Market, By Type, 2015–2022 (Kilotons)
Table 70 North America Phosphate Esters Market, By Country, 2015–2022 (USD Million)
Table 71 North America Market, By Country, 2015–2022 (Kilotons)
Table 72 North America Market, By Application, 2015–2022 (USD Million)
Table 73 North America Market, By Application, 2015–2022 (Kilotons)
Table 74 North America Market, By Type, 2015–2022 (USD Million)
Table 75 North America Market, By Type, 2015–2022 (Kilotons)
Table 76 US Phosphate Ester Market, By Application, 2015–2022 (USD Million)
Table 77 US Market, By Application, 2015–2022 (Kilotons)
Table 78 US Market, By Type, 2015–2022 (USD Million)
Table 79 US Market, By Type, 2015–2022 (Kilotons)
Table 80 Canada Phosphate Esters Market, By Application, 2015–2022 (USD Million)
Table 81 Canada Market, By Application, 2015–2022 (Kilotons)
Table 82 Canada Market, By Type, 2015–2022 (USD Million)
Table 83 Canada Market, By Type, 2015–2022 (Kilotons)
Table 84 Mexico Phosphate Ester Market, By Application, 2015–2022 (USD Million)
Table 85 Mexico Market, By Application, 2015–2022 (Kilotons)
Table 86 Mexico Market, By Type, 2015–2022 (USD Million)
Table 87 Mexico Market, By Type, 2015–2022 (Kilotons)
Table 88 Europe Phosphate Esters Market, By Country, 2015–2022 (USD Million)
Table 89 Europe Market, By Country, 2015–2022 (Kilotons)
Table 90 Europe Market, By Application, 2015–2022 (USD Million)
Table 91 Europe Market, By Application, 2015–2022 (Kilotons)
Table 92 Europe Market, By Type, 2015–2022 (USD Million)
Table 93 Europe Market, By Type, 2015–2022 (Kilotons)
Table 94 Germany Phosphate Ester Market, By Application, 2015–2022 (USD Million)
Table 95 Germany Market, By Application, 2015–2022 (Kilotons)
Table 96 Germany Market, By Type, 2015–2022 (USD Million)
Table 97 Germany Market, By Type, 2015–2022 (Kilotons)
Table 98 France Phosphate Esters Market, By Application, 2015–2022 (USD Million)
Table 99 France Market, By Application, 2015–2022 (Kilotons)
Table 100 France Market, By Type, 2015–2022 (USD Million)
Table 101 France Market, By Type, 2015–2022 (Kilotons)
Table 102 UK Phosphate Ester Market, By Application, 2015–2022 (USD Million)
Table 103 UK Market, By Application, 2015–2022 (Kilotons)
Table 104 UK Market, By Type, 2015–2022 (USD Million)
Table 105 UK Market, By Type, 2015–2022 (Kilotons)
Table 106 Italy Phosphate Esters Market, By Application, 2015–2022 (USD Million)
Table 107 Italy Market, By Application, 2015–2022 (Kilotons)
Table 108 Italy Market, By Type, 2015–2022 (USD Million)
Table 109 Italy Market, By Type, 2015–2022 (Kilotons)
Table 110 Russia Phosphate Ester Market, By Application, 2015–2022 (USD Million)
Table 111 Russia Market, By Application, 2015–2022 (Kilotons)
Table 112 Russia Market, By Type, 2015–2022 (USD Million)
Table 113 Russia Market, By Type, 2015–2022 (Kilotons)
Table 114 Poland Phosphate Esters Market, By Application, 2015–2022 (USD Million)
Table 115 Poland Market, By Application, 2015–2022 (Kilotons)
Table 116 Poland Market, By Type, 2015–2022 (USD Million)
Table 117 Poland Market, By Type, 2015–2022 (Kilotons)
Table 118 Spain Phosphate Ester Market, By Application, 2015–2022 (USD Million)
Table 119 Spain Market, By Application, 2015–2022 (Kilotons)
Table 120 Spain Market, By Type, 2015–2022 (USD Million)
Table 121 Spain Market, By Type, 2015–2022 (Kilotons)
Table 122 Rest of Europe Phosphate Esters Market, By Application, 2015–2022 (USD Million)
Table 123 Rest of Europe Market, By Application, 2015–2022 (Kilotons)
Table 124 Rest of Europe Market, By Type, 2015–2022 (USD Million)
Table 125 Rest of Europe Market, By Type, 2015–2022 (Kilotons)
Table 126 Middle East & Africa Phosphate Ester Market, By Country, 2015–2022 (USD Million)
Table 127 Middle East & Africa Market, By Country, 2015–2022 (Kilotons)
Table 128 Middle East & Africa Market, By Application, 2015–2022 (USD Million)
Table 129 Middle East & Africa Market, By Application, 2015–2022 (Kilotons)
Table 130 Middle East & Africa Market, By Type, 2015–2022 (USD Million)
Table 131 Middle East & Africa Market, By Type, 2015–2022 (Kilotons)
Table 132 Saudi Arabia Phosphate Esters Market, By Application, 2015–2022 (USD Million)
Table 133 Saudi Arabia Market, By Application, 2015–2022 (Kilotons)
Table 134 Saudi Arabia Market, By Type, 2015–2022 (USD Million)
Table 135 Saudi Arabia Market, By Type, 2015–2022 (Kilotons)
Table 136 UAE Phosphate Ester Market, By Application, 2015–2022 (USD Million)
Table 137 UAE Market, By Application, 2015–2022 (Kilotons)
Table 138 UAE Market, By Type, 2015–2022 (USD Million)
Table 139 UAE Market, By Type, 2015–2022 (Kilotons)
Table 140 Jordan Phosphate Esters Market, By Application, 2015–2022 (USD Million)
Table 141 Jordan Market, By Application, 2015–2022 (Kilotons)
Table 142 Jordan Market, By Type, 2015–2022 (USD Million)
Table 143 Jordan Market, By Type, 2015–2022 (Kilotons)
Table 144 Rest of Middle East & Africa Phosphate Ester Market, By Application, 2015–2022 (USD Million)
Table 145 Rest of Middle East & Africa Market, By Application, 2015–2022 (Kilotons)
Table 146 Rest of Middle East & Africa Market, By Type, 2015–2022 (USD Million)
Table 147 Rest of Middle East & Africa Market, By Type, 2015–2022 (Kilotons)
Table 148 South America Phosphate Esters Market, By Country, 2015–2022 (USD Million)
Table 149 South America Market, By Country, 2015–2022 (Kilotons)
Table 150 South America Market, By Application, 2015–2022 (USD Million)
Table 151 South America Market, By Application, 2015–2022 (Kilotons)
Table 152 South America Market, By Type, 2015–2022 (USD Million)
Table 153 South America Market, By Type, 2015–2022 (Kilotons)
Table 154 Brazil Phosphate Ester Market, By Application, 2015–2022 (USD Million)
Table 155 Brazil Market, By Application, 2015–2022 (Kilotons)
Table 156 Brazil Market, By Type, 2015–2022 (USD Million)
Table 157 Brazil Market, By Type, 2015–2022 (Kilotons)
Table 158 Chile Phosphate Esters Market, By Application, 2015–2022 (USD Million)
Table 159 Chile Market, By Application, 2015–2022 (Kilotons)
Table 160 Chile Market, By Type, 2015–2022 (USD Million)
Table 161 Chile Market, By Type, 2015–2022 (Kilotons)
Table 162 Rest of South America Phosphate Ester Market, By Application, 2015–2022 (USD Million)
Table 163 Rest of South America Market, By Application, 2015–2022 (Kilotons)
Table 164 Rest of South America Market, By Type, 2015–2022 (USD Million)
Table 165 Rest of South America Market, By Type, 2015–2022 (Kilotons)
List of Figures (50 Figures)
Figure 1 Phosphate Esters Market Segmentation
Figure 2 Phosphate Ester Market: Research Design
Figure 3 Market Size Estimation: Bottom-Up Approach
Figure 4 Market Size Estimation: Top-Down Approach
Figure 5 Phosphate Esters Market: Data Triangulation
Figure 6 Lubricants Segment Projected to Lead the Phosphate Ester Market From 2017 to 2022
Figure 7 Triaryl Phosphate Esters Expected to Be the Largest Type Segment of the Phosphate Esters Market From 2017 to 2022
Figure 8 Asia Pacific Estimated to Lead the Phosphate Ester Market in 2017
Figure 9 Growth in the Lubricants Industry to Drive the Phosphate Esters Market Between 2017 and 2022
Figure 10 Asia Pacific is Projected to Be the Largest Market for Phosphate Esters By 2022
Figure 11 Lubricants Segment Estimated to Account for the Largest Market Share in 2017
Figure 12 Phosphate Esters Market in China Expected to Grow at the Highest CAGR During the Forecast Period
Figure 13 Triaryl Phosphate Ester Segment to Be the Largest Type Across All Regions in 2017
Figure 14 Drivers, Opportunities, and Challenges for the Phosphate Ester Market
Figure 15 Porter’s Five Forces Analysis
Figure 16 Asia Pacific Dominated the Lubricants Market in 2016
Figure 17 Triaryl Phosphate Esters Segment is Expected to Be the Largest Type Segment of the Phosphate Esters Market During the Forecast Period
Figure 18 Asia Pacific Projected to Be the Largest Market for Triaryl Phosphate Esters During the Forecast Period
Figure 19 Middle East & Africa Expected to Witness Highest Growth in the Alkyl Aryl Phosphate Ester Market During the Forecast Period
Figure 20 Asia Pacific Projected to Be the Largest Market for Trialkyl Phosphate Esters During the Forecast Period
Figure 21 Asia Pacific Expected to Be the Largest Market for Other Phosphate Esters During the Forecast Period
Figure 22 Lubricants Segment Expected to Be the Largest Application Segment of the Market During the Forecast Period
Figure 23 Asia Pacific Expected to Be the Largest Market in the Lubricants Application Segment During the Forecast Period
Figure 24 Asia Pacific to Be the Fastest-Growing Market for Phosphate Esters in the Fire Retardants Application Segment During the Forecast Period
Figure 25 Asia Pacific to Be the Fastest-Growing Market for Phosphate Esters in the Surfactants Application Segment
Figure 26 Middle East & Africa the Fastest-Growing Market for Phosphate Esters in the Hydraulic Fluids Application Segment During the Forecast Period
Figure 27 Asia Pacific Expected to Be the Largest Market for Phosphate Esters in the Paints & Coatings Application Segment During the Forecast Period
Figure 28 Asia Pacific to Lead the Phosphate Esters Market in the Plasticizers Segment During the Forecast Period
Figure 29 Asia Pacific is the Largest Market for Phosphate Esters in the Pesticides Segment During the Forecast Period
Figure 30 Asia Pacific to Dominate the Other Applications Segment of the Phosphate Ester Market During the Forecast Period
Figure 31 Regional Snapshot: China Emerging as A Lucrative Market for Phosphate Esters
Figure 32 Asia Pacific Phosphate Esters Market Snapshot
Figure 33 North America Phosphate Ester Market Snapshot
Figure 34 Europe Phosphate Esters Market Snapshot
Figure 35 Middle East & Africa Phosphate Ester Market Snapshot
Figure 36 South America Phosphate Esters Market Snapshot
Figure 37 Competitive Leadership Mapping
Figure 38 Phosphate Ester Market Ranking, By Key Companies, 2016
Figure 39 Lanxess AG : Company Snapshot
Figure 40 Akzo Nobel N.V.: Company Snapshot
Figure 41 Elementis PLC: Company Snapshot
Figure 42 Solvay S.A.: Company Snapshot
Figure 43 Exxon Mobil Corporation: Company Snapshot
Figure 44 Eastman Chemical Company: Company Snapshot
Figure 45 Ashland Inc.: Company Snapshot
Figure 46 Stepan Company: Company Snapshot
Figure 47 DOW Chemical Company: Company Snapshot
Figure 48 Croda International PLC: Company Snapshot
Figure 49 Israel Chemicals Ltd.: Company Snapshot
Figure 50 BASF SE: Company Snapshot


Growth opportunities and latent adjacency in Phosphate Ester Market
Detailed information on the other industrial applications of Phosphate esters
Phosphate esters market dynamics, drivers and opportunities