Perovskite Solar Cell Market Size, Share & Growth

Perovskite Solar Cell Market Size, Share, Trends & Industry Analysis by Type of Structure (Planar and Mesoporous), Product (Rigid and Flexible), Vertical (Aerospace & Defense, Residential, Commercial, Industrial, and Utility), Type, Application, Technology and Region – Global Forecast to 2028

Report Code: SE 8525 Dec, 2022, by marketsandmarkets.com

Updated on : October 22, 2024

The global perovskite solar cell market size is projected to grow from USD 271 million in 2024 to USD 2,268 million by 2028; growing at a CAGR of 70.1% from 2024 to 2028. The major growth opportunity for the perovskite solar cell market during the forecast period is the upsurge in the demand for renewable energy.
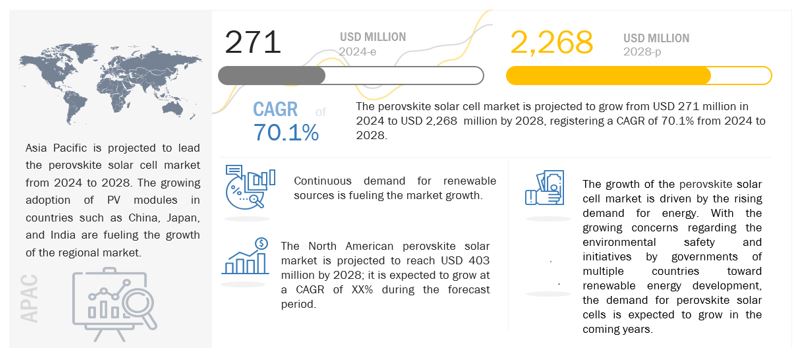
Perovskite Solar Cell Market

Perovskite Solar Cell Market Forecast to 2028

To know about the assumptions considered for the study, Request for Free Sample Report

Perovskite Solar Cell Market Dynamics

Driver : Various advantages of perovskite solar cells over traditional solar cells

Perovskite solar cells have competitive power conversion efficiencies (PCE) with the potential for higher performance than traditional solar cells. Perovskite solar cells can convert sunlight into electricity even if the sunlight is indoor, outdoor, or if the light is artificial. A few of the benefits of perovskite solar cells are that the cells are much cheaper to fabricate than traditional solar cells and thinner. Perovskite solar cells offer better efficiency in low and variable lights and have better spectral absorption.

Restraint: Presence of toxic substances in perovskite solar cells

Perovskites have a crystal structure like the perovskite mineral, which consists of calcium titanium oxide (CaTiO3). When the perovskite cell breaks down, it produces toxic substances called Pbl, which affects the human respiratory system. This substance also contains lead, which can affect the environment by contaminating air, water, and soil. The harmful effects of perovskite solar cells, hence, act as a restraint for market growth.

Opportunity : Rising investments and funding in development of perovskite solar cells

The solar industry has witnessed various fast-paced technological developments in the past few years. Perovskite is the newest solar material with a crystal structure suitable for solar absorption. Perovskite cells also work better than silicon at lower lighting intensities, on cloudy days, or indoors, thus enabling higher conversion efficiency. The main benefit of making solar cells from perovskite is that the material is cheap and abundant and can produce low-cost solar power. As perovskite solar cells have benefits over traditional cells, companies in the solar cell industry are working to develop the cell and make it commercially available by 2024. The companies working on developing perovskite solar cells are raising funds for research and innovations. For instance, in January 2021, Microquanta Semiconductor announced a Series C round of funding. Lead investors include Three George Capitals, Beijing Energy Holding, and Quzhou Financial Holding. This funding will be used for the 100 MW production line expansion of the perovskite tandem project. Similarly, in November 2020, Oxford PV was funded by the Brandenburg Ministry of Economics as part of the EU’s Regional Development Program.  The grant was used in perovskite solar cell manufacturing. Continuous funding for research and development of perovskite solar cells is creating growth opportunities for the market players.

Challenge: Stability and efficiency of perovskite solar cell

Perovskites can decompose when they react with moisture and oxygen or when they spend extended time exposed to light, heat, or applied voltage. The perovskite research and development (R&D) community is highly focused on improving operational lifetime and is working on multiple approaches to understand and improve stability and degradation. The research is going to decrease the reactivity of the perovskite surface, and finding alternative materials for formulations of perovskite materials.

Residential vertical to account for the highest CAGR in the perovskite solar cell market by 2028

The perovskite solar cell industry for the residential vertical is expected to register the highest CAGR during the forecast period. In the residential vertical, perovskite solar cell-based PV systems are expected to be installed on the rooftop or at locations where adequate sunlight is available to fulfill the home electricity needs.

Solar panel segment to account for the largest market share by 2028

Solar panels help in generating electricity from solar energy. The solar panel works so that when photons present in the light hits the solar cell, it loses the electrons from its atoms. Proper attachment of conductors on the positive and negative sides of a cell can transform the whole into an electrical circuit. Electrons flowing through the circuit help in generating electricity. Currently, solar panels are mostly made up of silicon material. Constant research and development projects have been set up worldwide on perovskite solar cells to check the material’s performance, efficiency, and operational life. Perovskite solar cells are expected to be commercialized by 2024.

Asia Pacific to grow at the highest CAGR in the perovskite solar cell market during the forecast period

The perovskite solar cell market in Asia Pacific is projected to grow at the highest CAGR from 2024 to 2028. The global market players are experiencing increased demand for solar cells from countries such as China, Japan, India, and South Korea. India and China are the major contributors to the growth of the regional market due to the expanding solar cell market in the countries.
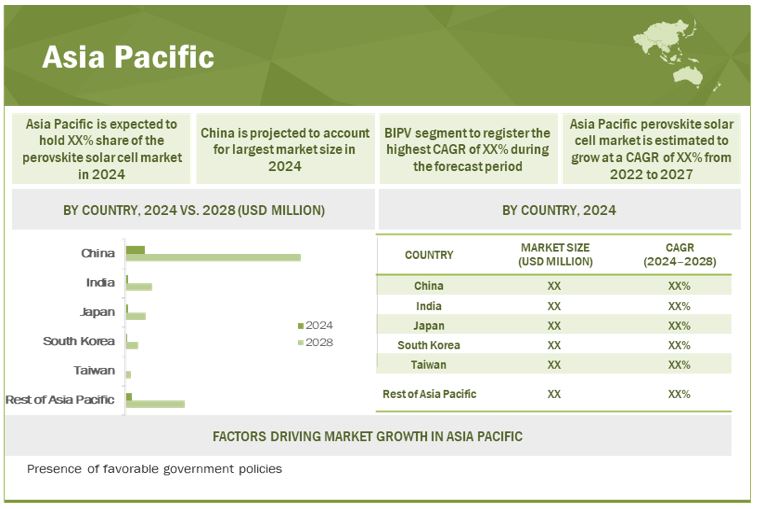
Perovskite Solar Cell Market Size, and Share

To know about the assumptions considered for the study, download the pdf brochure

Top Perovskite Solar Cell Companies - Key Market Players:

 Hanwha Q CELLS (South Korea), Microquanta Semiconductor (China), Greatcell Energy (Australia), Oxford PV (UK), Saule Technologies (Poland), CubicPV (US), EneCoat Technologies (Japan), P3C (India), and PEROVSKIA SOLAR AG (Switzerland) are the key players operating in the perovskite solar cell companies.

Perovskite Solar Cell Market Report Scope : 

Report Metric

Details

Estimated Market Size USD 271 Million
Projected Market Size USD 2,268 Million
Growth Rate At a CAGR of 70.1%

Market Size Available for Years

2024–2028

Estimated Year

2024

Forecast Period

2024–2028

Forecast Units

USD Million

Segments Covered

  • By Type of Structure,
  • By Type, Product,
  • By Application,
  • By Vertical,
  • By Technology, and
  • By Region

Regions Covered

  • North America,
  • Asia Pacific,
  • Europe, and
  • RoW

Companies Covered

Hanwha Q CELLS (South Korea), CubicPV (US), EneCoat Technologies (Japan), Microquanta Semiconductor (China), Greatcell Energy (Australia), Oxford PV (UK), P3C (India), PEROVSKIA SOLAR AG (Switzerland), and Saule Technologies (Poland) are among the key players operating in the perovskite solar cell market.

Key Market Driver Various advantages of perovskite solar cells over traditional solar cells
Key Market Opportunity  Rising investments and funding in development of perovskite solar cells
Largest Growing Region Asia Pacific 
Largest Market Share Segment Solar panel
Highest CAGR Segment Residential vertical 

Perovskite Solar Cell Market Highlights

This research report categorizes the perovskite solar cell market based on Type of Structure, Type,  Product, Application, Vertical, Technology, and Region   

Report Metric

Details

By Type Of Structure

  • Planar Perovskite Solar Cell
  • Mesoporous Solar Cell - Better Efficiency

By Type

  • Hybrid Perovskite Solar Cell
  • Multi-Junction Perovskite Solar Cell - Better Efficiency

By Product

  • Rigid Perovskite Solar Cell - Better Efficiency
  • Flexible Perovskite Solar Cell

By Vertical 

  • Aerospace & Defense
  • Industrial
  • Commercial
  • Residential
  • Utility

By Application 

  • Smart Glass
  •  Solar Panel
  • Building-integrated Photovoltaics (BIPV)
  • Others

By Technology

  • One-step Method
  • Two-step Method
  •  Vapor-assisted Solution Method
  • Thermal Vapor Deposition Method

By Region

  • North America
  • Europe
  • Asia Pacific
  • RoW

Recent Developments In Perovskite Solar Cell Industry

  • In February 2022, Microquanta Semiconductor announced that it is building a perovskite solar power plant in Quzhou in Zhejiang Province, China. The solar plant will cover 250 acres and has a capacity of 12 MW.
  • In July 2021, Oxford PV announced that it had completed the build-out of its manufacturing site in Brandenburg an der Havel, Germany. The site will be one of the world’s first volume manufacturing lines for Oxford PV’s innovative perovskite-on-silicon tandem solar cells. The annual target manufacturing capacity is 100 MW.

Critical questions answered by this report:

To speak to our analyst for a discussion on the above findings, click Speak to Analyst

Exclusive indicates content/data unique to MarketsandMarkets and not available with any competitors.

TABLE OF CONTENTS
 
1 INTRODUCTION (Page No. - 23)
    1.1 STUDY OBJECTIVE 
    1.2 MARKET DEFINITION 
    1.3 MARKET SCOPE 
           1.3.1 MARKETS COVERED
                    FIGURE 1 PEROVSKITE SOLAR CELL MARKET: SEGMENTATION
           1.3.2 INCLUSIONS AND EXCLUSIONS
           1.3.3 REGIONAL SCOPE
           1.3.4 YEARS CONSIDERED
    1.4 CURRENCY CONSIDERED 
    1.5 LIMITATIONS 
    1.6 STAKEHOLDERS 
 
2 RESEARCH METHODOLOGY (Page No. - 27)
    2.1 RESEARCH DATA 
           FIGURE 2 PEROVSKITE SOLAR CELL MARKET: PROCESS FLOW FOR MARKET SIZE ESTIMATION
           FIGURE 3 MARKET: RESEARCH DESIGN
           2.1.1 SECONDARY AND PRIMARY RESEARCH
           2.1.2 SECONDARY DATA
                    2.1.2.1 Secondary sources
                    2.1.2.2 List of key secondary sources
           2.1.3 PRIMARY DATA
                    2.1.3.1 Primary sources
                    2.1.3.2 Key industry insights
                    2.1.3.3 Primary interviews with experts
                    2.1.3.4 List of key primary respondents
                    2.1.3.5 Breakdown of primaries
    2.2 MARKET SIZE ESTIMATION 
           2.2.1 BOTTOM-UP APPROACH
                    2.2.1.1 Approach to derive market size using demand-side analysis
                               FIGURE 4 PEROVSKITE SOLAR CELL MARKET: BOTTOM-UP APPROACH
           2.2.2 TOP-DOWN APPROACH
                    2.2.2.1 Approach to derive market size using top-down analysis
                               FIGURE 5 MARKET: TOP-DOWN APPROACH
    2.3 MARKET BREAKDOWN AND DATA TRIANGULATION 
           FIGURE 6 DATA TRIANGULATION
    2.4 RESEARCH ASSUMPTIONS 
    2.5 RISK ASSESSMENT 
           TABLE 1 ANALYSIS OF RISK FACTORS
 
3 EXECUTIVE SUMMARY (Page No. - 38)
    FIGURE 7 PLANAR PEROVSKITE SOLAR CELL SEGMENT TO DOMINATE PEROVSKITE SOLAR CELL MARKET DURING FORECAST PERIOD
    FIGURE 8 FLEXIBLE PEROVSKITE SOLAR CELL SEGMENT TO REGISTER HIGHER CAGR DURING FORECAST PERIOD
    FIGURE 9 UTILITY SEGMENT TO ACCOUNT FOR LARGEST MARKET SIZE DURING FORECAST PERIOD
    FIGURE 10 BIPV SEGMENT TO REGISTER HIGHEST CAGR DURING FORECAST PERIOD
    FIGURE 11 ASIA PACIFIC TO HOLD LARGEST SHARE OF MARKET DURING FORECAST PERIOD
 
4 PREMIUM INSIGHTS (Page No. - 42)
    4.1 ATTRACTIVE OPPORTUNITIES FOR PLAYERS OPERATING IN MARKET 
           FIGURE 12 GROWING ADOPTION OF PV MODULES IN ASIA PACIFIC
    4.2 PEROVSKITE SOLAR CELL MARKET, BY STRUCTURE TYPE 
           FIGURE 13 PLANAR PEROVSKITE SOLAR CELL SEGMENT TO DOMINATE MARKET DURING FORECAST PERIOD
    4.3 MARKET, BY PRODUCT 
           FIGURE 14 FLEXIBLE PEROVSKITE SOLAR CELL SEGMENT TO REGISTER HIGHER CAGR DURING FORECAST PERIOD
    4.4 MARKET, BY VERTICAL 
           FIGURE 15 UTILITY SEGMENT TO HOLD LARGEST MARKET SHARE DURING FORECAST PERIOD
    4.5 MARKET, BY APPLICATION 
           FIGURE 16 BIPV SEGMENT TO REGISTER HIGHEST CAGR DURING FORECAST PERIOD
    4.6 MARKET, BY COUNTRY 
           FIGURE 17 INDIA TO REGISTER HIGHEST CAGR IN MARKET FROM 2024 TO 2028
 
5 MARKET OVERVIEW (Page No. - 45)
    5.1 INTRODUCTION 
    5.2 MARKET DYNAMICS 
           FIGURE 18 PEROVSKITE SOLAR CELL MARKET: DRIVERS, RESTRAINTS, OPPORTUNITIES, AND CHALLENGES
           5.2.1 DRIVERS
                    5.2.1.1 Advantages of perovskite solar cells over traditional solar cells
                    5.2.1.2 Supportive government policies and initiatives
                    5.2.1.3 Increasing demand for solar systems in residential vertical
                    5.2.1.4 Declining costs of solar systems and energy storage devices
                               FIGURE 19 MARKET : IMPACT ANALYSIS OF DRIVERS
           5.2.2 RESTRAINTS
                    5.2.2.1 Presence of toxic substances in perovskite solar cells
                               FIGURE 20 MARKET: IMPACT ANALYSIS OF RESTRAINTS
           5.2.3 OPPORTUNITIES
                    5.2.3.1 Surging demand for renewable energy
                               FIGURE 21 GLOBAL RENEWABLE ENERGY CAPACITY, 2012–2021 (GW)
                    5.2.3.2 Rising funding for development of perovskite solar cells
                               FIGURE 22 MARKET: IMPACT ANALYSIS OF OPPORTUNITIES
           5.2.4 CHALLENGES
                    5.2.4.1 Decomposition of perovskite solar cells when exposed to moisture and oxygen
                               FIGURE 23  MARKET: IMPACT ANALYSIS OF CHALLENGES
    5.3 PORTER’S FIVE FORCES ANALYSIS 
           TABLE 2 MARKET: PORTER’S FIVE FORCES ANALYSIS, 2021
           5.3.1 THREAT OF NEW ENTRANTS
           5.3.2 THREAT OF SUBSTITUTES
           5.3.3 BARGAINING POWER OF SUPPLIERS
           5.3.4 BARGAINING POWER OF BUYERS
           5.3.5 INTENSITY OF COMPETITIVE RIVALRY
    5.4 VALUE CHAIN ANALYSIS 
           FIGURE 24 PHOTOVOLTAICS (PV) VALUE CHAIN ANALYSIS
    5.5 PV MARKET: TECHNOLOGY ANALYSIS 
    5.6 PV MARKET: CASE STUDY ANALYSIS 
           5.6.1 SHOGO SUGIURA HOUSE INSTALLED TRINA SOLAR DUOMAX MODULES TO GENERATE POWER AND TRANSMIT LIGHT
           5.6.2 LONGI (CHINA) COLLABORATED WITH DATANG CORPORATION TO SUPPLY 100 MW OF ITS HI-MO4M MONOFACIAL PERC MODULES TO CHINA DATANG CORPORATION
    5.7 ECOSYSTEM ANALYSIS 
           FIGURE 25 MARKET : ECOSYSTEM ANALYSIS
    5.8 REGULATORY ANALYSIS 
    5.9 REVENUE SHIFT AND NEW REVENUE POCKETS FOR PLAYERS IN PV MARKET 
           FIGURE 26 REVENUE SHIFT FOR PEROVSKITE SOLAR CELL MARKET PLAYERS
    5.10 PATENT ANALYSIS 
           FIGURE 27 TOP 10 COMPANIES WITH HIGHEST NUMBER OF PATENT APPLICATIONS IN LAST 10 YEARS
           TABLE 3 TOP 10 PATENT OWNERS IN US IN LAST 10 YEARS
           FIGURE 28 NUMBER OF PATENTS GRANTED PER YEAR, 2012–2022
           TABLE 4 LIST OF PATENTS
    5.11 KEY CONFERENCES AND EVENTS, 2022–2023 
           TABLE 5 MARKET: CONFERENCES AND EVENTS
 
6 PEROVSKITE SOLAR CELL MARKET, BY STRUCTURE TYPE (Page No. - 61)
    6.1 INTRODUCTION 
           FIGURE 29 PEROVSKITE SOLAR CELL MARKET, BY STRUCTURE TYPE
           TABLE 6 MARKET, BY STRUCTURE TYPE, 2024–2028 (USD MILLION)
    6.2 PLANAR PEROVSKITE SOLAR CELL 
           6.2.1 SIMPLE STRUCTURE AND INCREASING EFFICIENCY OF PLANAR PEROVSKITE SOLAR CELLS
    6.3 MESOPOROUS PEROVSKITE SOLAR CELL 
           6.3.1 HIGH POWER CONVERSION EFFICIENCY (PCE) OF MESOPOROUS PEROVSKITE SOLAR CELLS IN OUTDOOR AND INDOOR ILLUMINATION CONDITIONS
 
7 PEROVSKITE SOLAR CELL MARKET, BY TYPE (Page No. - 64)
    7.1 INTRODUCTION 
           FIGURE 30 MARKET, BY TYPE
           TABLE 7 MARKET, BY TYPE, 2024–2028 (USD MILLION)
    7.2 SINGLE-JUNCTION PEROVSKITE SOLAR CELL 
           7.2.1 SINGLE-JUNCTION SOLAR CELL USES SINGLE SEMICONDUCTING MATERIAL TO FORM P-N JUNCTION
    7.3 MULTI-JUNCTION PEROVSKITE SOLAR CELL 
           7.3.1 MULTI-JUNCTION SOLAR CELL USES TWO OR MORE SEMICONDUCTING MATERIALS TO FORM P-N JUNCTION
 
8 PEROVSKITE SOLAR CELL MARKET, BY PRODUCT (Page No. - 67)
    8.1 INTRODUCTION 
           FIGURE 31 MARKET, BY PRODUCT
           TABLE 8 MARKET, BY PRODUCT, 2024–2028 (USD MILLION)
    8.2 RIGID PEROVSKITE SOLAR CELL 
           8.2.1 HIGHER EFFICIENCY OF RIGID PEROVSKITE SOLAR CELLS THAN FLEXIBLE PEROVSKITE SOLAR CELLS
    8.3 FLEXIBLE PEROVSKITE SOLAR CELL 
           8.3.1 INCREASING EFFICIENCY OF FLEXIBLE PEROVSKITE SOLAR CELLS WITH ONGOING RESEARCH AND DEVELOPMENT
 
9 PEROVSKITE SOLAR CELL MARKET, BY VERTICAL (Page No. - 70)
    9.1 INTRODUCTION 
           FIGURE 32 PEROVSKITE SOLAR CELL MARKET, BY VERTICAL
           FIGURE 33 RESIDENTIAL SEGMENT TO EXHIBIT HIGHEST CAGR IN MARKET DURING FORECAST PERIOD
           TABLE 9 MARKET, BY VERTICAL, 2024–2028 (USD MILLION)
    9.2 RESIDENTIAL 
           9.2.1 GROWING USE OF PEROVSKITE SOLAR CELLS TO POWER CONSUMER ELECTRONICS IN RESIDENTIAL BUILDINGS
                    TABLE 10 RESIDENTIAL: MARKET, BY REGION, 2024–2028 (USD MILLION)
                    TABLE 11 RESIDENTIAL: MARKET, BY APPLICATION, 2024–2028 (USD MILLION)
    9.3 COMMERCIAL 
           9.3.1 INCREASING INSTALLATION OF PEROVSKITE SOLAR CELL-BASED PV MODULES ON ROOFTOPS OF COMMERCIAL BUILDINGS FOR ILLUMINATION AND ELECTRICITY GENERATION
                    TABLE 12 COMMERCIAL: MARKET, BY REGION, 2024–2028 (USD MILLION)
                    TABLE 13 COMMERCIAL: PEROVSKITE SOLAR CELL MARKET, BY APPLICATION, 2024–2028 (USD MILLION)
    9.4 INDUSTRIAL 
           9.4.1 RISING APPLICATION OF PEROVSKITE SOLAR CELL-BASED PV MODULES IN INDUSTRIAL SECTOR
                    FIGURE 34 ASIA PACIFIC TO REGISTER HIGHEST CAGR IN MARKET FOR INDUSTRIAL VERTICAL DURING FORECAST PERIOD
                    TABLE 14 INDUSTRIAL: MARKET, BY REGION, 2024–2028 (USD MILLION)
                    TABLE 15 INDUSTRIAL: MARKET, BY APPLICATION, 2024–2028 (USD MILLION)
    9.5 UTILITY 
           9.5.1 RISING APPLICATION OF PEROVSKITE SOLAR CELLS IN UTILITIES DUE TO HIGH EFFICIENCY IN LOW AND VARIABLE LIGHTS
                    TABLE 16 UTILITY: MARKET, BY REGION, 2024–2028 (USD MILLION)
                    TABLE 17 UTILITY: MARKET, BY APPLICATION, 2024–2028 (USD MILLION)
    9.6 AEROSPACE & DEFENSE 
           9.6.1 RISING ACADEMIC RESEARCH TO POWER AIRCRAFT WITH PEROVSKITE SOLAR CELLS
                    TABLE 18 AEROSPACE & DEFENSE: MARKET, BY REGION, 2024–2028 (USD MILLION)
                    TABLE 19 AEROSPACE & DEFENSE: MARKET, BY APPLICATION, 2024–2028 (USD MILLION)
 
10 PEROVSKITE SOLAR CELL MARKET, BY APPLICATION (Page No. - 78)
     10.1 INTRODUCTION 
             FIGURE 35 MARKET, BY APPLICATION
             FIGURE 36 SOLAR PANEL SEGMENT TO HOLD LARGEST MARKET SHARE DURING FORECAST PERIOD
             TABLE 20 MARKET, BY APPLICATION, 2024–2028 (USD MILLION)
     10.2 BUILDING-INTEGRATED PHOTOVOLTAICS (BIPV) 
             10.2.1 BIPV INSTALLATION INCREASES OPERATIONAL LIFE CYCLE OF BUILDINGS
             10.2.2 ROOFTOPS
                        10.2.2.1 Increased rooftop installations of perovskite solar cells PV modules in residential and commercial sectors
             10.2.3 WINDOWS
                        10.2.3.1 Rising use of perovskite-based PV windows by business complexes to reduce energy bills
                                     TABLE 21 BIPV: MARKET, BY REGION, 2024–2028 (USD MILLION)
                                     TABLE 22 BIPV: MARKET, BY VERTICAL, 2024–2028 (USD MILLION)
     10.3 SOLAR PANEL 
             10.3.1 HIGH DEMAND FOR SOLAR PANELS BASED ON PEROVSKITE SOLAR CELLS IN UTILITY VERTICAL
                        TABLE 23 SOLAR PANEL: MARKET, BY REGION, 2024–2028 (USD MILLION)
                        TABLE 24 SOLAR PANEL: MARKET, BY VERTICAL, 2024–2028 (USD MILLION)
     10.4 SMART GLASS 
             10.4.1 SMART GLASS REDUCES UV AND SUNLIGHT ENTERING BUILDINGS AND HELPS KEEP INDOOR ENVIRONMENT COOLER
                        TABLE 25 SMART GLASS: MARKET, BY REGION, 2024–2028 (USD MILLION)
                        TABLE 26 SMART GLASS: MARKET, BY VERTICAL, 2024–2028 (USD MILLION)
     10.5 OTHERS 
             TABLE 27 OTHERS: MARKET, BY REGION, 2024–2028 (USD MILLION)
             TABLE 28 OTHERS: MARKET, BY VERTICAL, 2024–2028 (USD MILLION)
 
11 PEROVSKITE SOLAR CELL MARKET, BY TECHNOLOGY (Page No. - 85)
     11.1 INTRODUCTION 
             FIGURE 37 MARKET, BY TECHNOLOGY
     11.2 ONE-STEP METHOD 
             11.2.1 ONE-STEP DEPOSITION SIMPLE, FAST, AND INEXPENSIVE METHOD
     11.3 TWO-STEP METHOD 
             11.3.1 TWO-STEP METHOD LESS EXPENSIVE DEPOSITION TECHNIQUE
     11.4 VAPOR-ASSISTED SOLUTION METHOD 
             11.4.1 VAPOR-ASSISTED SOLUTION METHOD USED TO FORM MUTI-JUNCTION PEROVSKITE SOLAR CELLS
     11.5 THERMAL VAPOR DEPOSITION METHOD 
             11.5.1 THERMAL VAPOR DEPOSITION METHOD CONVERTS MATERIAL FROM SOLID TO VAPOR STATE AND SETTLES SUBSTRATE
 
12 PEROVSKITE SOLAR CELL MARKET, BY REGION (Page No. - 88)
     12.1 INTRODUCTION 
             FIGURE 38 MARKET, BY REGION
             TABLE 29  MARKET, BY REGION, 2024–2028 (USD MILLION)
     12.2 NORTH AMERICA 
             FIGURE 39 NORTH AMERICA: SNAPSHOT OF MARKET
             TABLE 30 NORTH AMERICA: MARKET, BY VERTICAL, 2024–2028 (USD MILLION)
             TABLE 31 NORTH AMERICA: MARKET, BY APPLICATION, 2024–2028 (USD MILLION)
             TABLE 32 NORTH AMERICA: MARKET, BY COUNTRY, 2024–2028 (USD MILLION)
             12.2.1 US
                        12.2.1.1 Increasing number of state and federal policies and programs to boost adoption of PV modules
                                     TABLE 33 US: MARKET, BY VERTICAL, 2024–2028 (USD MILLION)
             12.2.2 CANADA
                        12.2.2.1 Large presence of solar energy resources and increasing solar installations
                                     TABLE 34 CANADA:  MARKET, BY VERTICAL, 2024–2028 (USD THOUSAND)
             12.2.3 MEXICO
                        12.2.3.1 Expanding solar industry
                                     TABLE 35 MEXICO: MARKET, BY VERTICAL, 2024–2028 (USD THOUSAND)
     12.3 EUROPE 
             FIGURE 40 EUROPE: SNAPSHOT OF MARKET
             TABLE 36 EUROPE: MARKET, BY VERTICAL, 2024–2028 (USD MILLION)
             TABLE 37 EUROPE: MARKET, BY APPLICATION, 2024–2028 (USD MILLION)
             TABLE 38 EUROPE: MARKET, BY COUNTRY, 2024–2028 (USD MILLION)
             12.3.1 GERMANY
                        12.3.1.1 Growing adoption of PV systems
                                     TABLE 39 GERMANY: PEROVSKITE SOLAR CELL MARKET, BY VERTICAL, 2024–2028 (USD MILLION)
             12.3.2 UK
                        12.3.2.1 Increasing installation of PV systems to harness solar energy
                                     TABLE 40 UK: MARKET, BY VERTICAL, 2024–2028 (USD MILLION)
             12.3.3 FRANCE
                        12.3.3.1 Collaborations between market players and government to increase installed PV capacity
                                     TABLE 41 FRANCE: MARKET, BY VERTICAL, 2024–2028 (USD THOUSAND)
             12.3.4 ITALY
                        12.3.4.1 Rising investments in development of solar energy
                                     TABLE 42 ITALY: MARKET, BY VERTICAL, 2024–2028 (USD MILLION)
             12.3.5 SPAIN
                        12.3.5.1 Increasing research and development related to solar cell technology
                                     TABLE 43 SPAIN:  MARKET, BY VERTICAL, 2024–2028 (USD THOUSAND)
             12.3.6 REST OF EUROPE
                        TABLE 44 REST OF EUROPE: PEROVSKITE SOLAR CELL MARKET, BY VERTICAL, 2024–2028 (USD MILLION)
     12.4 ASIA PACIFIC 
             FIGURE 41 ASIA PACIFIC: SNAPSHOT OF  MARKET
             TABLE 45 ASIA PACIFIC: MARKET, BY VERTICAL, 2024–2028 (USD MILLION)
             TABLE 46 ASIA PACIFIC: MARKET, BY APPLICATION, 2024–2028 (USD MILLION)
             TABLE 47 ASIA PACIFIC: MARKET, BY COUNTRY, 2024–2028 (USD MILLION)
             12.4.1 CHINA
                        12.4.1.1 Increasing PV installations and research and development related to perovskite solar cells
                                     TABLE 48 CHINA: MARKET, BY VERTICAL, 2024–2028 (USD MILLION)
             12.4.2 JAPAN
                        12.4.2.1 Large presence of globally largest floating PV plants
                                     TABLE 49 JAPAN: MARKET, BY VERTICAL, 2024–2028 (USD THOUSAND)
             12.4.3 INDIA
                        12.4.3.1 Government-led focus on adding 100 GW solar capacity
                                     TABLE 50 INDIA: MARKET, BY VERTICAL, 2024–2028 (USD MILLION)
             12.4.4 SOUTH KOREA
                        12.4.4.1 Rising focus on powering every public building with solar energy
                                    TABLE 51 SOUTH KOREA: MARKET, BY VERTICAL, 2024–2028 (USD MILLION)
             12.4.5 TAIWAN
                        12.4.5.1 Rising efforts on increasing power conversion efficiency of perovskite solar cells
                                     TABLE 52 TAIWAN: MARKET, BY VERTICAL, 2024–2028 (USD THOUSAND)
             12.4.6 REST OF ASIA PACIFIC
                        TABLE 53 REST OF ASIA PACIFIC: MARKET, BY VERTICAL, 2024–2028 (USD MILLION)
     12.5 ROW 
             TABLE 54 ROW: PEROVSKITE SOLAR CELL MARKET, BY VERTICAL, 2024–2028 (USD MILLION)
             TABLE 55 ROW: MARKET, BY APPLICATION, 2024–2028 (USD MILLION)
             TABLE 56 ROW: MARKET, BY REGION, 2024–2028 (USD MILLION)
             12.5.1 SOUTH AMERICA
                        12.5.1.1 Increasing research and development of perovskite solar cells
                                     TABLE 57 SOUTH AMERICA: MARKET, BY VERTICAL, 2024–2028 (USD MILLION)
             12.5.2 MIDDLE EAST & AFRICA
                        12.5.2.1 Growing adoption of PV technology
                                     TABLE 58 MIDDLE EAST & AFRICA: MARKET, BY VERTICAL, 2024–2028 (USD THOUSAND)
 
13 COMPETITIVE LANDSCAPE (Page No. - 108)
     13.1 INTRODUCTION 
             TABLE 59 KEY COMPANIES ADOPTED PRODUCT LAUNCH AS KEY GROWTH STRATEGY FROM 2019 TO 2022
             FIGURE 42  MARKET RANKING ANALYSIS
             TABLE 60 COMPANY FOOTPRINT
             TABLE 61 VERTICAL FOOTPRINT OF COMPANIES
             TABLE 62 APPLICATION FOOTPRINT OF COMPANIES
             TABLE 63 REGIONAL FOOTPRINT OF COMPANIES
     13.2 MARKET (KEY PLAYERS): COMPETITIVE LEADERSHIP MAPPING, 2022 (STARTUP/SME) 
             13.2.1 PROGRESSIVE COMPANIES
             13.2.2 RESPONSIVE COMPANIES
             13.2.3 DYNAMIC COMPANIES
             13.2.4 STARTING BLOCKS
                        FIGURE 43 MARKET (KEY PLAYERS): COMPETITIVE LEADERSHIP MAPPING, 2022
                        TABLE 64 MARKET: LIST OF KEY STARTUPS/SMES
     13.3 COMPETITIVE SITUATIONS AND TRENDS 
             13.3.1 PRODUCT LAUNCHES
                        TABLE 65  MARKET: PRODUCT LAUNCHES, JANUARY 2019–MAY 2022
             13.3.2 DEALS
 
14 COMPANY PROFILES (Page No. - 120)
(Business Overview, Products Offered, Recent Developments, and MnM View (Key strengths/Right to Win, Strategic Choices Made, and Weaknesses and Competitive Threats))*  
     14.1 KEY COMPANIES 
             14.1.1 HANWHA Q CELLS
                        TABLE 66 HANWHA Q CELLS: COMPANY OVERVIEW
                        TABLE 67 HANWHA Q CELL: PRODUCTS/SOLUTIONS/SERVICES OFFERED
                        TABLE 68 HANWHA Q CELLS: PRODUCT LAUNCHES
                        TABLE 69 HANWHA Q CELLS: DEALS
                        TABLE 70 HANWHA Q CELLS: OTHERS
             14.1.2 OXFORD PHOTOVOLTAICS (PV)
                        TABLE 71 OXFORD PV: COMPANY OVERVIEW
                        TABLE 72 OXFORD PV: PRODUCTS/SOLUTIONS/SERVICES OFFERED
                        TABLE 73 OXFORD PV: DEALS
                        TABLE 74 OXFORD PV: OTHERS
             14.1.3 MICROQUANTA SEMICONDUCTOR
                        TABLE 75 MICROQUANTA SEMICONDUCTOR: COMPANY OVERVIEW
                        TABLE 76 MICROQUANTA SEMICONDUCTOR: PRODUCTS/SOLUTIONS/SERVICES OFFERED
                        TABLE 77 MICROQUANTA SEMICONDUCTOR: PRODUCT LAUNCHES
                        TABLE 78 MICROQUANTA SEMICONDUCTOR: DEALS
                        TABLE 79 MICROQUANTA SEMICONDUCTOR: OTHERS
             14.1.4 GREATCELL ENERGY
                        TABLE 80 GREATCELL ENERGY: COMPANY OVERVIEW
                        TABLE 81 GREATCELL ENERGY: PRODUCTS/SOLUTIONS/SERVICES OFFERED
                        TABLE 82 GREATCELL ENERGY: DEALS
                        TABLE 83 GREATCELL ENERGY: OTHERS
             14.1.5 SAULE TECHNOLOGIES
                        TABLE 84 SAULE TECHNOLOGIES: COMPANY OVERVIEW
                        TABLE 85 SAULE TECHNOLOGIES: PRODUCTS/SOLUTIONS/SERVICES OFFERED
                        TABLE 86 SAULE TECHNOLOGIES: PRODUCT LAUNCHES
                        TABLE 87 SAULE TECHNOLOGIES: DEALS
                        TABLE 88 SAULE TECHNOLOGIES: OTHERS
             14.1.6 CUBICPV
                        TABLE 89 CUBICPV: COMPANY OVERVIEW
                        TABLE 90 CUBICPV: PRODUCTS/SOLUTIONS/SERVICES OFFERED
                        TABLE 91 CUBICPV: DEALS
             14.1.7 ENECOAT TECHNOLOGIES
                        TABLE 92 ENECOAT: COMPANY OVERVIEW
                        TABLE 93 ENECOAT TECHNOLOGIES: PRODUCTS/SOLUTIONS/SERVICES OFFERED
                        TABLE 94 ENECOAT TECHNOLOGIES: PRODUCT LAUNCHES
                        TABLE 95 ENECOAT TECHNOLOGIES: DEALS
                        TABLE 96 ENECOAT TECHNOLOGIES: OTHERS
             14.1.8 P3C
                        TABLE 97 P3C: COMPANY OVERVIEW
                        TABLE 98 P3C: PRODUCTS/SOLUTIONS/SERVICES OFFERED
             14.1.9 PEROVSKIA SOLAR AG
                        TABLE 99 PEROVSKIA SOLAR AG: COMPANY OVERVIEW
                        TABLE 100 PEROVSKIA SOLAR AG: PRODUCTS/SOLUTIONS/SERVICES OFFERED
                        TABLE 101 PEROVSKIA SOLAR AG: PRODUCT LAUNCHES
                        TABLE 102 PEROVSKIA SOLAR AG: OTHERS
             14.1.10 SOLRA PV
                        TABLE 103 SOLRA PV: COMPANY OVERVIEW
                        TABLE 104 SOLRA PV: PRODUCTS/SOLUTIONS/SERVICES OFFERED
     14.2 OTHER PLAYERS 
             14.2.1 TOSHIBA CORPORATION
             14.2.2 TANDEM PV
             14.2.3 SWIFT SOLAR
             14.2.4 FRONTMATERIALS
             14.2.5 ALFA CHEMISTRY MATERIALS
             14.2.6 AVANTAMA AG
             14.2.7 BORUN NEW MATERIAL TECHNOLOGY
             14.2.8 DYENAMO AB
             14.2.9 NANOX
             14.2.10 OSSILA
             14.2.11 CAELUX
             14.2.12 EVOLAR
             14.2.13 PANASONIC CORPORATION
             14.2.14 ARRAY TECHNOLOGIES
*Details on Business Overview, Products Offered, Recent Developments, and MnM View (Key strengths/Right to Win, Strategic Choices Made, and Weaknesses and Competitive Threats) might not be captured in case of unlisted companies.  
 
15 APPENDIX (Page No. - 149)
     15.1 DISCUSSION GUIDE 
     15.2 KNOWLEDGESTORE: MARKETSANDMARKETS’ SUBSCRIPTION PORTAL 
     15.3 CUSTOMIZATION OPTIONS 
     15.4 RELATED REPORTS 
     15.5 AUTHOR DETAILS 
 

The study involved four major activities in estimating the current size of the perovskite solar cell market. Exhaustive secondary research has been done to collect information on the market and its peer and parent markets. In the next step, the findings, assumptions, and sizes have been validated by industry experts across the value chain through primary research. Both top-down and bottom-up approaches have been employed to estimate the total market size. After that, market breakdown and data triangulation have been employed to estimate the market size of segments and subsegments.

Secondary Research

In the secondary research process, various secondary sources have been referred to for identifying and collecting information important for this study. These secondary sources include perovskite solar cell journals and magazines, press releases of companies; white papers; certified publications and articles from recognized authors; and directories and databases such as Factiva, Hoovers, and OneSource. 

Primary Research

In the primary research process, various sources from both supply and demand sides have been interviewed to obtain qualitative and quantitative information important for this report. The primary sources from the supply side included industry experts such as CEOs, VPs, marketing directors, technology and innovation directors, and related executives from key companies and organizations operating in the perovskite solar cell market. After complete market engineering (including calculations regarding market statistics, market breakdown, market size estimations, market forecasting, and data triangulation), extensive primary research has been conducted to gather information and verify and validate the critical numbers arrived at.
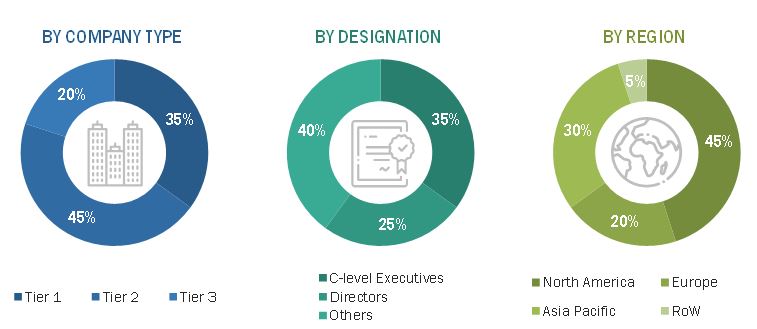
Perovskite Solar Cell Market Size, and Share

To know about the assumptions considered for the study, download the pdf brochure

Market Size Estimation

In the complete market engineering process, both top-down and bottom-up approaches have been implemented, along with several data triangulation methods, to estimate and validate the size of the perovskite solar cell market and other dependent submarkets listed in this report.

  • Key players in the markets have been identified through extensive secondary research.
  • In terms of value, the industry’s supply chain and market size have been determined through primary and secondary research.  
  • All percentage shares, splits, and breakdowns have been determined using secondary sources and verified through primary sources.

Perovskite Solar Cell Market: Top-Down Approach

Perovskite Solar Cell Market Size, and Top-Down Approach

Data Triangulation

After arriving at the overall market size from the estimation process explained above, the global market has been split into several segments and subsegments. Market breakdown and data triangulation procedures have been employed wherever applicable to complete the overall market engineering process and arrive at exact statistics for all segments and subsegments. The data has been triangulated by studying various factors and trends identified from both the demand and supply sides.

Report Objectives

The following are the primary objectives of the study.

  • To describe and forecast the perovskite solar cell market based on type of structure, type, product, application, vertical, and technology, in terms of value.
  • To describe and forecast the perovskite solar cell market, in terms of value, for four key regions—
    North America, Europe, Asia Pacific, and the Rest of the World (RoW)
  • To provide detailed information regarding drivers, restraints, opportunities, and challenges influencing the market growth
  • To strategically analyze the micromarkets1 with respect to individual growth trends, prospects, and contribution to the overall perovskite solar cell market
  • To provide a detailed overview of the supply/value chain and ecosystem pertaining to the perovskite solar cell market
  • To strategically analyze the ecosystem, tariffs and regulations, patent landscape, trade landscape, and case studies pertaining to the market under study
  • To profile the key players and comprehensively analyze their market positions in terms of ranking and core competencies2

To analyze the competitive developments such as joint ventures, mergers and acquisitions, product developments, and research and development (R&D) in the perovskite solar cell market

Available Customizations

With the given market data, MarketsandMarkets offers customizations according to a company’s specific needs. The following customization options are available for the report:

Company Information:

  • Detailed analysis and profiling of additional market players (up to 5)
Custom Market Research Services

We will customize the research for you, in case the report listed above does not meet with your exact requirements. Our custom research will comprehensively cover the business information you require to help you arrive at strategic and profitable business decisions.

Request Customization

Instant Answers with GPT - Ask Now!

Ask real questions. Get complete answers !
Report Code
SE 8525
Published ON
Dec, 2022
Choose License Type
BUY NOW
  • SHARE
X
Request Customization
Speak to Analyst
Speak to Analyst
OR FACE-TO-FACE MEETING
PERSONALIZE THIS RESEARCH
  • Triangulate with your Own Data
  • Get Data as per your Format and Definition
  • Gain a Deeper Dive on a Specific Application, Geography, Customer or Competitor
  • Any level of Personalization
REQUEST A FREE CUSTOMIZATION
LET US HELP YOU!
  • What are the Known and Unknown Adjacencies Impacting the Perovskite Solar Cell Market
  • What will your New Revenue Sources be?
  • Who will be your Top Customer; what will make them switch?
  • Defend your Market Share or Win Competitors
  • Get a Scorecard for Target Partners
CUSTOMIZED WORKSHOP REQUEST
knowledgestore logo

Want to explore hidden markets that can drive new revenue in Perovskite Solar Cell Market?

Find Hidden Markets
  • Call Us
  • +1-888-600-6441 (Corporate office hours)
  • +1-888-600-6441 (US/Can toll free)
  • +44-800-368-9399 (UK office hours)
CONNECT WITH US
ABOUT TRUST ONLINE
©2024 MarketsandMarkets Research Private Ltd. All rights reserved
DMCA.com Protection Status
Website Feedback