Performance Analytics Market by Component (Software, and Services), Application (Financial, Sales & Marketing, IT Operations, Supply Chain Performance Analytics), Vertical, Analytics Type, Deployment, Organization Size, Industry - Global Forecast to 2021


[144 Pages Report] The overall performance analytics market is expected to grow from USD 0.96 billion in 2015 to USD 2.59 billion by 2021, at a CAGR of 18.7% from 2016 to 2021. Performance analytics is a set of functionalities that help the organizations to automate performance analysis of various business functions. The user can easily map the performance of their organization against a standard pre-defined set of KPIs and identify the causes for variations. The users monitor, measure, and analyze the performance of business functions such as financial operations, sales, marketing, workforce, and IT operations in real-time with easy interactive dashboards and reports. The base year considered for the study is 2015, and the forecast has been provided for the period between 2016 and 2021.
Performance Analytics Market Dynamics
Drivers
- Need to generate insights from continually rising volume of the data
- Rising prevalence of metrics driven business performance assessment
- Technological advancements in computing power
Restraints
- Lack of awareness regarding positive impacts of performance analytics
- Concerns about positive ROI
Opportunities
- Emergence of advanced vendor offerings
- Increasing adoption of cloud-based performance analytics solutions
Challenges
- Privacy and data security concerns
- Lack of skilled analytical workforce
Need to generate insights from continually rising volume of the data would drive the performance analytics market growth
Today, the organizations across the world are flooded with structured and unstructured data with the tremendous growth in IoT and mobile devices adoption. This data describes central characteristics of an organization and is a pivotal part of business progression. To improve their market presence and build powerful product portfolio, organizations have started investing significant amount of capital on data analysis. Traditionally, the organizations were using legacy technology and operating multiple systems for data reporting. However, due to this fragmented data, the leader of the organization were forced to spend more time on reconciling and preparing data, which prevented them from identifying pain points and improving business performance. Performance analytics tools empowered the business users to create real-time business performance reporting, which helped them to make fact-based decisions.
Following are the objectives of the report:
- To define, describe, and forecast the performance analytics market on the basis of component, applications, analytics type, organization size, deployment models, industry verticals, and regions
- To provide a detailed information regarding the major factors influencing the growth of the market (drivers, restraints, opportunities, and challenges)
- To analyze subsegments with respect to individual growth trends, future prospects, and contribution to the total market
- To analyze the opportunities in the performance analytics market for stakeholders and to provide the details of a competitive landscape for the major players
- To forecast the revenue of market segments with respect to all the major regions, namely, North America, Europe, Asia Pacific (APAC), Latin America, and Middle East and Africa (MEA)
- To profile key players and comprehensively analyze their recent developments and positioning
- To analyze competitive developments, such as acquisitions, new product launches, and research and development activities in the market
During this research study, major players operating in the performance analytics market in various regions have been identified, and their offerings, regional presence, and distribution channels have been analyzed through in-depth discussions. Top-down and bottom-up approaches have been used to determine the overall market size. Sizes of the other individual markets have been estimated using the percentage splits obtained through secondary sources such as Hoovers, Bloomberg BusinessWeek, and Factiva, along with primary respondents. The entire procedure includes the study of the annual and financial reports of the top market players and extensive interviews with industry experts such as CEOs, VPs, directors, and marketing executives for key insights (both qualitative and quantitative) pertaining to the market. The figure below shows the breakdown of the primaries on the basis of the company type, designation, and region considered during the research study.
BREAKDOWN OF PRIMARY PARTICIPANTS
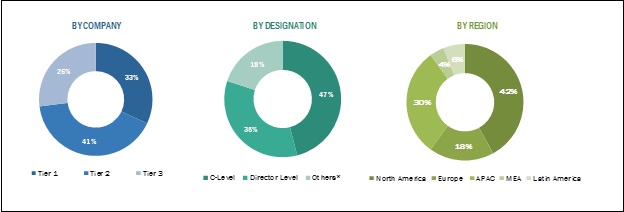
Note: �Others� includes sales managers, marketing managers, and product managers. Tiers of the companies have been defined based on its total revenue as of 2017; Tier 1 = >USD 100 million, Tier 2 = USD 50 million � USD 100 million, and Tier 3 Tier 3 = < USD 50 million
To know about the assumptions considered for the study, download the pdf brochure
The performance analytics ecosystem comprises vendors, such as, IBM Corporation (US), Oracle Corporation (US), SAS Institute Inc. (US), SAP SE (Germany), Siemens AG (Germany), Adaptive Insights (US), Xactly Corporation (US), Optymyze (US), ServiceNow, Inc.( US), and Callidus Software, Inc. (US). Other stakeholders of the performance analytics market include application design and software developers, system integrators, IT service providers, consulting service provider, managed service provider, market research and consulting firms, and cloud service providers.
Major Performance Analytics Market Developments
- In June 2016, IBM partnered with Axciom to provide powerful analytics solutions to the customers for deriving accurate insights in a short period. This would help the data scientists and marketing analysts to understand customers and predict future behaviors of the customers.
- In February 2016, SAP acquired Roambi to provide mobile access to analytics solutions to everyone. Roambi�s mobile-centric analytics and visualization solution allow workforce to access critical information anywhere, any time.
- In February 2015, SAS and ICMA have been delivering its ICMA Insights to cities, towns, and countries across U.S. to compare their performance data with other participants� data. The solution now has been delivered to more than 100 government entities to analyze and report performance.
Target Audience:
- Managed Services Providers
- Consulting Services Providers
- Cloud Services Providers
- Internet Services Providers (ISPs)
- Enterprises
- End-Users
Scope of the Report
The research report categorizes the performance analytics market to forecast the revenues and analyze the trends in each of the following subsegments:
By Component
- Software
- Services
- Managed services
- Professional services
- Support and maintenance
- Consulting services
By Application
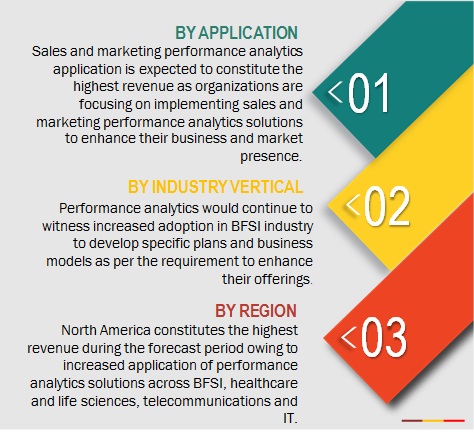
- Sales and marketing performance analytics
- Financial performance analytics
- Supply chain performance analytics
- IT operations performance analytics
- Employee performance analytics
- Others (Engineering and R&D performance analytics)
By Analytics Type
- Predictive analytics
- Prescriptive analytics
- Descriptive analytics
By Deployment Model
- On-premises
- Cloud
By Organization Size
- Small and Medium Size Business (SMBs)
- Large enterprises
By Industry Vertical
- BFSI
- Telecommunications and IT
- Retail and e-commerce
- Government and defense
- Healthcare
- Manufacturing
- Energy and utilities
- Construction and engineering
- Others (Education, research, travel and hospitality, and outsourcing services)
By Region
- North America
- Europe
- Asia-Pacific (APAC)
- Latin America
- Middle East and Africa (MEA)
Available Customizations
With the given market data, MarketsandMarkets offers customizations as per the company�s specific needs. The following customization options are available for the report:
Product Analysis
- Product matrix which gives a detailed comparison of product portfolio of each company
Geographic Analysis
- Further breakdown of the North America performance analytics market
- Further breakdown of the Europe market
- Further breakdown of the APAC market
- Further breakdown of the MEA market
- Further breakdown of the Latin America performance analytics market
Company Information
- Detailed analysis and profiling of additional market players
The overall performance analytics market is expected to grow from USD 1.10 Billion in 2016 to USD 2.59 Billion by 2021, at a Compound Annual Growth Rate (CAGR) of 18.7% from 2016 to 2021. Simple to utilize and integrated business applications of performance analytics software will propel the growth of the market. Major driver of the performance analytics market is rising prevalence of metrics-driven business performance assessment.
Performance analytics platform is a user-driven process and is a part of business intelligence architecture, mainly aimed at creating interactive reports and exploring performance-based data. Data gathered from various back-end systems and sources, are utilized for analyzing and understanding historical performance, present performance, and provide recommendation to mitigate business risk through real-time view of KPI and future indicators from the data set. Performance analytics is a management discipline process that let companies have increased focus on supporting integrated management process on the operational, financial, and strategic level, and enabling companies to closely and effectively monitor their overall performance. The rising need for data-driven decision-making and understanding past performance and future performance pattern and trends that would assist the companies to maintain the require performance level has made performance analytics as a must needed technology on both business and IT sector of the organization. Performance analytics can contribute significantly towards interpretation and sharing of insights from thorough data analytics, enabling nontechnical SMBs to perform analysis in a self-directed manner.
The performance analytics market is segmented by component, professional service, application, analytic type, organization size, deployment model, industry vertical, and region. Performance analytics software are used widely by major industry verticals such as BFSI, retail & e-commerce, telecommunications & IT, energy & utilities, government, healthcare, manufacturing, construction & engineering, and others (hospitality services, education, and travel & hospitality), for different business needs.
Globally, performance analytics software and services have gradually started to take over traditional BI tools used for assessing the overall performance of the company, which could not be utilized and accessed without any help from the technical staff. The benefits offered by performance analytics software and service to enterprises includes better preparation for change, superior business management, connected business processes, strategic competitive advantage, timely actionable information, and overall reduced operational risk.
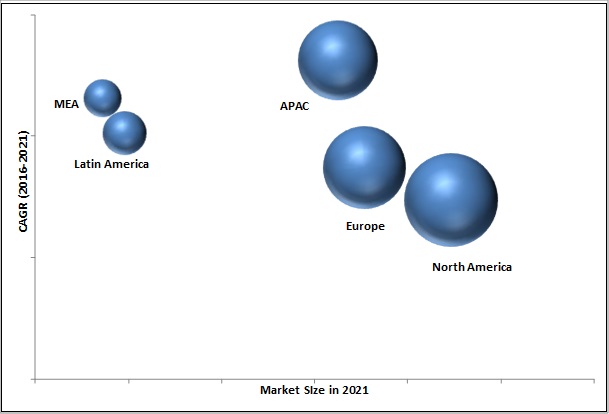
North America is expected to hold the largest market size in the overall performance analytics market, followed by Europe, owing to the technological upgradations in these regions. The adoption rate of performance analytics platform and software is increasing in APAC and Latin America due to the increasing amount of business data across various industry verticals in these regions.
PERFORMANCE ANALYTICS MARKET, BY REGION, 2021 (USD BILLION)
Increasing demand for sales and marketing performance analytics, financial performance analytics, and IT operations performance analytics drive the market growth
Sales and marketing analytics
Performance analytics software in sales and marketing assists companies with optimized marketing spend, not in the traditional sense of applying a marketing mix model, but in delivering optimization through strategy and efficiency at the marketing process level. Additionally, sales and marketing performance analytics application also incorporates the project management process and IT management in designing and delivering tailored marketing services. This approach helps companies with the quick delivery and tailored solutions that are scalable across different regions, business segments, and functions.
Financial performance analytics
On implementing performance analytics software along with financial performance analytics application, companies would be able to bridge the gap between their financial performance and operational performance drivers. Performance analytics software here supports companies to have highly accurate cash flow analysis, real-time view of the financial situation, enhanced alignment with operations, apart from helping them identify variances with corrective actions and track the difference between actual financial performances against planned financial performance. All this linked with operations would result in enhanced overall increase in sales and profitability.
IT operations performance analytics
Performance analytics enables IT operation performance analytics assist companies in efficiently managing their huge IT layer that consists of network, server & storage, and application and identifying where the fault is and providing the immediate fix that results in delivering the high quality services and applications to its end users. Network management, network traffic analysis, network configuration management, server performance management, storage device management, application performance management and end-user experience management are some of the major capabilities of performance analytics enabled IT operation performance analytics application.
Critical questions the report answers:
- Where will all these developments take the industry in the mid to long term?
- What are the upcoming industry applications for clickstream analytics?
Today, organizations are commonly transforming their business either through subsidiaries or acquisitions. This is leading to expansion of operations and teams that needs high-tech technology to solve the issues regarding data management and analysis of various business functions. For instance, the expansion of operations leads to several structural changes within sales and requires effective sales planning and review system to maintain the growth. However, the fear of losing ownership to some potential sales data, hinders the adoption of such tools. Thus, the sales teams continue to rely on older software and solutions and are reluctant to adopt the new technologies. Moreover, the business users have uncertainties about positive Return on Investment (ROI) post implementation of such analytical tools. Therefore, such misconceptions have restrained the adoption of performance analytics solutions among the organizations.
The performance analytics ecosystem comprises vendors, such as, IBM Corporation (US), Oracle Corporation (US), SAS Institute Inc. (US), SAP SE (Germany), Siemens AG (Germany), Adaptive Insights (US), Xactly Corporation (US), Optymyze (US), ServiceNow, Inc.( US), and Callidus Software, Inc. (US). Other stakeholders of the performance analytics market include application design and software developers, system integrators, IT service providers, consulting service provider, managed service provider, market research and consulting firms, and cloud service providers.
To speak to our analyst for a discussion on the above findings, click Speak to Analyst
 Exclusive indicates content/data unique to MarketsandMarkets and not available with any competitors.
Table of Contents
1 Introduction (Page No. - 15)
1.1 Objectives of the Study
1.2 Market Definition
1.3 Market Scope
1.3.1 Markets Covered
1.3.2 Years Considered for the Study
1.4 Currency
1.5 Limitations
1.6 Stakeholders
2 Research Methodology (Page No. - 18)
2.1 Research Data
2.1.1 Secondary Data
2.1.1.1 Key Data From Secondary Sources
2.1.2 Primary Data
2.1.2.1 Key Data From Primary Sources
2.1.2.2 Key Industry Insights
2.1.2.3 Breakdown of Primaries
2.2 Market Size Estimation
2.2.1 Bottom-Up Approach
2.2.2 Top-Down Approach
2.3 Market Breakdown and Data Triangulation
2.4 Research Assumptions
2.4.1 Assumptions
3 Executive Summary (Page No. - 26)
4 Premium Insights (Page No. - 31)
4.1 Attractive Market Opportunities in the Performance Analytics Market
4.2 Market Share Across Various Regions
4.3 Market By Industry Vertical and Region
4.4 Lifecycle Analysis, By Region, 2016
5 Market Overview (Page No. - 33)
5.1 Introduction
5.2 Evolution
5.3 Market Segmentation
5.3.1 By Component
5.3.2 By Application
5.3.3 By Deployment Model
5.3.4 By Organization Size
5.3.5 By Industry Vertical
5.3.6 By Region
5.4 Market Dynamics
5.4.1 Drivers
5.4.1.1 Need to Generate Insights From Continually Rising Volume of the Data
5.4.1.2 Rising Prevalence of Metrics Driven Business Performance Assessment
5.4.1.3 Technological Advancements in Computing Power
5.4.2 Restraints
5.4.2.1 Lack of Awareness Regarding Positive Impacts of Performance Analytics
5.4.2.2 Concerns About Positive Roi
5.4.3 Opportunities
5.4.3.1 Emergence of Advanced Vendor Offerings
5.4.3.2 Increasing Adoption of Cloud-Based Performance Analytics Solutions
5.4.4 Challenges
5.4.4.1 Privacy and Data Security Concerns
5.4.4.2 Lack of Skilled Analytical Workforce
6 Industry Trends (Page No. - 41)
6.1 Introduction
6.2 Value Chain Analysis
6.3 Strategic Benchmarking
6.4 Use Cases
6.4.1 Use Case 1
6.4.2 Use Case 2
6.4.3 Use Case 3
7 Performance Analytics Market Analysis, By Component (Page No. - 45)
7.1 Introduction
7.2 Software
7.3 Services
7.3.1 Managed Services
7.3.2 Professional Services
7.3.2.1 Support and Maintenance
7.3.2.2 Consulting
8 Performance Analytics Market Analysis, By Application (Page No. - 53)
8.1 Introduction
8.2 Sales and Marketing Performance Analytics
8.3 Financial Performance Analytics
8.4 Supply Chain Performance Analytics
8.5 IT Operations Performance Analytics
8.6 Employee Performance Analytics
8.7 Others
9 Performance Analytics Market Analysis, By Analytics Type (Page No. - 60)
9.1 Introduction
9.2 Predictive Analytics
9.3 Prescriptive Analytics
9.4 Descriptive Analytics
10 Performance Analytics Market Analysis, By Deployment Model (Page No. - 64)
10.1 Introduction
10.2 On-Premises
10.3 Cloud
11 Performance Analytics Market Analysis, By Organization Size (Page No. - 68)
11.1 Introduction
11.2 Small and Medium Businesses
11.3 Large Enterprises
12 Performance Analytics Market Analysis, By Vertical (Page No. - 72)
12.1 Introduction
12.2 Banking, Financial Services, and Insurance
12.3 Telecommunications and IT
12.4 Retail and E-Commerce
12.5 Government and Defense
12.6 Healthcare
12.7 Manufacturing
12.8 Energy and Utilities
12.9 Construction and Engineering
12.10 Others
13 Geographic Analysis (Page No. - 80)
13.1 Introduction
13.2 North America
13.3 Europe
13.4 Asia-Pacific
13.5 Middle East and Africa
13.6 Latin America
14 Competitive Landscape (Page No. - 102)
14.1 Overview
14.2 Competitive Situations and Trends
14.2.1 Partnerships, Agreements, and Collaborations
14.2.2 New Product Launches
14.2.3 Expansions
14.2.4 Merger and Acquisitions
14.3 Vendor Analysis
15 Company Profiles (Page No. - 110)
15.1 Introduction
(Overview, Financials, Products & Services, Strategy, and Developments)*
15.2 International Business Machines Corporation
15.3 SAP SE
15.4 SAS Institute, Inc.
15.5 Oracle Corporation
15.6 Siemens AG
15.7 Adaptive Insights
15.8 Xactly Corporation
15.9 Optymyze
15.10 Servicenow, Inc.
15.11 Callidus Software Inc.
*Details on Overview, Financials, Product & Services, Strategy, and Developments Might Not Be Captured in Case of Unlisted Companies.
16 Key Innovators (Page No. - 133)
16.1 Nice Systems Inc.
16.2 Quantros, Inc.
16.3 Tidemark Systems, Inc.
16.4 Prophix Software, Inc.
16.5 Tagetik Software Srl
17 Appendix (Page No. - 136)
17.1 Key Insights of Industry Experts
17.2 Discussion Guide
17.3 Knowledge Store: Marketsandmarkets� Subscription Portal
17.4 Introducing RT: Real-Time Market Intelligence
17.5 Available Customization
17.6 Related Reports
17.7 Author Details
List of Tables (82 Tables)
Table 1 Performance Analytics Market Size and Growth Rate, 2014�2021 (USD Million, Y-O-Y%)
Table 2 Market Size, By Component, 2014-2021 (USD Million)
Table 3 Software: Market Size, By Region, 2014-2021 (USD Million)
Table 4 Services: Market Size, By Region, 2014-2021 (USD Million)
Table 5 Services: Market Size, By Type, 2014-2021 (USD Million)
Table 6 Managed Services: Market Size, By Region, 2014-2021 (USD Million)
Table 7 Professional Services: Market Size, By Region, 2014-2021 (USD Million)
Table 8 Professional Services: Market Size, By Type, 2014-2021 (USD Million)
Table 9 Support and Maintenance Services: Market Size, By Region, 2014-2021 (USD Million)
Table 10 Consulting Services: Market Size, By Region, 2014-2021 (USD Million)
Table 11 Performance Analytics Market Size, By Application, 2014-2021 (USD Million)
Table 12 Sales and Marketing Performance Analytics: Market Size, By Region, 2014-2021 (USD Million)
Table 13 Financial Performance Analytics: Performance Analytics, By Region, 2014-2021 (USD Million)
Table 14 Supply Chain Performance Analytics: Market Size, By Region, 2014-2021 (USD Million)
Table 15 IT Operations Performance Analytics: Market Size, By Region, 2014-2021 (USD Million)
Table 16 Employee Performance Analytics: Market Size, By Region, 2014-2021 (USD Million)
Table 17 Others: Market Size, By Region, 2014-2021 (USD Million)
Table 18 Market Size, By Analytics Type, 2014-2021 (USD Million)
Table 19 Predictive Analytics: Market Size, By Region, 2014-2021 (USD Million)
Table 20 Prescriptive Analytics: Performance Analytics, By Region, 2014-2021 (USD Million)
Table 21 Descriptive Analytics: Market Size, By Region, 2014-2021 (USD Million)
Table 22 Market Size, By Deployment Model, 2014-2021 (USD Million)
Table 23 On-Premises: Market Size, By Region, 2014-2021 (USD Million)
Table 24 Cloud: Market Size, By Region, 2014-2021 (USD Million)
Table 25 Performance Analytics Market Size, By Organization Size, 2014-2021 (USD Million)
Table 26 Small and Medium Businesses: Market Size, By Region, 2014-2021 (USD Million)
Table 27 Large Enterprises: Market Size, By Region, 2014-2021 (USD Million)
Table 28 Market Size, By Vertical, 2014�2021 (USD Million)
Table 29 Banking, Financial Services, and Insurance: Market Size, By Region, 2014�2021 (USD Million)
Table 30 Telecommunications and IT: Market Size, By Region, 2014-2021 (USD Million)
Table 31 Retail and E-Commerce: Market Size, By Region, 2014-2021 (USD Million)
Table 32 Government and Defense: Market Size, By Region, 2014�2021 (USD Million)
Table 33 Healthcare: Market Size, By Region, 2014-2021 (USD Million)
Table 34 Manufacturing: Market Size, By Region, 2014-2021 (USD Million)
Table 35 Energy and Utilities: Market Size, By Region, 2014-2021 (USD Million)
Table 36 Construction and Engineering: Market Size, By Region, 2014-2021 (USD Million)
Table 37 Others: Market Size, By Region, 2014-2021 (USD Million)
Table 38 Performance Analytics Market Size, By Region, 2014�2021 (USD Million)
Table 39 North America: Market Size, By Component, 2014�2021 (USD Million)
Table 40 North America: Market Size, By Service, 2014�2021 (USD Million)
Table 41 North America: Market Size, By Professional Service, 2014�2021 (USD Million)
Table 42 North America: Market Size, By Application, 2014�2021 (USD Million)
Table 43 North America: Market Size, By Analytics Type, 2014�2021 (USD Million)
Table 44 North America: Market Size, By Deployment Model, 2014�2021 (USD Million)
Table 45 North America: Market Size, By Organization Size, 2014�2021 (USD Million)
Table 46 North America: Market Size, By Industry Vertical, 2014�2021 (USD Million)
Table 47 Europe: Performance Analytics Market Size, By Component, 2014�2021 (USD Million)
Table 48 Europe: Market Size, By Service, 2014�2021 (USD Million)
Table 49 Europe: Market Size, By Professional Service, 2014�2021 (USD Million)
Table 50 Europe: Market Size, By Application, 2014�2021 (USD Million)
Table 51 Europe: Market Size, By Analytics Type, 2014�2021 (USD Million)
Table 52 Europe: Market Size, By Deployment Model, 2014�2021 (USD Million)
Table 53 Europe: Market Size, By Organization Size, 2014�2021 (USD Million)
Table 54 Performance Analytics Market Size, By Industry Vertical, 2014�2021 (USD Million)
Table 55 Asia-Pacific: Market Size, By Component, 2014�2021 (USD Million)
Table 56 Asia-Pacific: Market Size, By Service, 2014�2021 (USD Million)
Table 57 Asia-Pacific: Market Size, By Professional Service, 2014�2021 (USD Million)
Table 58 Asia-Pacific: Market Size, By Application, 2014�2021 (USD Million)
Table 59 Asia-Pacific: Market Size, By Analytics Type, 2014-2021 (USD Million)
Table 60 Asia-Pacific: Market Size, By Deployment Model, 2014-2021 (USD Million)
Table 61 Asia-Pacific: Market Size, By Organization Size, 2014�2021 (USD Million)
Table 62 Asia-Pacific: Market Size, By Industry Vertical, 2014�2021 (USD Million)
Table 63 Middle East and Africa: Performance Analytics Market Size, By Component, 2014�2021 (USD Million)
Table 64 Middle East and Africa: Market Size, By Service, 2014�2021 (USD Million)
Table 65 Middle East and Africa: Market Size, By Professional Service, 2014�2021 (USD Million)
Table 66 Middle East and Africa: Market Size, By Application, 2014�2021 (USD Million)
Table 67 Middle East and Africa: Market Size, By Analytics Type, 2014�2021 (USD Million)
Table 68 Middle East and Africa: Market Size, By Deployment Model, 2014�2021 (USD Million)
Table 69 Middle East and Africa: Market Size, By Organization Size, 2014�2021 (USD Million)
Table 70 Middle East and Africa: Market Size, By Industry Vertical, 2014�2021 (USD Million)
Table 71 Latin America: Performance Analytics Market Size, By Component, 2014�2021 (USD Million)
Table 72 Latin America: Market Size, By Service, 2014�2021 (USD Million)
Table 73 Latin America: Market Size, By Professional Service, 2014�2021 (USD Million)
Table 74 Latin America: Market Size, By Application, 2016�2021 (USD Million)
Table 75 Latin America: Market Size, By Analytics Type, 2014�2021 (USD Million)
Table 76 Latin America: Market Size, By Deployment Model, 2014�2021 (USD Million)
Table 77 Latin America: Market Size, By Organization Size, 2014�2021 (USD Million)
Table 78 Latin America: Market Size, By Industry Vertical, 2014�2021 (USD Million)
Table 79 Partnerships, Agreements, and Collaborations, 2016�2017
Table 80 New Product Launches, 2016-2017
Table 81 Expansions, 2015�2017
Table 82 Merger and Acquisitions, 2016�2017
List of Figures (57 Figures)
Figure 1 Performance Analytics Market: Research Design
Figure 2 Market Size Estimation Methodology: Bottom-Up Approach
Figure 3 Market Size Estimation Methodology: Top-Down Approach
Figure 4 Data Triangulation
Figure 5 Market is Poised to Witness High Growth During the Period 2016�2021
Figure 6 Market Snapshot on the Basis of Components (2016 vs 2021)
Figure 7 Market Snapshot on the Basis of Services (2016 -2021)
Figure 8 Market Snapshot on the Basis of Applications (2016-2021)
Figure 9 Market Snapshot on the Basis of Deployment Models (2016 - 2021)
Figure 10 Market Snapshot on the Basis of Analytic Types (2016 - 2021)
Figure 11 Emerging Advanced Vendor Offerings is Expected to Boost Opportunities in the Performance Analytics Market
Figure 12 North America is Estimated to Dominate the Performance Analytics Market in 2016
Figure 13 Banking, Financial Services, and Insurance is Expected to Have the Largest Market Share in 2016
Figure 14 Regional Lifecycle: Asia-Pacific is Estimated to Be in the Growth Phase in 2016
Figure 15 Performance Analytics Market: Evolution
Figure 16 Market By Component
Figure 17 Market By Application
Figure 18 Market By Deployment Model
Figure 19 Market By Organization Size
Figure 20 Market By Industry Vertical
Figure 21 Market By Region
Figure 22 Market Drivers, Restraints, Opportunities, and Challenges
Figure 23 Value Chain Analysis: Performance Analytics Market
Figure 24 Market: Strategic Benchmarking
Figure 25 The Services Segment is Expected to Grow at the Highest CAGR During the Forecast Period
Figure 26 Managed Services Segment is Expected to Grow at the Highest CAGR During the Forecast Period
Figure 27 Consulting Services Segment is Expected to Grow at the Highest CAGR During the Forecast Period
Figure 28 IT Operations Performance Analytics Application is Expected to Grow at the Highest CAGR During the Forecast Period
Figure 29 Descriptive Analytics is Expected to Grow at the Highest CAGR During the Forecast Period
Figure 30 Cloud-Based Performance Analytics Deployment Model is Expected to Grow at the Highest CAGR During the Forecast Period
Figure 31 Small and Medium Businesses Segment is Expected to Grow at the Highest CAGR During the Forecast Period
Figure 32 Retail and E-Commerce Vertical is Expected to Grow at the Highest CAGR During the Forecast Period
Figure 33 Regional Snapshot: Asia-Pacific is Expected to Have the Highest CAGR in the Market
Figure 34 Asia-Pacific is Projected to Have the Highest Market Growth in the Performance Analytics Market
Figure 35 North America Market Snapshot
Figure 36 Asia-Pacific Market Snapshot
Figure 37 Companies Adopted Product Launches as the Key Growth Strategy From 2014 to 2017
Figure 38 Market Evaluation Framework
Figure 39 Battle for Market Share: Partnership, Collaborations, and Agreement Was the Key Strategy Adopted By the Players in the Performance Analytics Market During 2014�2017
Figure 40 Vendor Analysis: Criteria Weightage
Figure 41 Product Offerings Comparison
Figure 42 Business Strategy Comparison
Figure 43 Geographic Revenue Mix of Top Five Market Players
Figure 44 IBM Corporation: Company Snapshot
Figure 45 IBM Corporation: SWOT Analysis
Figure 46 SAP SE: Company Snapshot
Figure 47 SAP SE: SWOT Analysis
Figure 48 SAS Institute, Inc.: Company Snapshot
Figure 49 SAS Institute, Inc.: SWOT Analysis
Figure 50 Oracle Corporation: Company Snapshot
Figure 51 Oracle Corporation: SWOT Analysis
Figure 52 Siemens AG: Company Snapshot
Figure 53 Siemens AG: SWOT Analysis
Figure 54 Xactly Corporation: Company Snapshot
Figure 55 Servicenow, Inc.: Company Snapshot
Figure 56 Callidus Software, Inc.: Company Snapshot
Figure 57 Nice Systems Inc.: Company Snapshot


Growth opportunities and latent adjacency in Performance Analytics Market