PDC Drill Bits Market by Type (Matrix Body and Steel Body), Size of PDC Cutter (Less than 9 mm, 9¢14 mm, 15¢24 mm, and Above 24 mm), Number of Blades (Less than 6, 6¢10, and Above 10), and Region (North America, Asia Pacific, and Europe) - Global Forecast to 2023


[123 Pages Report] The PDC drill bits market was valued at USD 3.52 Billion in 2017 and is estimated to grow at a CAGR of 4.41% from 2018 to 2023, to reach a market size of USD 4.54 Billion by 2023. This growth is primarily driven by the increasing rate of oil & gas drilling activities across the world and need for advanced techniques for faster and efficient drilling. The North American region is estimated to hold the largest share of the PDC drill bits market. The Asia Pacific region held the second-largest market share in 2017.
Objectives of the study
- To define, describe, and forecast the PDC drill bits market, in terms of value, on the basis of type, size of PDC cutter, number of blades and region
- To provide detailed information about the major factors influencing the market growth (drivers, restraints, opportunities, and challenges)
- To estimate and forecast the size of the market, in terms of value, with respect to 6 main regions, namely, the Middle East, Africa, Asia Pacific (APAC), North America, Europe, and South America
- To study the individual growth trends and future prospects of PDC drill bits providers and analyze the key contributors in this market
- To strategically analyze micro-markets with respect to individual growth trends, future prospects, and contribution to the total market
- To track and analyze competitive developments such as contracts & agreements, mergers & acquisitions, and new product launches in the market
- To profile key market players and comprehensively analyze their market positions and core competencies
Research Methodology
This research study involved the use of extensive secondary sources, directories, and databases, such as HooverÆs, Bloomberg Businessweek, Factiva, and OneSource, to identify and collect information useful for a technical, market-oriented, and commercial study of the PDC drill bits market. Primary sources include industry experts from the core and related industries, preferred suppliers, manufacturers, distributors, service providers, technology developers, standards and certification organizations of companies, and organizations related to all the segments of this industryÆs value chain. The research methodology has been explained below.
- Study of annual revenues and market developments of major players that offer PDC drill bits products and solutions
- Assessment of future trends in the PDC drill bits market
- Assessment of the market with respect to the size of PDC cutter used in PDC drill bits
- Study of market trends in various regions or countries supported by the number of blades of PDC drill bits
- Study of contracts & developments related to the PDC drill bits market by key players across different regions
Finalization of the overall market sizes by triangulating the supply-side data, which includes product developments, supply chain, and annual revenues of companies manufacturing PDC drill bits across the globe
To know about the assumptions considered for the study, download the pdf brochure
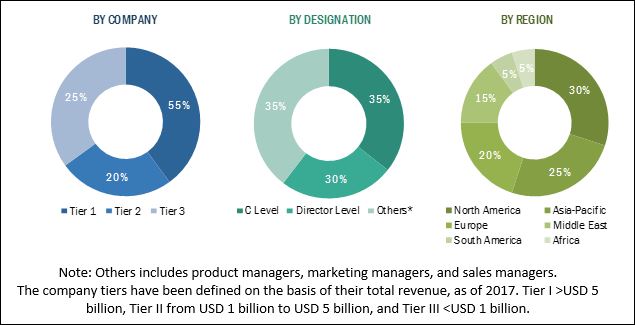
After arriving at the overall market size, the total market has been split into segments and subsegments. The figure given above illustrates the breakdown of primaries conducted during the research study on the basis of company type, designation, and region.
The PDC drill bits market ecosystem comprises service providers such as Schlumberger (US), BHGE (US), Halliburton (US), NOV (US), Varel (US), Atlas Copco (Sweden), Ultera (US), Drill Master International (US), Sichuan Chuanshi Diamond Bit (China), Torquato (US), Rubicon Oilfield International (US), and Western Drilling tools (Canada), Shear bits (Canada), Volgaburmash (Russia).
Target Audience:
The reportÆs target audience includes:
- PDC drill bits manufacturers and suppliers
- PDC drill bits operators
- Oil & gas drilling operators
- PDC drill bits research institutes
- Government and research organizations
- Institutional researchers and professors
- National and local government organizations
- Research organizations and consulting companies
- Technology providers
Scope of the Report:
The PDC drill bits market has been segmented as follows.
By Type:
- Matrix Body
- Steel Body
By Size of PDC Cutter:
- Less than 9 mm
- 9¢14 mm
- 15¢24 mm
- Above 24 mm
By Number of Blades:
- Less than 6
- 6¢10
- Above 10
By Region:
- North America
- Asia Pacific
- Europe
- South America
- Middle East
- Africa
Available Customizations:
With the given market data, MarketsandMarkets offers customizations as per the clientÆs specific needs. The following customization options are available for this report:
Regional Analysis
Further breakdown of region-/country-specific analyses
Company Information
Detailed analyses and profiling of additional market players (up to 5)
The global PDC drill bits market is estimated to grow at a CAGR of 4.41% from 2018 to 2023, to reach a projected market size of USD 4.54 Billion by 2023. The market growth is likely to be driven by the increase in oil & gas drilling activities around the world.
The report segments the PDC drill bits market, by type, into matrix body and steel body. The matrix body segment is estimated to hold the largest share of the market in 2017. The matrix body can withstand an impact load and is capable of drilling medium-hard to hard formations. These advantages are expected to drive the market for the matrix body type PDC drill bits.
The PDC drill bits market, by size of PDC cutter, is segmented into less than 9 mm, 9¢14 mm, 15¢24 mm, and above 24 mm. The 15¢24 mm market has the largest market share in 2017 and is estimated to grow at the highest rate during the forecast period. The 15¢24 mm PDC cutter is used for drilling medium-hard and hard formations with a higher ROP, which is one of the major driving factors for the growth of the 15¢24 mm market.
The report further segments the PDC drill bits market, by number of blades, into less than 6, 6¢10, and above 10. The 6¢10 number of blades are having the largest market share for PDC drill bits. Higher ROP and less down-time for 6¢10 number of blades are the major factors for the largest market share.
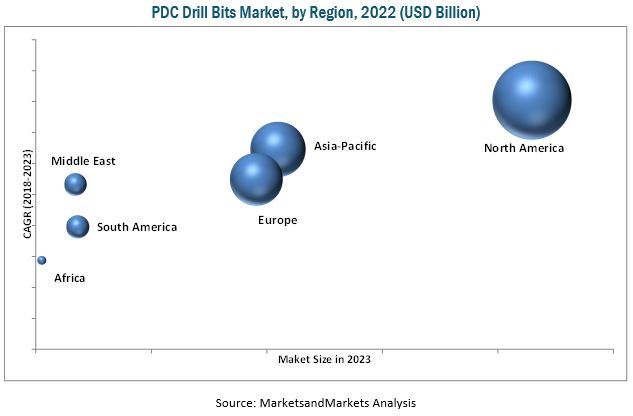
The US is estimated to be the largest and the fastest-growing market for PDC drill bits during the forecast period. The market growth in the region can be attributed to the recent developments in oil & gas drilling activities in the US, Canada, and Mexico. The increase in the shale gas exploration & production is also likely to boost the demand for PDC drill bits in the region during the forecast period.
The growth of the PDC drill bits market is hampered by the restrictions imposed by various government of different countries on hydrocarbon-based fuel sources.
The key players in PDC drill bits market include Schlumberger (US), BHGE (US), Halliburton (US), NOV (US), Varel (US), Atlas Caopco (Sweden), Ulterra (US), Torquato (US), Drill master international (US), Sichuan Chuanshi Diamond Bit (China), Rubicon Oilfield International (US), Western Drilling Tolls (Canada), Shear bits (Canada), Volgaburmash (Russia), and YPP (Iran).
These companies together hold a major share of the global PDC drill bits market.
To speak to our analyst for a discussion on the above findings, click Speak to Analyst
 Exclusive indicates content/data unique to MarketsandMarkets and not available with any competitors.
Table of Contents
1 Introduction (Page No. - 15)
1.1 Objectives of the Study
1.2 Market Definition
1.3 Market Scope
1.3.1 Markets Covered
1.3.2 Regional Scope
1.3.3 Years Considered for the Study
1.4 Currency
1.5 Stakeholders
2 Research Methodology (Page No. - 18)
2.1 Research Data
2.1.1 Secondary Data
2.1.1.1 Key Data From Secondary Sources
2.1.2 Primary Data
2.1.2.1 Key Data From Primary Sources
2.1.2.2 Key Industry Insights
2.1.2.3 Breakdown of Primaries
2.2 Market Size Estimation
2.3 Market Breakdown & Data Triangulation
2.4 Research Assumptions
2.5 Limitations
3 Executive Summary (Page No. - 26)
4 Premium Insights (Page No. - 30)
4.1 Attractive Opportunities in the PDC Drill Bits Market
4.2 PDC Drill Bits Market, By Country
4.3 North America: Market, By Country & Type
4.4 Market, By Type
4.5 Market, By Size of PDC Cutter
4.6 Market, By Number of Blades
5 Market Overview (Page No. - 35)
5.1 Introduction
5.1.1 Drivers
5.1.1.1 Increasing Drilling Activities
5.1.1.2 PDC Bits Can Reduce the Total Cost By Three-Fourths
5.1.2 Restraints
5.1.2.1 Environmental Risks and Strict Government Regulations for Hydrocarbon Based Fuel Sources
5.1.3 Opportunities
5.1.3.1 Growing Production of Shale Gas
5.1.4 Challenges
5.1.4.1 Crude Oil Prices
5.1.4.2 Overheating Owing to High Rop of PDC Drill Bits
6 Market, By Type (Page No. - 39)
6.1 Introduction
6.2 Matrix Body
6.3 Steel Body
7 Market, By Size of PDC Cutter (Page No. - 43)
7.1 Introduction
7.2 15¢24mm
7.3 9¢14mm
7.4 Above 24mm
7.5 Less Than 9mm
8 Market, By Number of Blades (Page No. - 48)
8.1 Introduction
8.2 6¢10
8.3 Less Than 6
8.4 Above 10
9 Market, By Region (Page No. - 52)
9.1 Introduction
9.2 North America
9.2.1 By Type
9.2.2 By Size of PDC Cutter
9.2.3 By Number of Blades
9.2.4 By Country
9.2.4.1 Us
9.2.4.2 Canada
9.2.4.3 Mexico
9.3 Asia Pacific
9.3.1 By Type
9.3.2 By Size of PDC Cutter
9.3.3 By Number of Blades
9.3.4 By Country
9.3.4.1 China
9.3.4.2 Thailand
9.3.4.3 India
9.3.4.4 Indonesia
9.3.4.5 Rest of Asia Pacific
9.4 Europe
9.4.1 By Type
9.4.2 By Size of PDC Cutter
9.4.3 By Number of Blades
9.4.4 By Country
9.4.4.1 Russia
9.4.4.2 UK
9.4.4.3 Norway
9.4.4.4 Rest of Europe
9.5 South America
9.5.1 By Type
9.5.2 By Size of PDC Cutter
9.5.3 By Number of Blades
9.5.4 By Country
9.5.4.1 Argentina
9.5.4.2 Venezuela
9.5.4.3 Brazil
9.5.4.4 Rest of South America
9.6 Middle East
9.6.1 By Type
9.6.2 By Size of PDC Cutter
9.6.3 By Number of Blades
9.6.4 By Country
9.6.4.1 Oman
9.6.4.2 Saudi Arabia
9.6.4.3 UAE
9.6.4.4 Iran
9.6.4.5 Rest of the Middle East
9.7 Africa
9.7.1 By Type
9.7.2 By Size of PDC Cutter
9.7.3 By Number of Blades
9.7.4 By Country
9.7.4.1 Egypt
9.7.4.2 Algeria
9.7.4.3 Angola
9.7.4.4 Nigeria
9.7.4.5 Rest of Africa
10 Competitive Landscape (Page No. - 86)
10.1 Introduction
10.2 Market Ranking Analysis
10.3 Competitive Scenario
10.3.1 New Product Launches
10.3.2 Contracts & Agreements
10.3.3 Others
11 Company Profile (Page No. - 90)
11.1 Benchmarking
(Business Overview, Products Offered, Recent Developments, MnM View)*
11.2 Schlumberger
11.3 Baker Hughes (A Ge Company) Bhge
11.4 Halliburton
11.5 NOV
11.6 Varel
11.7 Atlas Copco
11.8 Drill Master International
11.9 Rubicon Oilfield International
11.10 Sichuan Chuanshi Diamond Bit
11.11 Shear Bits
11.12 Torquato
11.13 Ulterra
11.14 Volgaburmash
11.15 Western Drilling Tools
11.16 YPP
*Business Overview, Products Offered, Recent Developments, MnM View Might Not Be Captured in Case of Unlisted Companies
12 Appendix (Page No. - 115)
12.1 Insights of Industry Experts
12.2 Discussion Guide
12.3 Knowledge Store: MarketsandmarketsÆ Subscription Portal
12.4 Introducing RT: Real-Time Market Intelligence
12.5 Available Customizations
12.6 Related Reports
12.7 Author Details
List of Tables (70 Tables)
Table 1 PDC Drill Bits Market Snapshot
Table 2 PDC Drill Bits Market Size, By Type, 2016¢2023 (USD Million)
Table 3 Matrix Body: Market, By Region, 2016¢2023 (USD Million)
Table 4 Steel Body: Market, By Region, 2016¢2023 (USD Million)
Table 5 PDC Drill Bits Market Size, By Size of PDC Cutter, 2016¢2023 (USD Million)
Table 6 15¢24mm: Market Size, By Region, 2016¢2023 (USD Million)
Table 7 9¢14mm: Market Size, By Region, 2016¢2023 (USD Million)
Table 8 Above 24mm: Market Size, By Region, 2016¢2023 (USD Million)
Table 9 Less Than 9mm: Market Size, By Region, 2016¢2023 (USD Million)
Table 10 PDC Drill Bits Market Size, By Number of Blades, 2016¢2023 (USD Million)
Table 11 6¢10: Market Size, By Region, 2016¢2023 (USD Million)
Table 12 Less Than 6: Market Size, By Region, 2016¢2023 (USD Million)
Table 13 Above 10: Market Size, By Region, 2016¢2023 (USD Million)
Table 14 PDC Drill Bit Market Size, By Region, 2016¢2023 (USD Million)
Table 15 Top Five Largest Countries: Market Size, 2016¢2023 (USD Million)
Table 16 Top Five Fastest Growing Countries: Market, 2016¢2023 (USD Million)
Table 17 North America: Market Size, By Country, 2016¢2023 (USD Million)
Table 18 North America: Market Size, By Type, 2016¢2023 (USD Million)
Table 19 North America: Market Size, By Size of PDC Cutter, 2016¢2023 (USD Million)
Table 20 North America: Market Size, By Number of Blades, 2016¢2023 (USD Million)
Table 21 US: Market Size, By Type, 2016¢2023 (USD Million)
Table 22 Canada: Market Size, By Type, 2016¢2023 (USD Million)
Table 23 Mexico: Market Size, By Type, 2016¢2023 (USD Million)
Table 24 Asia Pacific: Market Size, By Country, 2016¢2023 (USD Million)
Table 25 Asia Pacific: Market Size, By Type, 2016¢2023 (USD Million)
Table 26 Asia Pacific: Market Size, By Size of PDC Cutter, 2016¢2023 (USD Million)
Table 27 Asia Pacific: Market Size, By Number of Blades, 2016¢2023 (USD Million)
Table 28 China: Market Size, By Type, 2016¢2023 (USD Million)
Table 29 Thailand: Market Size, By Type, 2016¢2023 (USD Million)
Table 30 India: Market Size, By Type, 2016¢2023 (USD Million)
Table 31 Indonesia: Market Size, By Type, 2016¢2023 (USD Million)
Table 32 Rest of Asia Pacific: Market Size, By Type, 2016¢2023 (USD Million)
Table 33 Europe: Size, By Type, 2016¢2023 (USD Million)
Table 34 Europe: Market Size, By Size of PDC Cutter, 2016¢2023 (USD Million)
Table 35 Europe: Market Size, By Number of Blades, 2016¢2023 (USD Million)
Table 36 Europe: Market Size, By Country, 2016¢2023 (USD Million)
Table 37 Russia: Market Size, By Type, 2016¢2023 (USD Million)
Table 38 UK: Market Size, By Type, 2016¢2023 (USD Million)
Table 39 Norway: Market Size, By Type, 2016¢2023 (USD Million)
Table 40 Rest of Europe: Market Size, By Type, 2016¢2023 (USD Million)
Table 41 South America: Market Size, By Type, 2016¢2023 (USD Million)
Table 42 South America: Market Size, By Size of PDC Cutter, 2016¢2023 (USD Million)
Table 43 South America: Market Size, By Number of Blades, 2016¢2023 (USD Million)
Table 44 South America: Market Size, By Country, 2016¢2023 (USD Million)
Table 45 Argentina: Market Size, By Type, 2016¢2023 (USD Million)
Table 46 Venezuela: Market Size, By Type, 2016¢2023 (USD Million)
Table 47 Brazil: Market Size, By Type, 2016¢2023 (USD Million)
Table 48 Rest of South America: Market Size, By Type, 2016¢2023 (USD Million)
Table 49 Middle East: Market Size, By Country, 2016¢2023 (USD Million)
Table 50 Middle East: Market Size, By Type, 2016¢2023 (USD Million)
Table 51 Middle East: Market Size, By PDC Cutter Size, 2016¢2023 (USD Million)
Table 52 Middle East: Market Size, By Number of Blades, 2016¢2023 (USD Million)
Table 53 Oman: Market Size, By Type, 2016¢2023 (USD Million)
Table 54 Saudi Arabia: Market Size, By Type, 2016¢2023 (USD Million)
Table 55 UAE: Market Size, By Type, 2016¢2023 (USD Million)
Table 56 Iran: Market Size, By Type, 2016¢2023 (USD Million)
Table 57 Rest of the Middle East: Market Size, By Type, 2016¢2023 (USD Million)
Table 58 Africa: PDC Drill Bits Market Size, By Type, 2016¢2023 (USD Million)
Table 59 Africa: PDC Drill Bits, By Size of PDC Cutter, 2016¢2023 (USD Million)
Table 60 Africa: Market Size, By Number of Blades, 2016¢2023 (USD Million)
Table 61 Africa: Market Size, By Country, 2016¢2023 (USD Million)
Table 62 Egypt: Market Size, By Type, 2016¢2023 (USD Million)
Table 63 Algeria: PDC Drill Bits Market Size, By Type, 2016¢2023 (USD Million)
Table 64 Angola: Market Size, By Type, 2016¢2023 (USD Million)
Table 65 Nigeria: Market Size, By Type, 2016¢2023 (USD Million)
Table 66 Rest of Africa: Market Size, By Type, 2016¢2023 (USD Million)
Table 67 Market Development Between 2015 and 2018
Table 68 New Product Launches, 2015¢2017
Table 69 Contracts & Agreements, 2016¢2017
Table 70 Others, 2014¢2017
List of Figures (38 Figures)
Figure 1 Markets Covered: PDC Drill Bits Market
Figure 2 PDC Drill Bits Market: Research Design
Figure 3 Breakdown of Primary Interviews: By Company Type, Designation, & Region
Figure 4 Market Size Estimation Methodology: Bottom-Up Approach
Figure 5 Market Size Estimation Methodology: Top-Down Approach
Figure 6 Data Triangulation Methodology
Figure 7 The North America LED the Market in 2017
Figure 8 The Matrix Body Segment is Expected to Dominate the Market During the Forecast Period
Figure 9 The 15¢24 Mm Segment is Expected to Lead the Market During the Forecast Period
Figure 10 The 6¢10 Segment is Expected to Dominate the Market During the Forecast Period
Figure 11 Increasing Oil & Gas Drilling Activities Across the World is Driving the Market During the Forecast Period
Figure 12 The US Market is Expected to Grow at the Highest CAGR During the Forecast Period
Figure 13 US Held the Largest Share of the Market in the North America in 2017
Figure 14 The Matrix Body Segment is Expected to Grow at the Highest CAGR During the Forecast Period
Figure 15 The 15-24 Mm Segment is Expected to Dominate the Market During the Forecast Period
Figure 16 The 6-10 Segment is Expected to Grow at the Highest CAGR During the Forecast Period
Figure 17 PDC Drill Bits: Drivers, Restraints, Opportunities, & Challenges
Figure 18 Energy Consumption By Region
Figure 19 The Matrix Body Type Segment is Expected to Dominate the Market During the Forecast Period (USD Million)
Figure 20 The 15¢24mm PDC Cutter Segment LED the Market in 2017
Figure 21 The 6¢10 Number of Blades Segment is Expected to Dominate the Market During the Forecast Period
Figure 22 Regional Snapshot: the Market in North America is Expected to Grow at the Highest CAGR During the Forecast Period
Figure 23 North America is Expected to Hold the Largest Share of the PDC Drill Bits Market During the Forecast Period
Figure 24 US LED the Market in 2017
Figure 25 Asia Pacific Market Snapshot
Figure 26 China: the Largest Market in Asia Pacific, 2017
Figure 27 Russia LED the Market in 2017
Figure 28 Argentina Held the Largest Market Share in South America Market, in 2017
Figure 29 Oman: the Largest Market in the Middle East, 2017
Figure 30 Egypt LED the Market in Africa, in 2017
Figure 31 Key Developments in the Market 2015¢2018
Figure 32 Schlumberger LED the Market in 2017
Figure 33 Benchmarking of Top 5 Players
Figure 34 Schlumberger: Company Snapshot
Figure 35 Bhge: Company Snapshot
Figure 36 Halliburton: Company Snapshot
Figure 37 NOV: Company Snapshot
Figure 38 Atlas Copco: Company Snapshot


Growth opportunities and latent adjacency in PDC Drill Bits Market