Oil Accumulator Market by Type (Bladder, Piston, and Diaphragm), Pressure Rating (Up to 6,000 Psi and Above 6,000 Psi), Onshore vs Offshore, Application (Blowout Preventer & Well Head Control, Offshore Rigs, and Mud Pumps), and Region - Global Forecast to 2023


[150 Pages Report] The global oil accumulator market was valued at USD 467.9 million in 2017; it is projected to reach USD 617.1 million by 2023, at a CAGR of 4.78%, during the forecast period. Digital revolution in the oil & gas industry and increased exploration and production activities in countries such as China, India, Australia, and Indonesia are driving the market for oil accumulators.
The years considered for the study are as follows:
- Base Year: 2017
- Estimated Year: 2018
- Projected Year: 2023
- Forecast Period: 2018�2023
The base year considered for company profiles is 2016/17. Whenever information was unavailable for the base year, the prior year has been considered.
Objectives of the Study
- To define, describe, and forecast the oil accumulator market on the basis of type, pressure rating, onshore vs. offshore, application, and region
- To provide detailed information about the major factors influencing the growth of the market (drivers, restraints, opportunities, and industry-specific challenges)
- To strategically analyze the oil accumulator market with respect to individual growth trends, future projections, and the contribution of each segment to the market
- To track and analyze competitive developments such as contracts & agreements, new product launches, expansions & investments, mergers & acquisition, strategic alliances, and partnerships & collaborations in the oil accumulator market
- To profile key players and comprehensively analyze their market ranking and core competencies
Research Methodology
This research study involved the use of extensive secondary sources, directories, and databases, such as Hoover�s, Bloomberg Businessweek, Factiva, and OneSource, to identify and collect information useful for a technical, market-oriented, and commercial study of the oil accumulator market. Primary sources are mainly industry experts from the core and related industries, preferred suppliers, manufacturers, distributors, service providers, technology developers, standards and certification organizations of companies, and organizations related to all the segments of this industry�s value chain. The points given below explain the research methodology.
- Study of the annual revenues and market developments of the major players that manufacture oil accumulators
- Assessment of future trends and growth of end-users
- Assessment of the oil accumulator market with respect to the technology used for different applications
- Study of contracts & developments related to the oil accumulator market by key players across different regions
- Finalization of the overall market sizes by triangulating the supply-side data, which includes product developments, supply chain, and annual revenues of companies supplying oil accumulator across the globe
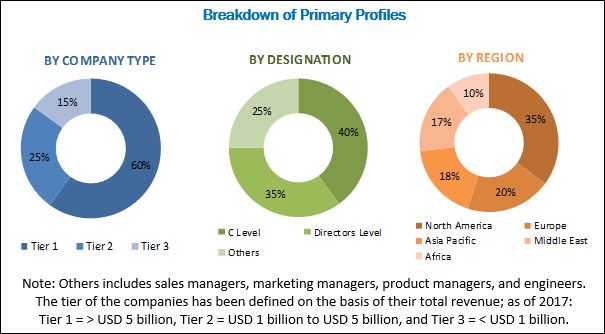
After arriving at the overall market size, the total market has been split into several segments and subsegments. The figure given below illustrates the breakdown of primaries conducted during the research study, based on the company type, designation, and region.
To know about the assumptions considered for the study, download the pdf brochure
Some of the leading global manufacturers of oil accumulator market are Hydac (Germany), Parker Hannifin (US), Eaton (Ireland), Freudenberg (Germany), Bosch Rexroth (Germany), and Nippon Accumulator (Japan).
Target Audience:
The report�s target audience includes:
- Oil & gas manufacturing companies
- Consulting companies in the power and oil & gas sector
- Engineering, procurement, and construction contractors
- Government and research organizations
- Energy and environmental associations
- Water Industry Forum
- State- or government-owned corporations
- Power distribution companies
The scope of the report:
- By Type
- Bladder Accumulator
- Piston Accumulator
- Diaphragm Accumulator
- By Pressure Rating
- Up to 6,000 Psi
- Above 6,000 Psi
- By Onshore Vs Offshore
- Up to 6,000 Psi
- Above 6,000 Psi
- By Application
- Blow out preventer & well head control
- Offshore rigs
- Mud pumps
- By Region
- Asia Pacific
- Europe
- North America
- Middle East
- Africa
- South America
Available Customizations:
With the given market data, MarketsandMarkets offers customizations as per the client�s specific needs. The following customization options are available for the report:
Regional Analysis
- Further breakdown of region-/country-specific analysis
Company Information
- Detailed analysis and profiling of additional market players (up to 5)
The oil accumulator is estimated to reach a market size of USD 488.5 million in 2018 and is projected to reach USD 617.1 million by 2023, at a CAGR of 4.78%, from 2018 to 2023. Increase in exploration and production activities in countries such as China, India, Australia, US, and Indonesia are the key factors driving the oil accumulator market, during the forecast period.
The report segments the oil accumulator market, by pressure range, into up to 6,000 psi and above 6,000 psi. The up to 6,000 psi led the market in 2017. The up to 6,000 psi market is mainly driven due to application of multiple units in place of a single unit to avoid idle time during production or drilling.
The global oil accumulator market, by type, has been segmented into bladder, piston, and diaphragm. The bladder segment is expected be the largest market during the forecast period. The growing demand for bladder accumulators is attributed to the increased Exploration and Production (E&P) spending and use in Blow Out Preventer (BOP) applications worldwide, which are driving the bladder accumulator market. High investment in onshore and offshore activities in emerging economies will create new revenue pockets for the market.
The report further segments the oil accumulator market, by application, into blow out preventer & well head control, offshore rigs, and mud pumps. The blow out preventer & well head control segment is expected to grow at the highest CAGR during the forecast period. BOPs are used in both onshore and offshore activities. North America led the BOPs & Well Head Control market because of the increase in exploration and drilling activities.
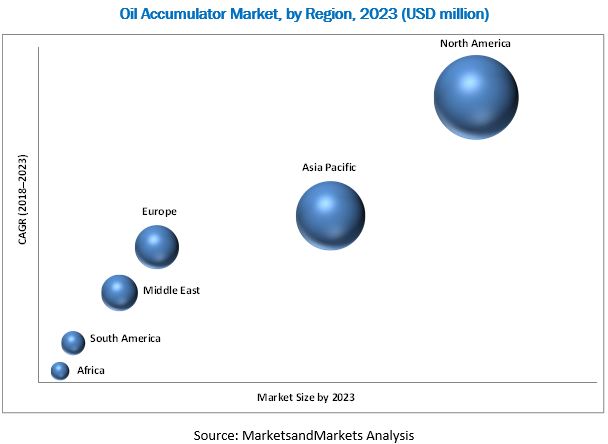
In this report, the oil accumulator market has been analyzed with respect to 5 regions, namely, Asia Pacific, Europe, North America, South America, and the Middle East & Africa. North America is expected to dominate the market, during the forecast period because of massive shale deposits in the US and continuous offshore drilling activities in the Gulf of Mexico. The figure given below shows the projected market sizes of various regions with respective CAGRs for 2023.
The major factor restraining the growth of the oil accumulator market is transition to renewable sources of energy.
Some of the leading players in the oil accumulator market are Hydac (Germany), Parker Hannifin (US), Eaton (Ireland), Freudenberg (Germany), Bosch Rexroth (Germany), and Nippon Accumulator (Japan). These players have adopted growth strategies such as contracts & agreements, mergers & acquisitions, and partnership & collaborations to capture a larger share of the oil accumulator market.
To speak to our analyst for a discussion on the above findings, click Speak to Analyst
 Exclusive indicates content/data unique to MarketsandMarkets and not available with any competitors.
Table of Contents
1 Introduction (Page No. - 14)
1.1 Objectives of the Study
1.2 Definition
1.3 Market Scope
1.3.1 Market Segmentation
1.3.2 Regional Scope
1.4 Years Considered for the Study
1.5 Currency
1.6 Limitation
1.7 Stakeholders
2 Research Methodology (Page No. - 17)
2.1 Research Data
2.1.1 Secondary Data
2.1.1.1 Secondary Sources
2.1.2 Primary Data
2.1.2.1 Key Data From Primary Sources
2.1.2.2 Key Data From Primary Sources
2.1.2.3 Breakdown of Primaries
2.2 Market Size Estimation
2.2.1 Bottom-Up Approach
2.2.2 Top-Down Approach
2.3 Market Breakdown & Data Triangulation
2.4 Research Assumptions
3 Executive Summary (Page No. - 25)
4 Premium Insights (Page No. - 28)
4.1 Attractive Opportunities in the Oil Accumulator Market, 2018�2023
4.2 Market, By Region, 2017
4.3 Market, By Application, 2018 � 2023
4.4 Market, By Type, 2018 � 2023
4.5 Market, By Pressure Rating, 2017
5 Market Overview (Page No. - 31)
5.1 Introduction
5.2 Market Dynamics
5.2.1 Drivers
5.2.1.1 Digital Revolution in the Oil & Gas Industry
5.2.1.2 Shale Gas Exploration Boom in the US:
5.2.2 Restraints
5.2.2.1 Transition to Renewable Sources of Energy:
5.2.3 Opportunities
5.2.3.1 Offshore Discoveries
5.2.4 Challenges
5.2.4.1 Oversupply of Oil
6 Market, By Type (Page No. - 35)
6.1 Introduction
6.2 Bladder
6.3 Piston
6.4 Diaphragm
7 Market, By Pressure Rating (Page No. - 39)
7.1 Introduction
7.2 Above 6,000 Psi
7.3 Up to 6,000 Psi
8 Market, By Onshore vs Offshore (Page No. - 43)
8.1 Introduction
8.2 Onshore
8.3 Offshore
9 Market, By Application (Page No. - 48)
9.1 Introduction
9.2 Bop & Wellhead Control
9.3 Offshore Rig
9.4 Mud Pumps
10 Market, By Region (Page No. - 52)
10.1 Introduction
10.2 Asia Pacific
10.2.1 By Type
10.2.2 By Application
10.2.3 By Pressure Rating
10.2.4 By Onshore
10.2.5 By Offshore
10.2.6 By Country
10.2.6.1 China
10.2.6.2 India
10.2.6.3 Malaysia
10.2.6.4 Australia
10.2.6.5 Indonesia
10.2.6.6 Rest of Asia Pacific
10.3 North America
10.3.1 By Type
10.3.2 By Application
10.3.3 By Pressure Rating
10.3.4 By Onshore
10.3.5 By Offshore
10.3.6 By Country
10.3.6.1 US
10.3.6.2 Canada
10.3.6.3 Mexico
10.4 Europe
10.4.1 By Type
10.4.2 By Application
10.4.3 By Pressure Rating
10.4.4 By Onshore
10.4.5 By Offshore
10.4.6 By Country
10.4.6.1 Norway
10.4.6.2 UK
10.4.6.3 Rest of Europe
10.5 South America
10.5.1 By Type
10.5.2 By Application
10.5.3 By Pressure Rating
10.5.4 By Onshore
10.5.5 By Offshore
10.5.6 By Country
10.5.6.1 Brazil
10.5.6.2 Argentina
10.5.6.3 Venezuela
10.5.6.4 Rest of South America
10.6 Middle East
10.6.1 By Type
10.6.2 By Application
10.6.3 By Pressure Rating
10.6.4 By Onshore
10.6.5 By Offshore
10.6.6 By Country
10.6.6.1 Saudi Arabia
10.6.6.2 Oman
10.6.6.3 UAE
10.6.6.4 Kuwait
10.6.6.5 Rest of the Middle East
10.7 Africa
10.7.1 By Type
10.7.2 By Application
10.7.3 By Pressure Rating
10.7.4 By Onshore
10.7.5 By Offshore
10.7.6 By Country
10.7.6.1 Nigeria
10.7.6.2 Angola
10.7.6.3 Egypt
10.7.6.4 Algeria
10.7.6.5 Rest of Africa
11 Competitive Landscape (Page No. - 91)
11.1 Overview
11.2 Ranking of Players and Industry Concentration, 2017
11.3 Competitive Scenario
11.3.1 New Product Launches
11.3.2 Investments & Expansions
11.3.3 Mergers & Acquisitions
11.3.4 Contracts & Agreements
11.3.5 Others
12 Company Profile (Page No. - 95)
12.1 Benchmarking
(Business Overview, Products Offered, Recent Developments, MnM View)*
12.2 Eaton
12.3 Parker Hannifin
12.4 Bosch
12.5 Hydac
12.6 Freudenberg
12.7 Nippon Accumulators
12.8 Technetics Group
12.9 Hannon Hydraulics
12.10 Rotec Hydraulics
12.11 Roth Hydraulics
12.12 Accumulators
12.13 Hydroll
*Details on Business Overview, Products Offered, Recent Developments, MnM View Might Not Be Captured in Case of Unlisted Companies.
13 Appendix (Page No. - 115)
13.1 Insights of Industry Experts
13.2 Discussion Guide
13.3 Knowledge Store: Marketsandmarkets� Subscription Portal
13.4 Introducing RT: Real-Time Market Intelligence
13.5 Available Customizations
13.6 Related Reports
13.7 Author Details
List of Tables (82 Tables)
Table 1 Oil Accumulator Market Snapshot
Table 2 Shale Reserves, By Key Country, 2016
Table 3 Oil Accumulator Market Size, By Type, 2016�2023 (USD Million)
Table 4 Bladder Accumulator Market Size, By Region, 2016�2023 (USD Million)
Table 5 Piston Accumulator Market Size, By Region, 2016�2023 (USD Million)
Table 6 Diaphragm Accumulator Market Size, By Region, 2016�2023 (USD Million)
Table 7 Oil Accumulator Market Size, By Pressure Rating, 2016�2023 (USD Million)
Table 8 Above 6,000 Psi: Market Size, By Region, 2016�2023 (USD Million)
Table 9 Up to 6,000 Psi: Market Size, By Region, 2016�2023 (USD Million)
Table 10 Oil Accumulator Market Size, By Onshore and Offshore, 2016�2023 (USD Million)
Table 11 Onshore Up to 6,000 Psi: Market Size, By Region, 2016�2023 (USD Million)
Table 12 Onshore Above 6,000 Psi: Market Size, By Region, 2016�2023 (USD Million)
Table 13 Offshore Up to 6,000 Psi: Market Size, By Region, 2016�2023 (USD Million)
Table 14 Offshore Above 6,000 Psi: Market Size, By Region, 2016�2023 (USD Million)
Table 15 Oil Accumulator Market Size, By Application, 2016�2023 (USD Million)
Table 16 Bop & Wellhead Control Market Size, By Region, 2016�2023 (USD Million)
Table 17 Offshore Rig Market Size, By Region, 2016�2023 (USD Million)
Table 18 Mud Pumps Market Size, By Region, 2016�2023 (USD Million)
Table 19 Oil Accumulator Market Size, By Region, 2016�2023 (USD Million)
Table 20 Asia Pacific: Market Size, By Type, 2016�2023 (USD Million)
Table 21 Asia Pacific: Market Size, By Application, 2016�2023 (USD Million)
Table 22 Asia Pacific: Market Size, By Pressure Rating, 2016�2023 (USD Million)
Table 23 Asia Pacific: Market Size, By Onshore, 2016�2023 (USD Million)
Table 24 Asia Pacific: Market Size, By Offshore, 2016�2023 (USD Million)
Table 25 Asia Pacific: Market Size, By Country, 2016�2023 (USD Million)
Table 26 China: Oil Accumulator Market Size, By Type, 2016�2023 (USD Million)
Table 27 India: Market Size, By Type, 2016�2023 (USD Million)
Table 28 Malaysia: Market Size, By Type, 2016�2023 (USD Million)
Table 29 Australia: Market Size, By Type, 2016�2023 (USD Million)
Table 30 Indonesia: Market Size, By Type, 2016�2023 (USD Million)
Table 31 Rest of Asia Pacific: Oil Accumulator Market Size, By Type, 2016�2023 (USD Million)
Table 32 North America: Market Size, By Type, 2016�2023 (USD Million)
Table 33 North America: Market Size, By Application, 2016�2023 (USD Million)
Table 34 North America: Market Size, By Pressure Rating, 2016�2023 (USD Million)
Table 35 North America: Market Size, By Onshore, 2016�2023 (USD Million)
Table 36 North America: Market Size, By Offshore, 2016�2023 (USD Million)
Table 37 North America: Oil Accumulator Market Size, By Country, 2016�2023 (USD Million)
Table 38 US: Market Size, By Type, 2016�2023 (USD Million)
Table 39 Canada: Market Size, By Type, 2016�2023 (USD Million)
Table 40 Mexico: Market Size, By Type, 2016�2023 (USD Million)
Table 41 Europe: Market Size, By Type, 2016�2023 (USD Million)
Table 42 Europe: Market Size, By Application, 2016�2023 (USD Million)
Table 43 Europe: Market Size, By Pressure Rating, 2016�2023 (USD Million)
Table 44 Europe: Market Size, By Onshore, 2016�2023 (USD Million)
Table 45 Europe: Oil Accumulator Market Size, By Offshore, 2016�2023 (USD Million)
Table 46 Europe: Market Size, By Country, 2016�2023 (USD Million)
Table 47 Norway: Market Size, By Type, 2016�2023 (USD Million)
Table 48 UK: Market Size, By Type, 2016�2023 (USD Million)
Table 49 Rest of Europe: Market Size, By Type, 2016�2023 (USD Million)
Table 50 South America: Market Size, By Type, 2016�2023 (USD Million)
Table 51 South America: Market Size, By Application, 2016�2023 (USD Million)
Table 52 South America: Market Size, By Pressure Rating, 2016�2023 (USD Million)
Table 53 South America: Market Size, By Onshore, 2016�2023 (USD Million)
Table 54 South America: Market Size, By Offshore, 2016�2023 (USD Million)
Table 55 Souht America: Oil Accumulator Market Size, By Country, 2016�2023 (USD Million)
Table 56 Brazil: Market Size, By Type, 2016�2023 (USD Million)
Table 57 Argentina: Market Size, By Type, 2016�2023 (USD Million)
Table 58 Venezuela: Market Size, By Type, 2016�2023 (USD Million)
Table 59 Rest of South America: Market Size, By Type, 2016�2023 (USD Million)
Table 60 Middle East: Market Size, By Type, 2016�2023 (USD Million)
Table 61 Middle East: Market Size, By Application, 2016�2023 (USD Million)
Table 62 Middle East: Market Size, By Pressure Rating, 2016�2023 (USD Million)
Table 63 Middle East: Market Size, By Onshore, 2016�2023 (USD Million)
Table 64 Middle East: Market Size, By Offshore, 2016�2023 (USD Million)
Table 65 Middle East: Oil Accumulator Market Size, By Country, 2016�2023 (USD Million)
Table 66 Saudi Arabia: Market Size, By Type, 2016�2023 (USD Million)
Table 67 Oman: Market Size, By Type, 2016�2023 (USD Million)
Table 68 UAE: Market Size, By Type, 2016�2023 (USD Million)
Table 69 Kuwait: Market Size, By Type, 2016�2023 (USD Million)
Table 70 Rest of the Middle East: Market Size, By Type, 2016�2023 (USD Million)
Table 71 Africa: Market Size, By Type, 2016�2023 (USD Million)
Table 72 Africa: Market Size, By Application, 2016�2023 (USD Million)
Table 73 Africa: Market Size, By Pressure Rating, 2016�2023 (USD Million)
Table 74 Africa: Market Size, By Onshore, 2016�2023 (USD Million)
Table 75 Africa: Market Size, By Offshore, 2016�2023 (USD Million)
Table 76 Africa: Oil Accumulator Market Size, By Country, 2016�2023 (USD Million)
Table 77 Nigeria: Market Size, By Type, 2016�2023 (USD Million)
Table 78 Angola: Market Size, By Type, 2016�2023 (USD Million)
Table 79 Egypt: Market Size, By Type, 2016�2023 (USD Million)
Table 80 Algeria: Market Size, By Type, 2016�2023 (USD Million)
Table 81 Rest of Africa: Market Size, By Type, 2016�2023 (USD Million)
Table 82 Hydac Was the Most Active Players in the Market Between 2014 and 2018
List of Figures (31 Figures)
Figure 1 Research Design
Figure 2 Breakdown of Primaries: By Company Type, Designation, and Region
Figure 3 Bottom-Up Approach
Figure 4 Top-Down Approach
Figure 5 Data Triangulation Methodology
Figure 6 Assumptions of the Research Study
Figure 7 The North American Market Dominated the Oil Accumulator Market in 2017
Figure 8 The Bop & Wellhead Control Segment to Lead the Market, By Application, During the Forecast Period
Figure 9 Bladder Accumulator to Dominate the Market, By Type, During the Forecast Period
Figure 10 Up to 6,000 Psi to Lead the Market, By Pressure Rating, During the Forecast Period
Figure 11 Digital Revolution in Oil & Gas is Expected to Drive the Market During the Forecast Period
Figure 12 North America and Asia Pacific Were the Largest Markets in 2017
Figure 13 The Bop & Wellhead Control Segment to Account for the Largest Market Size During the Forecast Period
Figure 14 The Bladder Segment to Lead the Market During the Forecast Period
Figure 15 US Were the Largest Market in North America, 2017
Figure 16 Digital Revolution Driving the Demand for Market
Figure 17 Shale Production (2007�2017)
Figure 18 Oil Accumulator Market Share, By Type, 2017
Figure 19 Up to 6,000 Psi Segment Dominated the Market, By Pressure Rating, 2017
Figure 20 The Onshore Segment to Account for the Larger Market Share in 2018
Figure 21 Oil Accumulator Market Share, By Application, 2017
Figure 22 Regional Snapshot: the Market in North America is Expected to Register the Highest CAGR During the Forecast Period
Figure 23 Oil Accumulator Market Share (Value), By Region, 2017
Figure 24 Asia Pacific: Market Snapshot
Figure 25 North America: Market Snapshot
Figure 26 Key Developments in the Market, 2014�2018
Figure 27 Hydac Led the Market in 2017
Figure 28 Eaton: Company Snapshot
Figure 29 Parker Hannifin: Company Snapshot
Figure 30 Bosch: Company Snapshot
Figure 31 Freudenberg: Company Snapshot


Growth opportunities and latent adjacency in Oil Accumulator Market