Natural Surfactants Market (Bio-based Surfactants) by Product Type (Anionic, Nonionic, Cationic, and Amphoteric), Application (Detergents, Personal Care, Industrial & Institutional cleaning, and Oilfield Chemicals), and Region - Global Forecast to 2022


Natural Surfactants Market Size And Forecast
The natural surfactants market (bio-based surfactants) is projected to reach USD 17.27 Billion by 2022, at a CAGR of 5.1%. The base year considered for this study on the natural surfactant market (bio-based surfactants) is 2016, while the forecast period is between 2017 and 2022.
Objectives of the Natural Surfactants Market Report
- To define, describe, and forecast the natural surfactants market (bio-based surfactants) in terms of value and volume
- To provide detailed information regarding the key factors (drivers, restraints, opportunities, and challenges) influencing the growth of the market
- To analyze and forecast the market size of natural surfactants (bio-based surfactants) on the basis of product type, application, and region
- To forecast the market size with respect to five main regions, namely, North America, Europe, Asia Pacific (APAC), the Middle East & Africa, and South America along with key countries of these regions
- To strategically analyze micromarkets1 with respect to individual growth trends, prospects, and contribution to the overall market
- To strategically profile the key players and comprehensively analyze their recent developments such as new product launches, expansions, and mergers & acquisitions in the natural surfactants market (bio-based surfactants)
Both, top-down and bottom-up approaches have been used to estimate and validate the size of the natural surfactant market (bio-based surfactants), and to determine the sizes of various other dependent submarkets. The research study involves the extensive use of secondary sources, directories, and databases, such as Hoovers, Bloomberg, Chemical Weekly, Factiva, and other government and private websites, to identify and collect information useful for the technical, market-oriented, and commercial study of the natural surfactants market (bio-based surfactants).
To know about the assumptions considered for the study, download the pdf brochure
BASF (Germany), The Dow Chemical Company (US), Croda International (UK), Huntsman Corporation (US), Clariant (Switzerland), Stepan Company (US) and Kao Corporation (Japan) are some of the key players operating in the natural surfactants (bio-based surfactants) market.
Key Target Audience in Natural Surfactants Market
- Suppliers of Raw Materials
- Manufacturers of Natural surfactants (bio-based surfactants)
- Traders, Distributors, and Suppliers of Natural surfactants (bio-based surfactants)
- Government & Regional Agencies
- Research Organizations
- Investment Research Firms of Composites
Natural Surfactants Market Report Scope
This research report categorizes the natural surfactants market (bio-based surfactants) on the basis of product type, application, and region.
Natural surfactant Market (bio-based surfactants), by Product Type:
- Anionic Natural surfactants (bio-based surfactants)
- Nonionic Natural surfactants (bio-based surfactants)
- Cationic Natural surfactants (bio-based surfactants)
- Amphoteric Natural surfactants (bio-based surfactants)
Natural surfactants Market (bio-based surfactants), by Application:
- Detergents
- Personal Care
- Industrial & Institutional Cleaning
- Oilfield Chemicals
- Agricultural Chemicals
- Others
Natural surfactants Market (bio-based surfactants), by Region:
- North America
- Europe
- APAC
- South America
- Middle East & Africa
The market has been further analyzed for the key countries in each of these regions.
Natural Surfactants Market Report Available Customizations
With the given market data, MarketsandMarkets offers customizations according to the specific needs of the companies. The following customization options are available for the report:
Regional Analysis:
- Further breakdown of the regional natural surfactants market (bio-based surfactants) into the key countries
Company Information:
- Detailed analysis and profiles of additional market players
Product Analysis
- Product matrix, which gives a detailed comparison of the product portfolio of each company
The natural surfactants market (bio-based surfactants) is estimated to be USD 13.47 Billion in 2017 and is projected to reach USD 17.27 Billion by 2022, at a CAGR of 5.1% between 2017 and 2022. Implementation of stringent regulations on using conventional surfactants is driving the natural surfactant market (bio-based surfactants) in different applications. The growing use of natural surfactants (bio-based surfactants) in detergents, personal care, and oilfield chemicals is also fueling the growth of the natural surfactants market (bio-based surfactants), globally.
Based on product type, the nonionic natural surfactants (bio-based surfactants) segment of the natural surfactants market (bio-based surfactants) is projected to register the highest CAGR during the forecast period. The growth of this segment can be attributed to their end use in fabric softeners, shampoos, and body wash, which is increasing with the growth in the textile and personal care industries.
Based on application, personal care is projected to be the fastest-growing application of natural surfactants (bio-based surfactants) during the forecast period. Increasing consumer awareness of the usage of bio-based ingredients is expected to drive the demand for natural surfactants (bio-based surfactants) in this segment.
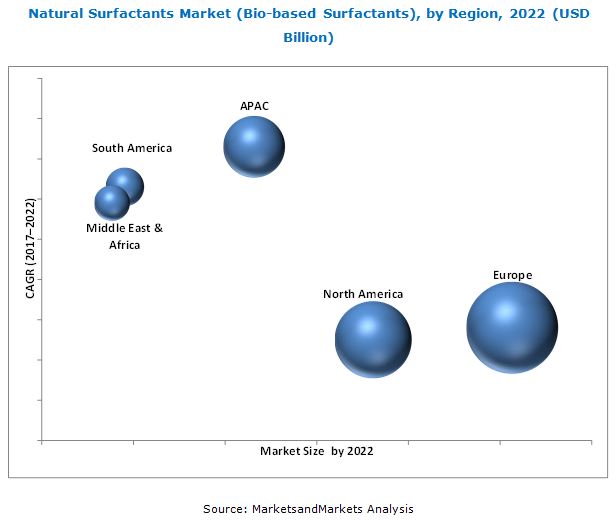
Europe accounted for the largest share of the natural surfactants market (bio-based surfactants) in 2016, followed by North America. Increased demand for natural surfactants (bio-based surfactants) from Europe can be attributed to the rapidly growing applications, such as detergents, personal care, and oilfield chemicals. The demand for less toxic and highly biodegradable products due to rising concerns regarding environmental protection is the major reason for the high demand for natural surfactants (bio-based surfactants) in Europe.
Time-consuming and expensive legislative requirements are seen as a major restraint in the natural surfactant market (bio-based surfactants) . Several manufacturers develop newer products to be competitive in the market, but compliance with the regulatory mandates for every product would be time-consuming and costly.
Companies operating in the natural surfactants market (bio-based surfactants) include AkzoNobel (Netherlands), BASF (Germany), The Dow Chemical Company (US), Croda International (UK), Huntsman (US), Clariant (Switzerland),Stepan Company (US) and Kao Corporation (Japan). These players have adopted strategies such as new product launches, expansions, and mergers & acquisitions to enhance their market shares and expand their distribution networks, globally. These companies engage in R&D activities to innovate and develop products that can open avenues for new end-use industries. For instance, in October 2017, Clariant has developed a new product GlucoPure, which is a renewable surfactant used in hand dishwashing liquid. In February 2016, Air Products and Chemicals Company added two new products to its additives portfolio, namely, Surfynol 107L surfactant and ZetaSperse 3800 dispersant. The addition of these products has helped the company expand its offerings for formulators. These developments have helped enhance the company’s product portfolio.
Frequently Asked Questions (FAQ):
How big is the natural surfactants market industry?
The natural surfactants market (bio-based surfactants) is projected to reach USD 17.27 Billion by 2022, at a CAGR of 5.1% between 2017 and 2022
Who leading market players in natural surfactants industry?
Key companies profiled in natural surfactants market research report on the natural surfactants market (bio-based surfactants) include BASF (Germany), The Dow Chemical Company (US), Croda International (UK), Huntsman Corporation (US), Clariant (Switzerland), Stepan Company (US) and Kao Corporation (Japan).
To speak to our analyst for a discussion on the above findings, click Speak to Analyst
 Exclusive indicates content/data unique to MarketsandMarkets and not available with any competitors.
Table of Contents
1 Introduction (Page No. - 15)
1.1 Objectives of the Study
1.2 Market Definition
1.3 Market Scope
1.3.1 Years Considered for the Study
1.4 Currency
1.5 Units Considered
1.6 Limitations
1.7 Stakeholders
2 Research Methodology (Page No. - 19)
2.1 Research Data
2.1.1 Secondary Data
2.1.1.1 Key Data From Secondary Sources
2.1.2 Primary Data
2.1.2.1 Key Data From Primary Sources
2.1.2.2 Key Industry Insights
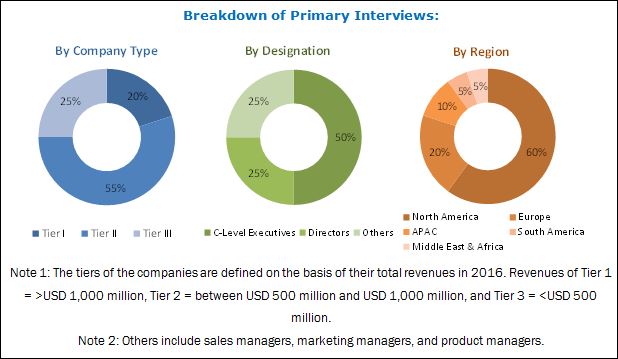
2.1.2.3 Breakdown of Primary Interviews
2.2 Market Size Estimation
2.2.1 Bottom-Up Approach
2.2.2 Top-Down Approach
2.3 Data Triangulation
2.4 Assumptions
3 Executive Summary (Page No. - 27)
4 Premium Insights (Page No. - 30)
4.1 Attractive Opportunities in Bio-Based Surfactants Market
4.2 European Bio-Based Surfactants Market, By Product Type and Country
4.3 Bio-Based Surfactants Market, By Application
4.4 Bio-Based Surfactants Market, By Region
5 Market Overview (Page No. - 32)
5.1 Introduction
5.1.1 Drivers
5.1.1.1 Stringent Regulations on Using Conventional Surfactants
5.1.2 Restraints
5.1.2.1 Time-Consuming and Expensive Legislative Requirements
5.1.3 Opportunities
5.1.3.1 High Growth Opportunities in Emerging Economies of APAC
5.1.4 Challenges
5.1.4.1 Consumers’ Reluctance to Pay A Bio-Premium
5.2 Porter’s Five Forces Analysis
5.2.1 Threat of New Entrants
5.2.2 Threat of Substitutes
5.2.3 Bargaining Power of Suppliers
5.2.4 Bargaining Power of Buyers
5.2.5 Intensity of Competitive Rivalry
6 Bio-Based Surfactants Market, By Product Type (Page No. - 38)
6.1 Introduction
6.2 Anionic Bio-Based Surfactants
6.2.1 Alcohol Ether Sulfates (AES)
6.2.1.1 Sodium Lauryl Ether Sulfate (SLES)
6.2.1.2 Ammonium Lauryl Ether Sulfate (ALES)
6.2.2 Alcohol Sulfates (AS)
6.2.2.1 Sodium Lauryl Sulfate (SLS)
6.2.2.2 Ammonium Lauryl Sulfate(ALS)
6.2.3 Methyl Ester Sulfonates
6.3 Nonionic Bio-Based Surfactants
6.3.1 Ethoxylates
6.3.1.1 Alcohol Ethoxylates (AE)
6.3.1.2 Methyl Ester Ethoxylates (MEE)
6.3.1.3 Glyceride Ethoxylates
6.3.2 Alkyl Polyglycosides (Apg)
6.3.3 Sucrose Esters
6.3.4 Sorbitan Esters
6.4 Cationic Bio-Based Surfactants
6.4.1 Glycine Betaine Esters
6.4.2 Glycine Betaine Amides
6.5 Amphoteric Bio-Based Surfactants
6.5.1 Lauryl Betaine
6.5.2 Coco Betaine
7 Bio-Based Surfactants Market, By Application (Page No. - 48)
7.1 Introduction
7.2 Detergents
7.3 Personal Care
7.4 Industrial & Institutional Cleaning
7.5 Agricultural Chemicals
7.6 Others
8 Bio-Based Surfactants Market, By Region (Page No. - 57)
8.1 Introduction
8.2 North America
8.2.1 US
8.2.2 Canada
8.2.3 Mexico
8.3 Europe
8.3.1 Germany
8.3.2 France
8.3.3 Italy
8.3.4 UK
8.3.5 Spain
8.3.6 Netherlands
8.3.7 Rest of Europe
8.4 APAC
8.4.1 China
8.4.2 India
8.4.3 Japan
8.4.4 South Korea
8.4.5 Malaysia
8.4.6 Rest of APAC
8.5 South America
8.5.1 Brazil
8.5.2 Argentina
8.5.3 Rest of South America
8.6 Middle East & Africa
8.6.1 Saudi Arabia
8.6.2 UAE
8.6.3 South Africa
8.6.4 Rest of Middle East & Africa
9 Competitive Landscape (Page No. - 99)
9.1 Overview
9.2 Competitive Scenario
9.2.1 Expansion
9.2.2 New Product Development
9.2.3 Merger & Acquisition
9.2.4 Major Key Players in the Bio-Based Surfactants Market
10 Company Profiles (Page No. - 102)
(Overview, Financial*, Products & Services, Strategy, and Developments)
10.1 BASF
10.2 Dowdupont
10.3 Air Products and Chemicals
10.4 Stepan Company
10.5 Clariant
10.6 Croda International
10.7 Kao Corporation
10.8 Sasol
10.9 India Glycols
10.10 Galaxy Surfactants
10.11 Other Companies
10.11.1 Akzonobel N.V.
10.11.2 Solvay
10.11.3 Enaspol A.S.
*Details Might Not Be Captured in Case of Unlisted Companies
11 Appendix (Page No. - 126)
11.1 Insights From Industry Experts
11.2 Discussion Guide
11.3 Knowledge Store: Marketsandmarkets’ Subscription Portal
11.4 Introducing RT: Real-Time Market Intelligence
11.5 Available Customizations
11.6 Related Reports
11.7 Author Details
List of Tables (106 Tables)
Table 1 Bio-Based Surfactants Market Size, By Product Type, 2015–2022 (USD Million)
Table 2 Bio-Based Surfactants Market Size, By Product Type, 2015–2022 (Kiloton)
Table 3 Anionic Bio-Based Surfactants Market Size, By Region, 2015–2022 (USD Million)
Table 4 Anionic Bio-Based Surfactants Market Size, By Region, 2015–2022 (Kiloton)
Table 5 Nonionic Bio-Based Surfactants Market Size, By Region, 2015–2022 (USD Million)
Table 6 Nonionic Bio-Based Surfactants Market Size, By Region, 2015–2022 (Kiloton)
Table 7 Cationic Bio-Based Surfactants Market Size, By Region, 2015–2022 (USD Million)
Table 8 Cationic Bio-Based Surfactants Market Size, By Region, 2015–2022 (Kiloton)
Table 9 Amphoteric Bio-Based Surfactants Market Size, By Region, 2015–2022 (USD Million)
Table 10 Amphoteric Bio-Based Surfactants Market Size, By Region, 2015–2022 (Kiloton)
Table 11 Bio-Based Surfactants Market Size, By Application, 2015–2022 (USD Million)
Table 12 Bio-Based Surfactant Market Size, By Application, 2015–2022 (Kiloton)
Table 13 Bio-Based Surfactants Market Size in Detergents, By Region, 2015–2022 (USD Million)
Table 14 Bio-Based Surfactant Market Size in Detergents, By Region, 2015–2022 (Kiloton)
Table 15 Bio-Based Surfactants Market Size in Personal Care, By Region, 2015–2022 (USD Million)
Table 16 Bio-Based Surfactant Market Size in Personal Care, By Region, 2015–2022 (Kiloton)
Table 17 Bio-Based Surfactants Market Size in Industrial & Institutional Cleaning, By Region, 2015–2022 (USD Million)
Table 18 Bio-Based Surfactant Market Size in Industrial & Institutional Cleaning, By Region, 2015–2022 (Kiloton)
Table 19 Bio-Based Surfactants Market Size in Agricultural Chemicals, By Region, 2015–2022 (USD Million)
Table 20 Bio-Based Surfactant Market Size in Agricultural Chemicals, By Region, 2015–2022 (Kiloton)
Table 21 Bio-Based Surfactants Market Size in Oilfield Chemicals, By Region, 2015–2022 (USD Million)
Table 22 Bio-Based Surfactant Market Size in Oilfield Chemicals, By Region, 2015–2022 (Kiloton)
Table 23 Bio-Based Surfactants Market Size in Other Applications, By Region, 2015–2022 (USD Million)
Table 24 Bio-Based Surfactant Market Size in Other Applications, By Region, 2015–2022 (Kiloton)
Table 25 Bio-Based Surfactants Market Size, By Region, 2015–2022 (USD Million)
Table 26 Bio-Based Surfactant Market Size, By Region, 2015–2022 (Kiloton)
Table 27 North America: Natural Surfactants Market Size, By Country, 2015–2022 (USD Million)
Table 28 North America: Market Size, By Country, 2015–2022 (Kiloton)
Table 29 North America: Market Size, By Product Type, 2015–2022 (USD Million)
Table 30 North America: Market Size, By Product Type, 2015–2022 (Kiloton)
Table 31 North America: Market Size, By Application, 2015–2022 (USD Million)
Table 32 North America: Market Size, By Application, 2015–2022 (Kiloton)
Table 33 US: Natural Surfactant Market Size, By Application, 2015–2022 (USD Million)
Table 34 US: Market Size, By Application, 2015–2022 (Kiloton)
Table 35 Canada: Natural Surfactant Market Size, By Application, 2015–2022 (USD Million)
Table 36 Canada: By Market Size, By Application, 2015–2022 (Kiloton)
Table 37 Mexico: By Market Size, By Application, 2015–2022 (USD Million)
Table 38 Mexico: By Market Size, By Application, 2015–2022 (Kiloton)
Table 39 Europe: Natural Surfactant Market Size, By Country, 2015–2022 (USD Million)
Table 40 Europe: By Market Size, By Country, 2015–2022 (Kiloton)
Table 41 Europe: By Market Size, By Product Type, 2015–2022 (USD Million)
Table 42 Europe: By Market Size, By Product Type, 2015–2022 (Kiloton)
Table 43 Europe: By Market Size, By Application, 2015–2022 (USD Million)
Table 44 Europe: By Market Size, By Application, 2015–2022 (Kiloton)
Table 45 Germany: Natural Surfactants Market Size, By Application, 2015–2022 (USD Million)
Table 46 Germany: By Market Size, By Application, 2015–2022 (Kiloton)
Table 47 France: Natural Surfactant Market Size, By Application, 2015–2022 (USD Million)
Table 48 France: By Market Size, By Application, 2015–2022 (Kiloton)
Table 49 Italy: Natural Surfactants Market Size, By Application, 2015–2022 (USD Million)
Table 50 Italy: By Market Size, By Application, 2015–2022 (Kiloton)
Table 51 UK: Natural Surfactant Market Size, By Application, 2015–2022 (USD Million)
Table 52 UK: By Market Size, By Application, 2015–2022 (Kiloton)
Table 53 Spain: Bio-Based Surfactants Market Size, By Application, 2015–2022 (USD Million)
Table 54 Spain: Bio-Based Surfactant Market Size, By Application, 2015–2022 (Kiloton)
Table 55 Netherlands: Bio-Based Surfactants Market Size, By Application, 2015–2022 (USD Million)
Table 56 Netherlands: Bio-Based Surfactant Market Size, By Application, 2015–2022 (Kiloton)
Table 57 Rest of Europe: Bio-Based Surfactants Market Size, By Application, 2015–2022 (USD Million)
Table 58 Rest of Europe: Bio-Based Surfactant Market Size, By Application, 2015–2022 (Kiloton)
Table 59 APAC: Natural Surfactants Market Size, By Country, 2015–2022 (USD Million)
Table 60 APAC: Market Size, By Country, 2015–2022 (Kiloton)
Table 61 APAC: Market Size, By Product Type, 2015–2022 (USD Million)
Table 62 APAC: Market Size, By Product Type, 2015–2022 (Kiloton)
Table 63 APAC: Market Size, By Application, 2015–2022 (USD Million)
Table 64 APAC: Natural Surfactant Market Size, By Application, 2015–2022 (Kiloton)
Table 65 China: Natural Surfactants Market Size, By Application, 2015–2022 (USD Million)
Table 66 China: Market Size, By Application, 2015–2022 (Kiloton)
Table 67 India: Natural Surfactants Market Size, By Application, 2015–2022 (USD Million)
Table 68 India: Market Size, By Application, 2015–2022 (Kiloton)
Table 69 Japan: Natural Surfactants Market Size, By Application, 2015–2022 (USD Million)
Table 70 Japan: Market Size, By Application, 2015–2022 (Kiloton)
Table 71 South Korea: Natural Surfactants Market Size, By Application, 2015–2022 (USD Million)
Table 72 South Korea: Market Size, By Application, 2015–2022 (Kiloton)
Table 73 Malaysia: Natural Surfactants Market Size, By Application, 2015–2022 (USD Million)
Table 74 Malaysia: Market Size, By Application, 2015–2022 (Kiloton)
Table 75 Rest of APAC: Bio-Based Surfactants Market Size, By Application, 2015–2022 (USD Million)
Table 76 Rest of APAC: Bio-Based Surfactant Market Size, By Application, 2015–2022 (Kiloton)
Table 77 South America: Bio-Based Surfactants Market Size, By Country, 2015–2022 (USD Million)
Table 78 South America: Bio-Based Surfactant Market Size, By Country, 2015–2022 (Kiloton)
Table 79 South America: Bio-Based Surfactants Market Size, By Product Type, 2015–2022 (USD Million)
Table 80 South America: Bio-Based Surfactant Market Size, By Product Type, 2015–2022 (Kiloton)
Table 81 South America: Bio-Based Surfactants Market Size, By Application, 2015–2022 (USD Million)
Table 82 South America: Bio-Based Surfactant Market Size, By Application, 2015–2022 (Kiloton)
Table 83 Brazil: Bio-Based Surfactants Market Size, By Application, 2015–2022 (USD Million)
Table 84 Brazil: Bio-Based Surfactant Market Size, By Application, 2015–2022 (Kiloton)
Table 85 Argentina: Bio-Based Surfactants Market Size, By Application, 2015–2022 (USD Million)
Table 86 Argentina: Bio-Based Surfactant Market Size, By Application, 2015–2022 (Kiloton)
Table 87 Rest of South America: Natural Surfactants Market Size, By Application, 2015–2022 (USD Million)
Table 88 Rest of South America: Market Size, By Application, 2015–2022 (Kiloton)
Table 89 Middle East & Africa: Natural Surfactants Market Size, By Country, 2015–2022 (USD Million)
Table 90 Middle East & Africa: Market Size, By Country, 2015–2022 (Kiloton)
Table 91 Middle East & Africa: Market Size, By Product Type, 2015–2022 (USD Million)
Table 92 Middle East & Africa: Market Size, By Product Type, 2015–2022 (Kiloton)
Table 93 Middle East & Africa: Market Size, By Application, 2015–2022 (USD Million)
Table 94 Middle East & Africa: Market Size, By Application, 2015–2022 (Kiloton)
Table 95 Saudi Arabia: Natural Surfactants Market Size, By Application, 2015–2022 (USD Million)
Table 96 Saudi Arabia: Market Size, By Application, 2015–2022 (Kiloton)
Table 97 UAE: Natural Surfactants Market Size, By Application, 2015–2022 (USD Million)
Table 98 UAE: Market Size, By Application, 2015–2022 (Kiloton)
Table 99 South Africa: Natural Surfactants Market Size, By Application, 2015–2022 (USD Million)
Table 100 South Africa: Market Size, By Application, 2015–2022 (Kiloton)
Table 101 Rest of Middle East & Africa: Natural Surfactants Market Size, By Application, 2015–2022 (USD Million)
Table 102 Rest of Middle East & Africa: Market Size, By Application, 2015–2022 (Kiloton)
Table 103 Expansions, 2013–1017
Table 104 New Product Developments, 2013–2017
Table 105 Mergers & Acquisitions, 2013–2017
Table 106 Major Players in the Natural Surfactants Market, 2016
List of Figures (30 Figures)
Figure 1 Bio-Based Surfactants Market Segmentation
Figure 2 Bio-Based Surfactant Market: Research Design
Figure 3 Market Size Estimation: Bottom-Up Approach
Figure 4 Market Size Estimation: Top-Down Approach
Figure 5 Bio-Based Surfactants Market: Data Triangulation
Figure 6 Anionic Bio-Based Surfactants to Be the Largest Product Type
Figure 7 Detergents to Be the Largest Application During the Forecast Period
Figure 8 Europe Accounted for the Largest Share of Bio-Based Surfactants Market
Figure 9 Increaing Demand From Personal Care Application to Drive Bio-Based Surfactants Market
Figure 10 Anionic Bio-Based Surfactants to Be the Largest Product Type
Figure 11 Detergents to Account for the Largest Market Share During the Forecast Period 2017-2022
Figure 12 Europe Accounted for the Largest Share of Bio-Based Surfactants Market
Figure 13 Factors Governing the Bio-Based Surfactants Market
Figure 14 Porter’s Five Forces Analysis: Bio-Based Surfactants Market
Figure 15 Nonionic to Be the Fastest-Growing Bio-Based Surfactants Market
Figure 16 Personal Care Application to Register the Highest CAGR During Forecast Period 2017-2022
Figure 17 Developing Countries to Emerge as New Strategic Locations
Figure 18 North American Market Snapshot: US to Continue Leading the North American Bio-Based Surfactants Market
Figure 19 APAC Bio-Based Surfactants Market Snapshot: China to Continue Leading the APAC Bio-Based Surfactants Market
Figure 20 Companies Adopted New Product Development as Key Growth Strategy Between 2013 and 2017
Figure 21 BASF: Company Snapshot
Figure 22 Dowdupont: Company Snapshot
Figure 23 Air Products and Chemicals: Company Snapshot
Figure 24 Stepan Company: Company Snapshot
Figure 25 Clariant: Company Snapshot
Figure 26 Croda International: Company Snapshot
Figure 27 Kao: Company Snapshot
Figure 28 Sasol: Company Snapshot
Figure 29 India Glycols: Company Snapshot
Figure 30 Galaxy Surfactants: Company Snapshot


Growth opportunities and latent adjacency in Natural Surfactants Market