Mosquito Repellent Market by Repellent Type (Spray, Vaporizer, Cream & Oil, Coil, Mat), After Bite Type (Lotion, Balm, Gel, Roll-on), Distribution Channel (Hypermarket & Supermarket, Independent Stores, E-commerce) and Region (2021 - 2026)
Updated on : September 03, 2025
Mosquito Repellent Market
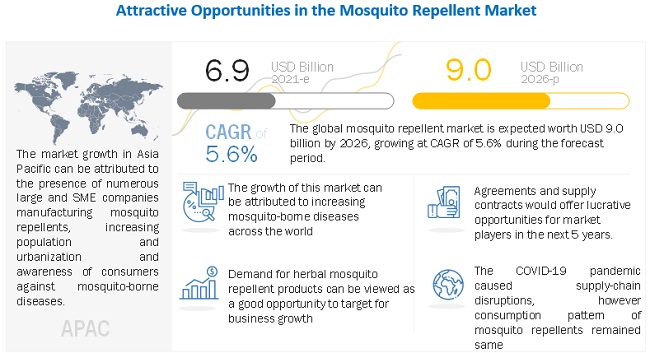
The global mosquito repellent market was valued at USD 6.9 billion in 2021 and is projected to reach USD 9.0 billion by 2026, growing at 5.6% cagr from 2021 to 2026. There is strong demand for mosquito repellants in developing countries due to rise in population and migration of people to urban areas. The demand is also driven by the evolution of rural areas to suburban areas which has caused the mosquitoes to adapt to changing environmental conditions. These mosquitoes are responsible for deadly diseases such as dengue, zika, and yellow fever not only in developed countries but also in developing nations of the world.
To know about the assumptions considered for the study, Request for Free Sample Report
COVID-19 Impact on the Global Mosquito Repellent Market
The mosquito repellent market includes major Tier I and II companies like SC Johnson & Son, Inc. (US), Reckitt Benckiser Group plc (UK), Henkel AG & Co. KGaA (Germany), Spectrum Brands Holdings Inc. (US), Godrej Consumer Products Limited (India), BASF SE (Germany), Natura & Co Holding SA (Brazil), 3M Company (US), Dabur India Ltd. (India), Jyothy Labs Limited (India), PelGar International (UK), AoGrand Group (China), Enesis Group (Indonesia), Herbal Strategi (India), Sawyer Products, Inc. (US), and Himalaya Global Holdings Ltd. (India). These manufacturers of mosquito repellent products faced a difficult time during 2020 due to the COVID-19 pandemic induced lockdowns and their businesses were impacted negatively during the year.
The department of Homeland Security of the US had deemed pest control services as ‘essential’ during the pandemic. As a result, vendors and manufacturers alike had to keep their services open even during the lockdown phase of the pandemic. With minimal movement of people and undisturbed conditions during the lockdown, mosquito breeding, cockroach infestation, and rodent activities were expected to rise and there was increased chance of pest proliferation in urban areas.
- In May 2020, SC Johnson contributed to different organizations across the South American region. The company provided their products to the most vulnerable communities of this region in an effort to stem the spread of COVID-19 infection. In Brazil, the company launched Lifeform brand hand sanitizers and donated over 300 thousand units to healthcare and community organizations. The company also partnered with the Red Cross Society in different countries of South America such as Chile, Colombia, Ecuador, Costa Rica and Mexico. In Argentina, the company provided personal protective equipment, disinfectants, and cleaning supplies to Banco de Alimentos, SI Foundation, Seamos UNO, Conciencia Association, TECHO, Sanitary Module, and Caritas San Isidro.
- In July 2020, Reckitt Benckiser Group plc supported the communities of Berkshire and Buckinghamshire in the UK that were affected by the COVID-19 pandemic. Employees of the company working in UK donated over over USD 0.5 million to the Berkshire Community Foundation (BCF). This donation allowed BCF to provide food products to over 2,000 families over a period of six months. The donation also helped the Slough Community Transport (SCT) to provide 3,400 medical prescriptions during the same period.
- In April 2020, Henkel AG & Co. KGaA started producing hand disinfectants at its production unit in Dusseldorf, Germany which were then provided to nearby hospitals and health institutions. Henkel donated over USD 2 million to the COVID-19 Solidarity Response Fund launched by the WHO and the United Nations Foundation. The company also donated 5 million units of personal protective equipment and home hygiene products.
Mosquito Repellent Market Dynamics
Drivers: Rise in mosquito-borne diseases
The World Health Organization (WHO) estimates that every year approximately one million people die due to mosquito bites. The WHO also estimates that every year, around 300-500 million cases of malaria occur with a majority of the inflicted people succumbing to death due to this disease. Moreover, the instances of dengue have also increased with approximately 400 milion people getting infected every year. The US Centers for Disease Control and Prevention (CDC) stated that in 2018, cases of West Nile virus were much higher in the US than the average from 2008 to 2017. The Sub-Saharan African region is also inflicted by mosquito related diseases and approximately 400,000 people were killed in 2018. These stats clearly show the occurrence of mosquito related diseases across the world.
Restraints: Health hazards of pesticides used for mosquito control
Mosquito repellent products contain dangerous chemicals such as DEET, Cyfluthrin, Permethrin, and Pyrethoids. DEET is one of the most common insect repellents, however in large doses this chemical causes ailments to skin, brain, breathing and bones. The compound also affects motor skills during prolonged exposure and can lead to physiological and behavioral problems. Similarly, other chemicals such as cyfluthrin causes neurotoxicity during prolonged exposure. As a result, many consumers try to avoid products containing these harmful chemicals and opt for safer alternatives such as picaridin.
Opportunities: Demand for herbal mosquito repellent products
Traditionally, there are many plant-based repellents which can be used for protection against mosquitoes. Naturally plants contain different chemicals which act as a defense against plant-eating insects. These chemicals can also be used to repel mosquitoes. Plant-based extracts such as citronella genus is a common ingredient used in skin-friendly mosquito repellents and is used at concentrations ranging from 5-10%.
Challenges: Stringent regulations pertaining to manufacturing mosquito repellent products
dCountries such as US, Germany, UK, France, Japan, Australia, Malaysia, Vietnam and others classify mosquito repellents as pesticides. The Food and Agriculture Organization of the United Nations (FAO), World Health Organization (WHO), and United Nations Environment Programme (UNEP) also classify mosquito repellent products as pesticide. The US Environmental Protection Agency (EPA) also mandates the registration of such products before they can be marketed or commercialized across the country. Similarly, the European Union and developing countries like India have their own set of standards concerning manufacture, distribution and consumption of mosquito repellent products.
Mosquito Repellent Market Ecosystem
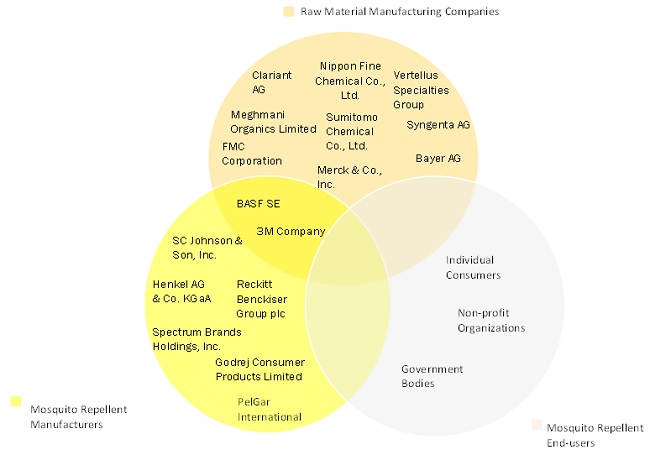
Based on repellent type, spray segment is expected to grow at a significant CAGR during the forecast period.
Mosquito repellent sprays or aerosols create a mist of liquid particles and are used with a can or bottle that contains the repellent liquid. This liquid is pressurized and when the nozzle is pressed, repellent is released in the form of a mist. These sprays are easier to use and can be applied on different fabrics and surfaces to the mosquito repelling effect. Sprays also work faster than other type of products such as coils, incense sticks, mats and liquids. Countries of North America and Europe are seen to have a preference for sprays, aerosols, and pump sprays.
Independent Stores is expected to be the fastest-growing distribution channel segment of the mosquito repellent market.
Independent stores focus on providing specific set of products rather than selling an array of goods. Different types of independent stores are department stores, specialty stores, pharmacies, convenience stores, and discount stores. Consumers generally prefer an independent store due to the level of personalized shopping experience it offers. The store also provides a conducive environment for shoppers by having a simple layout in which consumers can navigate easily.
Asia Pacific is expected to be the fastest-growing regional segment in the mosquito repellent market.
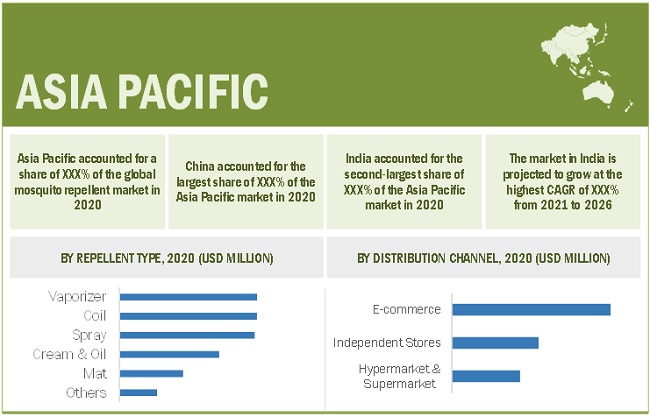
The market growth in the Asia Pacific region can be attributed to urbanization, shifting of population from rural areas to sub-urban areas and the prevalence of mosquito-related diseases. Countries such as China, India, Indonesia, and Australia have a climate which helps in breeding of mosquitoes during the monsoon. Moreover, government initiatives are also aiding market growth in this region.
APAC SNAPSHOT
To know about the assumptions considered for the study, download the pdf brochure
Mosquito Repellent Market Players
Some of the leading players operating in the mosquito repellent market include companies like SC Johnson & Son, Inc. (US), Reckitt Benckiser Group plc (UK), Henkel AG & Co. KGaA (Germany), Spectrum Brands Holdings Inc. (US), Godrej Consumer Products Limited (India), BASF SE (Germany), Natura & Co Holding SA (Brazil), 3M Company (US), Dabur India Ltd. (India), Jyothy Labs Limited (India), PelGar International (UK), AoGrand Group (China), Enesis Group (Indonesia), Herbal Strategi (India), Sawyer Products, Inc. (US), and Himalaya Global Holdings Ltd. (India). These players have expansions, acquisitions, new product launches, investment and partnerships as the major strategies to consolidate their position in the market.
Read More: Mosquito Repellent Companies
Recent Developments
- In September 2020, PelGar International launched a product called Cimetrol Super RFU. This is a water-based spray and is an effective repellent for crawling and flying insects. This product can be applied on hard surfaces, cracks, crevices and even mattresses. The product is a blend of synthetic and natural pyrethroids and is delivered in the form of an aerosol.
- In January 2020, Natura &Co acquired Avon Products, Inc. thereby creating the world’s fourth largest company delivering beauty products. Natura &Co aims to gain a strong foothold in the consumer space through a combination of different brands such as of Avon, Natura, The Body Shop, and Aesop.
- In August 2019, Henkel AG & Co. KGaA invested USD 130 million in its production facility to increase its output. The company also aims to improve its product offering by starting a new bottling station for its products.
Frequently Asked Questions (FAQ):
What are mosquito repellents?
Mosquito repellents are substance that are used to repel mosquitoes. These repellents have active ingredients which can be synthetic or natural and also have secondary ingredients such as absorbent paper, water, surfactants, fatty alcohol, fragrance, and other emollients.
What are the different types of mosquito repellents available in the market?
Different types of mosquito repellents are sprays, vaporizers, creams & oils, coils, mats, candles, incense sticks, cards, wet wipes and patches.
What are the key driving factors for the growth of the global mosquito repellent market?
Rising population, urbanization, migration of people to sub-urban and urban areas and adaption of mosquitoes to changing climatic conditions are the key driving factors responsible for the growth of the global mosquito repellent market.
What is the biggest challenge for the growth of the global mosquito repellent market?
Mosquito repellent products are categorized as pesticides in many developed countries of North America and Europe. There are stringent rules and regulations to be followed before these products can be marketed or commercialized.
What are the key regions in the global mosquito repellent market?
Asia Pacific is the key region in the global mosquito repellent market. Developing countries such as China, India, Australia, Indonesia, and Vietnam are expected to provide ample opportunities for growth. .
To speak to our analyst for a discussion on the above findings, click Speak to Analyst

TABLE OF CONTENTS
1 INTRODUCTION (Page No. - 20)
1.1 OBJECTIVES OF THE STUDY
1.2 MARKET DEFINITION
1.2.1 MOSQUITO REPELLENT
1.2.2 MOSQUITO AFTER-BITE PRODUCTS
1.3 INCLUSIONS & EXCLUSIONS
TABLE 1 MOSQUITO REPELLENT MARKET, AFTER-BITE TYPE: INCLUSIONS & EXCLUSIONS
TABLE 2 MOSQUITO REPELLENT MARKET, BY TYPE: INCLUSIONS & EXCLUSIONS
TABLE 3 MOSQUITO REPELLENT MARKET, BY DISTRIBUTION CHANNEL: INCLUSIONS & EXCLUSIONS
TABLE 4 MOSQUITO REPELLENT MARKET, BY REGION: INCLUSIONS & EXCLUSIONS
1.4 MARKET SCOPE
FIGURE 1 MOSQUITO REPELLENT MARKET: SEGMENTATION
1.4.1 YEARS CONSIDERED FOR THE STUDY
1.5 CURRENCY
1.6 LIMITATIONS
1.7 STAKEHOLDERS
2 RESEARCH METHODOLOGY (Page No. - 25)
2.1 RESEARCH DATA
FIGURE 2 MOSQUITO REPELLENT MARKET: RESEARCH DESIGN
2.1.1 SECONDARY DATA
2.1.1.1 Key data from secondary sources
2.1.2 PRIMARY DATA
2.1.2.1 Key data from primary sources
2.1.2.2 List of participating companies for primary research
2.1.2.3 Key industry insights
2.1.2.4 Breakdown of primary interviews
2.2 BASE NUMBER CALCULATION
2.2.1 DEMAND-SIDE APPROACH
2.2.2 SUPPLY-SIDE APPROACH
2.3 MARKET ENGINEERING PROCESS
2.3.1 MARKET SIZE ESTIMATION
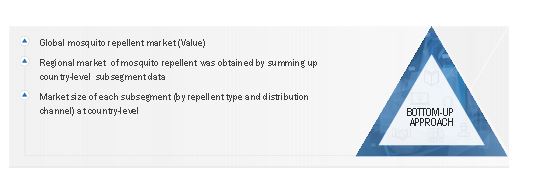
FIGURE 3 MARKET SIZE ESTIMATION: BOTTOM-UP APPROACH
2.3.2 TOP-DOWN APPROACH
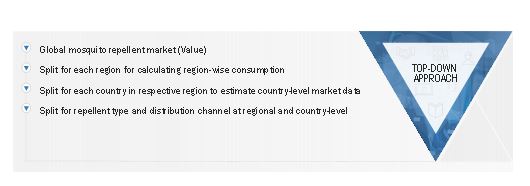
FIGURE 4 MARKET SIZE ESTIMATION: TOP-DOWN APPROACH
2.4 DATA TRIANGULATION
2.5 ASSUMPTIONS
2.6 RISK ASSESSMENT
3 EXECUTIVE SUMMARY (Page No. - 36)
TABLE 5 MOSQUITO REPELLENT MARKET SNAPSHOT, 2021 & 2026
FIGURE 5 SPRAY SEGMENT ACCOUNTED FOR LARGEST SHARE OF MOSQUITO REPELLENT MARKET IN 2020
FIGURE 6 E-COMMERCE DISTRIBUTION CHANNEL ACCOUNTED FOR LARGEST SHARE OF MOSQUITO REPELLENT MARKET IN 2020
3.1 MOSQUITO REPELLENT MARKET, BY REGION
FIGURE 7 ASIA PACIFIC TO BE FASTEST-GROWING MARKET FROM 2021 TO 2026
4 PREMIUM INSIGHTS (Page No. - 40)
4.1 ATTRACTIVE OPPORTUNITIES IN GLOBAL MOSQUITO REPELLENT MARKET
FIGURE 8 INCREASING MOSQUITO-BORNE DISEASES AND RISING POPULATION DRIVING MARKET GROWTH
4.2 GLOBAL MOSQUITO REPELLENT MARKET, BY REPELLENT TYPE
FIGURE 9 SPRAY SEGMENT TO WITNESS HIGHEST CAGR FROM 2021 TO 2026
4.3 ASIA PACIFIC MOSQUITO REPELLENT MARKET, BY REPELLENT TYPE AND COUNTRY
FIGURE 10 CHINA TO BE LARGEST MOSQUITO REPELLENT MARKET IN 2021
4.4 MOSQUITO REPELLENT MARKET, BY MAJOR COUNTRIES
FIGURE 11 INDIA, CHINA, INDONESIA, AND BRAZIL TO OFFER LUCRATIVE GROWTH OPPORTUNITIES DURING FORECAST PERIOD
5 MARKET OVERVIEW (Page No. - 44)
5.1 INTRODUCTION
5.2 MARKET DYNAMICS
FIGURE 12 MOSQUITO REPELLENT MARKET: DRIVERS, RESTRAINTS, OPPORTUNITIES, AND CHALLENGES
5.2.1 DRIVERS
5.2.1.1 Rise in mosquito-borne diseases
TABLE 6 LIST OF MOSQUITO-BORNE DISEASES
FIGURE 13 GLOBAL RISE IN DENGUE CASES – 2000 TO 2019
5.2.1.2 Rising population and urbanization in developing countries
FIGURE 14 POPULATION GROWTH, 2010-2020
FIGURE 15 WORLD URBANIZATION GROWTH, 1990-2030
5.2.1.3 Increasing consumer awareness related to mosquito repellent products
5.2.2 RESTRAINTS
5.2.2.1 Health hazards of pesticides used for mosquito control
5.2.2.2 Use of unconventional mosquito-repelling/attracting products
5.2.3 OPPORTUNITIES
5.2.3.1 Demand for herbal mosquito repellent products
5.2.4 CHALLENGES
5.2.4.1 Rise in counterfeit mosquito repellent products
FIGURE 16 INDUSTRIES HIT BY CIRCULATION OF COUNTERFEIT GOODS, 2018
5.2.4.2 Stringent regulations pertaining to manufacturing mosquito repellents
5.3 PORTER’S FIVE FORCES ANALYSIS
FIGURE 17 PORTER’S FIVE FORCES ANALYSIS
TABLE 7 PORTER’S FIVE FORCES ANALYSIS: MOSQUITO REPELLENT MARKET
5.3.1 BARGAINING POWER OF SUPPLIERS
5.3.2 THREAT OF NEW ENTRANTS
5.3.3 THREAT OF SUBSTITUTES
5.3.4 BARGAINING POWER OF BUYERS
5.3.5 DEGREE OF COMPETITION
5.4 VALUE CHAIN ANALYSIS
FIGURE 18 VALUE CHAIN ANALYSIS: MAXIMUM VALUE IS ADDED DURING MARKETING & SALES PROCESS
5.4.1 PROMINENT COMPANIES
5.4.2 SMALL & MEDIUM ENTERPRISES
TABLE 8 MOSQUITO REPELLENT MARKET: ECOSYSTEM
5.5 TRENDS/DISRUPTIONS IMPACTING CUSTOMERS’ BUSINESS
FIGURE 19 REVENUE SHIFT & NEW REVENUE POCKETS FOR MOSQUITO REPELLENT MANUFACTURERS
5.6 ECOSYSTEM FOR MOSQUITO REPELLENT MARKET
FIGURE 20 ECOSYSTEM MAP FOR MOSQUITO REPELLENT MARKET
5.7 TECHNOLOGY ANALYSIS
5.8 PATENT ANALYSIS
5.8.1 INTRODUCTION
5.8.2 INSIGHTS
FIGURE 21 PUBLICATION TRENDS (2010-2021)
TABLE 9 TOP 10 OWNERS OF MOSQUITO REPELLENT PATENTS
FIGURE 22 NO. OF MOSQUITO REPELLENT PATENTS – TOP 10 COUNTRIES (2010-2021)
5.8.3 TOP APPLICANTS
FIGURE 23 NO. OF PATENT APPLICATIONS (2010-2021)
5.9 AVERAGE SELLING PRICE TRENDS
TABLE 10 AVERAGE PRICES OF MOSQUITO REPELLENT PRODUCTS, BY REGION (USD) (2020)
5.10 REGULATORY LANDSCAPE
5.10.1 US
5.10.2 EUROPE
5.10.3 CHINA
5.10.4 BRAZIL
5.11 MACROECONOMIC INDICATORS
5.11.1 POPULATION DENSITY
TABLE 11 POPULATION DENSITY OF IMPORTANT COUNTRIES, 2020
5.12 COVID-19 IMPACT ON MOSQUITO REPELLENT MARKET
5.12.1 COVID-19 HEALTH ASSESSMENT
FIGURE 24 COUNTRY-WISE SPREAD OF COVID-19
FIGURE 25 IMPACT OF COVID-19 ON DIFFERENT COUNTRIES IN 2020 (Q4)
FIGURE 26 THREE SCENARIO-BASED ANALYSIS OF COVID-19 IMPACT ON GLOBAL ECONOMY
5.12.2 COVID-19 IMPACT ON MOSQUITO REPELLENT MARKET
5.12.3 COVID-19 TO DRIVE DEMAND FOR PEST CONTROL SOLUTIONS AS AN ‘ESSENTIAL SERVICE’
5.12.4 COVID-19 IMPACT ON MOSQUITO REPELLENT ACTIVE INGREDIENTS SUPPLY CHAIN
6 INSECT ATTRACTANTS (Page No. - 77)
6.1 INTRODUCTION
6.2 PHEROMONES
TABLE 12 COMMONLY DEPLOYED PHEROMONES FOR ATTRACTING PESTS
6.3 PLANT VOLATILES & FLOWER OILS
TABLE 13 COMMONLY DEPLOYED PLANT VOLATILES & FLOWER OILS FOR ATTRACTING INSECTS
6.4 SUGARS
6.5 PROTEINS
7 MOSQUITO REPELLENT MARKET, BY AFTER-BITE TYPE (Page No. - 83)
7.1 INTRODUCTION
FIGURE 27 MOSQUITO REPELLENT MARKET, BY AFTER-BITE TYPE, BY REGION, 2021 VS 2026 (USD MILLION)
TABLE 14 MOSQUITO REPELLENT MARKET, BY AFTER-BITE TYPE, BY REGION, 2018–2026 (USD MILLION)
7.2 LOTION
7.3 BALM
7.4 GEL
7.5 ROLL-ON
7.6 OTHERS
7.6.1 SPRAY
7.6.2 WET WIPES
8 MOSQUITO REPELLENT MARKET, BY REPELLENT TYPE (Page No. - 87)
8.1 INTRODUCTION
TABLE 15 CHEMICALS EFFECTIVE IN REPELLING YELLOW FEVER MOSQUITO
TABLE 16 MOSQUITO SPECIES COMMONLY FOUND ACROSS THE GLOBE
FIGURE 28 MOSQUITO REPELLENT MARKET, BY REPELLENT TYPE, 2021 VS. 2026 (USD MILLION)
TABLE 17 MOSQUITO REPELLENT MARKET SIZE, BY REPELLENT TYPE, 2018–2026 (USD MILLION)
8.2 SPRAY
8.2.1 SPRAY SEGMENT TO WITNESS FASTEST GROWTH DURING FORECAST PERIOD
TABLE 18 MOSQUITO REPELLENT SPRAY MARKET SIZE, BY REGION, 2018–2026 (USD MILLION)
8.3 VAPORIZER
8.3.1 TO RECORD SECOND-FASTEST GROWTH DURING FORECAST PERIOD
TABLE 19 MOSQUITO REPELLENT VAPORIZER MARKET SIZE, BY REGION, 2018–2026 (USD MILLION)
8.4 CREAM & OIL
8.4.1 POPULAR IN DEVELOPED COUNTRIES OF NORTH AMERICA AND EUROPE
TABLE 20 MOSQUITO REPELLENT CREAM & OIL MARKET SIZE, BY REGION, 2018–2026 (USD MILLION)
8.5 COIL
8.5.1 CONSUMED HIGHEST IN COUNTRIES SUCH AS CHINA, INDIA, AND BRAZIL
TABLE 21 MOSQUITO REPELLENT COIL MARKET SIZE, BY REGION, 2018–2026 (USD MILLION)
8.6 MAT
8.6.1 MOSQUITO REPELLENT MATS ARE WITNESSING DECREASED USAGE DUE TO HEALTH HAZARDS
TABLE 22 MOSQUITO REPELLENT MAT MARKET SIZE, BY REGION, 2018–2026 (USD MILLION)
8.7 OTHERS
8.7.1 INCENSE STICKS
8.7.2 CANDLES
8.7.3 CARDS
8.7.4 ROLL-ONS
8.7.5 WET WIPES
8.7.6 PATCHES
TABLE 23 MOSQUITO REPELLENT OTHERS MARKET SIZE, BY REGION, 2018–2026 (USD MILLION)
9 MOSQUITO REPELLENT MARKET, BY DISTRIBUTION CHANNEL (Page No. - 98)
9.1 INTRODUCTION
FIGURE 29 MOSQUITO REPELLENT MARKET, BY DISTRIBUTION CHANNEL, 2021 VS. 2026 (USD MILLION)
TABLE 24 MOSQUITO REPELLENT MARKET, BY DISTRIBUTION CHANNEL, 2018–2026 (USD MILLION)
9.2 HYPERMARKET & SUPERMARKET
9.2.1 TO WITNESS GROWTH IN DEVELOPED
9.2.2 COVID-19 IMPACT ON HYPERMARKET & SUPERMARKET
TABLE 25 MOSQUITO REPELLENT MARKET SIZE IN HYPERMARKET & SUPERMARKET, BY REGION, 2018–2026 (USD MILLION)
9.3 INDEPENDENT STORES
9.3.1 TO RECORD SECOND-FASTEST GROWTH IN DEVELOPING COUNTRIES
9.3.2 COVID-19 IMPACT ON INDEPENDENT STORES
TABLE 26 MOSQUITO REPELLENT MARKET SIZE IN INDEPENDENT STORES, BY REGION, 2018–2026 (USD MILLION)
9.4 E-COMMERCE
9.4.1 TO GROW AT FASTEST RATE DURING FORECAST PERIOD
9.4.2 COVID-19 IMPACT ON E-COMMERCE
TABLE 27 MOSQUITO REPELLENT MARKET SIZE IN E-COMMERCE, BY REGION, 2018–2026 (USD MILLION)
10 MOSQUITO REPELLENT MARKET, BY REGION (Page No. - 104)
10.1 INTRODUCTION
TABLE 28 KEY VECTOR-BORNE DISEASES (VBD) AFFECTING HUMANS
TABLE 29 KEY VECTOR-BORNE DISEASES (VBD) AFFECTING ANIMALS
FIGURE 30 GEOGRAPHIC SNAPSHOT (2021–2026): MOSQUITO REPELLENT MARKET IN INDIA TO GROW AT HIGHEST CAGR
TABLE 30 MOSQUITO REPELLENT MARKET SIZE, BY REGION, 2018–2026 (USD MILLION)
10.2 ASIA PACIFIC
FIGURE 31 ASIA PACIFIC: MOSQUITO REPELLENT MARKET SNAPSHOT
TABLE 31 ASIA PACIFIC: MOSQUITO REPELLENT MARKET SIZE, BY COUNTRY, 2018–2026 (USD MILLION)
TABLE 32 ASIA PACIFIC: MOSQUITO REPELLENT MARKET SIZE, BY REPELLENT TYPE, 2018–2026 (USD MILLION)
TABLE 33 ASIA PACIFIC: MOSQUITO REPELLENT MARKET SIZE, BY DISTRIBUTION CHANNEL, 2018–2026 (USD MILLION)
10.2.1 CHINA
10.2.1.1 High domestic consumption and presence of numerous mosquito repellent manufacturers
10.2.1.2 COVID-19 impact on China
TABLE 34 CHINA: MOSQUITO REPELLENT MARKET SIZE, BY REPELLENT TYPE, 2018–2026 (USD MILLION)
TABLE 35 CHINA: MOSQUITO REPELLENT MARKET SIZE, BY DISTRIBUTION CHANNEL, 2018–2026 (USD MILLION)
10.2.2 JAPAN
10.2.2.1 Growth in population and urbanization boosting mosquito population
10.2.2.2 COVID-19 impact on Japan
TABLE 36 JAPAN: MOSQUITO REPELLENT MARKET SIZE, BY REPELLENT TYPE, 2018–2026 (USD MILLION)
TABLE 37 JAPAN: MOSQUITO REPELLENT MARKET SIZE, BY DISTRIBUTION CHANNEL, 2018–2026 (USD MILLION)
10.2.3 INDIA
10.2.3.1 Increasing awareness about mosquito-borne diseases
10.2.3.2 COVID-19 impact on India
TABLE 38 INDIA: MOSQUITO REPELLENT MARKET SIZE, BY REPELLENT TYPE, 2018–2026 (USD MILLION)
TABLE 39 INDIA: MOSQUITO REPELLENT MARKET SIZE, BY DISTRIBUTION CHANNEL, 2018–2026 (USD MILLION)
10.2.4 SOUTH KOREA
10.2.4.1 Prevalence of mosquitoes to drive market
10.2.4.2 COVID-19 impact on South Korea
TABLE 40 SOUTH KOREA: MOSQUITO REPELLENT MARKET SIZE, BY REPELLENT TYPE, 2018–2026 (USD MILLION)
TABLE 41 SOUTH KOREA: MOSQUITO REPELLENT MARKET SIZE, BY DISTRIBUTION CHANNEL, 2018–2026 (USD MILLION)
10.2.5 INDONESIA
10.2.5.1 Government initiatives and support aiding market growth
10.2.5.2 COVID-19 impact on Indonesia
TABLE 42 INDONESIA: MOSQUITO REPELLENT MARKET SIZE, BY REPELLENT TYPE, 2018–2026 (USD MILLION)
TABLE 43 INDONESIA: MOSQUITO REPELLENT MARKET SIZE, BY DISTRIBUTION CHANNEL, 2018–2026 (USD MILLION)
10.2.6 AUSTRALIA
10.2.6.1 Demand for mosquito repellents due to high pest infestation
10.2.6.2 COVID-19 impact on Australia
TABLE 44 AUSTRALIA: MOSQUITO REPELLENT MARKET SIZE, BY REPELLENT TYPE, 2018–2026 (USD MILLION)
TABLE 45 AUSTRALIA: MOSQUITO REPELLENT MARKET SIZE, BY DISTRIBUTION CHANNEL, 2018–2026 (USD MILLION)
10.2.7 REST OF ASIA PACIFIC
10.2.7.1 COVID-19 impact on Rest of Asia Pacific
TABLE 46 REST OF ASIA PACIFIC: MOSQUITO REPELLENT MARKET SIZE, BY REPELLENT TYPE, 2018–2026 (USD MILLION)
TABLE 47 REST OF ASIA PACIFIC: MOSQUITO REPELLENT MARKET SIZE, BY DISTRIBUTION CHANNEL, 2018–2026 (USD MILLION)
10.3 NORTH AMERICA
FIGURE 32 NORTH AMERICA: MOSQUITO REPELLENT MARKET SNAPSHOT
TABLE 48 NORTH AMERICA: MOSQUITO REPELLENT MARKET SIZE, BY COUNTRY, 2018–2026 (USD MILLION)
TABLE 49 NORTH AMERICA: MOSQUITO REPELLENT MARKET SIZE, BY REPELLENT TYPE, 2018–2026 (USD MILLION)
TABLE 50 NORTH AMERICA: MOSQUITO REPELLENT MARKET SIZE, BY DISTRIBUTION CHANNEL, 2018–2026 (USD MILLION)
10.3.1 US
10.3.1.1 Prevalence of mosquito-borne diseases and high consumer awareness
10.3.1.2 COVID-19 impact on US
TABLE 51 US: MOSQUITO REPELLENT MARKET SIZE, BY REPELLENT TYPE, 2018–2026 (USD MILLION)
TABLE 52 US: MOSQUITO REPELLENT MARKET SIZE, BY DISTRIBUTION CHANNEL, 2018–2026 (USD MILLION)
10.3.2 CANADA
10.3.2.1 Increasing focus on controlling vector-borne diseases
10.3.2.2 COVID-19 impact on Canada
TABLE 53 CANADA: MOSQUITO REPELLENT MARKET SIZE, BY REPELLENT TYPE, 2018–2026 (USD MILLION)
TABLE 54 CANADA: MOSQUITO REPELLENT MARKET SIZE, BY DISTRIBUTION CHANNEL, 2018–2026 (USD MILLION)
10.3.3 MEXICO
10.3.3.1 High temperature and increasing urbanization driving mosquito repellent market
10.3.3.2 COVID-19 impact on Mexico
TABLE 55 MEXICO: MOSQUITO REPELLENT MARKET SIZE, BY REPELLENT TYPE, 2018–2026 (USD MILLION)
TABLE 56 MEXICO: MOSQUITO REPELLENT MARKET SIZE, BY DISTRIBUTION CHANNEL, 2018–2026 (USD MILLION)
10.4 EUROPE
FIGURE 33 EUROPE: MOSQUITO REPELLENT MARKET SNAPSHOT
TABLE 57 EUROPE: MOSQUITO REPELLENT MARKET SIZE, BY COUNTRY, 2018–2026 (USD MILLION)
TABLE 58 EUROPE: MOSQUITO REPELLENT MARKET SIZE, BY REPELLENT TYPE, 2018–2026 (USD MILLION)
TABLE 59 EUROPE: MOSQUITO REPELLENT MARKET SIZE, BY DISTRIBUTION CHANNEL, 2018–2026 (USD MILLION)
10.4.1 GERMANY
10.4.1.1 Increased government initiatives to control insect infestation
10.4.1.2 COVID-19 impact on Germany
TABLE 60 GERMANY: MOSQUITO REPELLENT MARKET SIZE, BY REPELLENT TYPE, 2018–2026 (USD MILLION)
TABLE 61 GERMANY: MOSQUITO REPELLENT MARKET SIZE, BY DISTRIBUTION CHANNEL, 2018–2026 (USD MILLION)
10.4.2 FRANCE
10.4.2.1 High domestic demand for mosquito repellent products
10.4.2.2 COVID-19 impact on France
TABLE 62 FRANCE: MOSQUITO REPELLENT MARKET SIZE, BY REPELLENT TYPE, 2018–2026 (USD MILLION)
TABLE 63 FRANCE: MOSQUITO REPELLENT MARKET SIZE, BY DISTRIBUTION CHANNEL, 2018–2026 (USD MILLION)
10.4.3 UK
10.4.3.1 Increase in hygiene standards, awareness level, and health consciousness to aid mosquito repellent market growth
10.4.3.2 COVID-19 impact on UK
TABLE 64 UK: MOSQUITO REPELLENT MARKET SIZE, BY REPELLENT TYPE, 2018–2026 (USD MILLION)
TABLE 65 UK: MOSQUITO REPELLENT MARKET SIZE, BY DISTRIBUTION CHANNEL, 2018–2026 (USD MILLION)
10.4.4 ITALY
10.4.4.1 Increasing mosquito population to drive mosquito repellent market
10.4.4.2 Covid-19 impact on Italy
TABLE 66 ITALY: MOSQUITO REPELLENT MARKET SIZE, BY REPELLENT TYPE, 2018–2026 (USD MILLION)
TABLE 67 ITALY: MOSQUITO REPELLENT MARKET SIZE, BY DISTRIBUTION CHANNEL, 2018–2026 (USD MILLION)
10.4.5 TURKEY
10.4.5.1 Rising temperature to increase mosquito population
10.4.5.2 COVID-19 impact on Turkey
TABLE 68 TURKEY: MOSQUITO REPELLENT MARKET SIZE, BY REPELLENT TYPE, 2018–2026 (USD MILLION)
TABLE 69 TURKEY: MOSQUITO REPELLENT MARKET SIZE, BY DISTRIBUTION CHANNEL, 2018–2026 (USD MILLION)
10.4.6 RUSSIA
10.4.6.1 High mosquito density in warmer regions to drive mosquito repellent market
10.4.6.2 COVID-19 impact on Russia
TABLE 70 RUSSIA: MOSQUITO REPELLENT MARKET SIZE, BY REPELLENT TYPE, 2018–2026 (USD MILLION)
TABLE 71 RUSSIA: MOSQUITO REPELLENT MARKET SIZE, BY DISTRIBUTION CHANNEL, 2018–2026 (USD MILLION)
10.4.7 REST OF EUROPE
10.4.7.1 COVID-19 impact on Rest of Europe
TABLE 72 REST OF EUROPE: MOSQUITO REPELLENT MARKET SIZE, BY REPELLENT TYPE, 2018–2026 (USD MILLION)
TABLE 73 REST OF EUROPE: MOSQUITO REPELLENT MARKET SIZE, BY DISTRIBUTION CHANNEL, 2018–2026 (USD MILLION)
10.5 SOUTH AMERICA
TABLE 74 SOUTH AMERICA: MOSQUITO REPELLENT MARKET SIZE, BY COUNTRY, 2018–2026 (USD MILLION)
TABLE 75 SOUTH AMERICA: MOSQUITO REPELLENT MARKET SIZE, BY REPELLENT TYPE, 2018–2026 (USD MILLION)
TABLE 76 SOUTH AMERICA: MOSQUITO REPELLENT MARKET SIZE, BY DISTRIBUTION CHANNEL, 2018–2026 (USD MILLION)
10.5.1 BRAZIL
10.5.1.1 High prevalence of mosquito-borne diseases
10.5.1.2 COVID-19 impact on Brazil
TABLE 77 BRAZIL: MOSQUITO REPELLENT MARKET SIZE, BY REPELLENT TYPE, 2018–2026 (USD MILLION)
TABLE 78 BRAZIL: MOSQUITO REPELLENT MARKET SIZE, BY DISTRIBUTION CHANNEL, 2018–2026 (USD MILLION)
10.5.2 ARGENTINA
10.5.2.1 Dengue outbreaks boosting demand for mosquito repellent products
10.5.2.2 COVID-19 impact on Argentina
TABLE 79 ARGENTINA: MOSQUITO REPELLENT MARKET SIZE, BY REPELLENT TYPE, 2018–2026 (USD MILLION)
TABLE 80 ARGENTINA: MOSQUITO REPELLENT MARKET SIZE, BY DISTRIBUTION CHANNEL, 2018–2026 (USD MILLION)
10.5.3 REST OF SOUTH AMERICA
10.5.3.1 COVID-19 impact on Rest of South America
TABLE 81 REST OF SOUTH AMERICA: MOSQUITO REPELLENT MARKET SIZE, BY REPELLENT TYPE, 2018–2026 (USD MILLION)
TABLE 82 REST OF SOUTH AMERICA: MOSQUITO REPELLENT MARKET SIZE, BY DISTRIBUTION CHANNEL, 2018–2026 (USD MILLION)
10.6 MIDDLE EAST & AFRICA
TABLE 83 MIDDLE EAST & AFRICA MOSQUITO REPELLENT MARKET SIZE, BY COUNTRY, 2018–2026 (USD MILLION)
TABLE 84 MIDDLE EAST & AFRICA: MOSQUITO REPELLENT MARKET SIZE, BY REPELLENT TYPE, 2018–2026 (USD MILLION)
TABLE 85 MIDDLE EAST & AFRICA: MOSQUITO REPELLENT MARKET SIZE, BY DISTRIBUTION CHANNEL, 2018–2026 (USD MILLION)
10.6.1 NIGERIA
10.6.1.1 Government initiatives and several funds for reducing malaria burden
10.6.1.2 COVID-19 impact on Nigeria
TABLE 86 NIGERIA: MOSQUITO REPELLENT MARKET SIZE, BY REPELLENT TYPE, 2018–2026 (USD MILLION)
TABLE 87 NIGERIA: MOSQUITO REPELLENT MARKET SIZE, BY DISTRIBUTION CHANNEL, 2018–2026 (USD MILLION)
10.6.2 SOUTH AFRICA
10.6.2.1 Increased malaria control activities to drive mosquito repellent market
10.6.2.2 COVID-19 impact on South Africa
TABLE 88 SOUTH AFRICA: MOSQUITO REPELLENT MARKET SIZE, BY REPELLENT TYPE, 2018–2026 (USD MILLION)
TABLE 89 SOUTH AFRICA: MOSQUITO REPELLENT MARKET SIZE, BY DISTRIBUTION CHANNEL, 2018–2026 (USD MILLION)
10.6.3 REST OF MIDDLE EAST & AFRICA
10.6.3.1 COVID-19 impact on Rest of Middle East & Africa
TABLE 90 REST OF MIDDLE EAST & AFRICA: MOSQUITO REPELLENT MARKET SIZE, BY REPELLENT TYPE, 2018–2026 (USD MILLION)
TABLE 91 REST OF MIDDLE EAST & AFRICA: MOSQUITO REPELLENT MARKET SIZE, BY DISTRIBUTION CHANNEL, 2018–2026 (USD MILLION)
11 COMPETITIVE LANDSCAPE (Page No. - 157)
11.1 OVERVIEW
11.2 KEY PLAYER STRATEGIES
FIGURE 34 OVERVIEW OF STRATEGIES DEPLOYED BY MOSQUITO REPELLENT MANUFACTURERS
FIGURE 35 COMPANIES ADOPTED ORGANIC GROWTH STRATEGIES BETWEEN JANUARY 2017 AND APRIL 2021
11.3 MARKET EVALUATION FRAMEWORK
FIGURE 36 MARKET EVALUATION FRAMEWORK: 2020 SAW NEW PRODUCT LAUNCHES LEADING THIS SPACE
11.4 MARKET SHARE ANALYSIS: MOSQUITO REPELLENT MARKET (2020)
11.4.1 MARKET SHARE ANALYSIS OF TOP PLAYERS IN MOSQUITO REPELLENT MARKET
FIGURE 37 TOP 5 PLAYERS IN THE MOSQUITO REPELLENT MARKET (2020)
TABLE 92 MOSQUITO REPELLENT MARKET: DEGREE OF COMPETITION
FIGURE 38 SC JOHNSON & SON, INC. CAPTURED THE LARGEST SHARE IN THE MOSQUITO REPELLENT MARKET IN 2020
11.4.2 REVENUE ANALYSIS OF TOP PLAYERS IN MOSQUITO REPELLENT MARKET
FIGURE 39 TOP PLAYERS – REVENUE ANALYSIS (2017–2020)
11.5 COMPANY EVALUATION QUADRANT MATRIX DEFINITIONS AND METHODOLOGY, 2020
11.5.1 STAR
11.5.2 EMERGING LEADERS
11.5.3 PERVASIVE
11.5.4 PARTICIPANTS
FIGURE 40 MOSQUITO REPELLENT MARKET: COMPETITIVE LANDSCAPE MAPPING, 2020
11.6 COMPETITIVE BENCHMARKING
11.6.1 STRENGTH OF PRODUCT PORTFOLIO
FIGURE 41 PRODUCT PORTFOLIO ANALYSIS OF TOP PLAYERS IN THE MOSQUITO REPELLENT MARKET
11.6.2 BUSINESS STRATEGY EXCELLENCE
FIGURE 42 BUSINESS STRATEGY EXCELLENCE OF TOP PLAYERS IN THE MOSQUITO REPELLENT MARKET
11.7 SME MATRIX, 2020
11.7.1 PROGRESSIVE COMPANIES
11.7.2 DYNAMIC COMPANIES
11.7.3 RESPONSIVE COMPANIES
11.7.4 STARTING BLOCKS
FIGURE 43 MOSQUITO REPELLENT MARKET: COMPETITIVE LEADERSHIP MAPPING OF EMERGING COMPANIES, 2020
TABLE 93 COMPANY PRODUCT FOOTPRINT, 2020
TABLE 94 COMPANY DISTRIBUTION FOOTPRINT, 2020
TABLE 95 COMPANY REGIONAL FOOTPRINT, 2020
TABLE 96 COMPANY OVERALL FOOTPRINT, 2020
11.8 KEY MARKET DEVELOPMENTS
TABLE 97 MOSQUITO REPELLENT MARKET: NEW PRODUCT LAUNCH, JANUARY 2017 –APRIL 2021
TABLE 98 MOSQUITO REPELLENT MARKET: DEALS, JANUARY 2017 – APRIL 2021
TABLE 99 MOSQUITO REPELLENT MARKET: OTHERS, JANUARY 2017 – APRIL 2021
12 COMPANY PROFILES (Page No. - 177)
12.1 KEY PLAYERS
(Business Overview, Products offered & strategies, Key Insights, Financial, Operational assessment, COVID-19-related developments, Winning imperatives, MnM View)*
12.1.1 SC JOHNSON & SON, INC.
TABLE 100 SC JOHNSON & SON, INC.: COMPANY OVERVIEW
12.1.2 RECKITT BENCKISER GROUP PLC
TABLE 101 RECKITT BENCKISER GROUP PLC: COMPANY OVERVIEW
FIGURE 44 RECKITT BENCKISER GROUP PLC: COMPANY SNAPSHOT
12.1.3 HENKEL AG & CO. KGAA
TABLE 102 HENKEL AG & CO. KGAA: COMPANY OVERVIEW
FIGURE 45 HENKEL AG & CO. KGAA: COMPANY SNAPSHOT
12.1.4 SPECTRUM BRANDS HOLDINGS, INC.
TABLE 103 SPECTRUM BRANDS HOLDINGS, INC.: COMPANY OVERVIEW
FIGURE 46 SPECTRUM BRANDS HOLDINGS, INC.: COMPANY SNAPSHOT
12.1.5 GODREJ CONSUMER PRODUCTS LIMITED
TABLE 104 GODREJ CONSUMER PRODUCTS LIMITED: COMPANY OVERVIEW
FIGURE 47 GODREJ CONSUMER PRODUCTS LIMITED: COMPANY SNAPSHOT
12.1.6 BASF SE
TABLE 105 BASF SE: COMPANY OVERVIEW
FIGURE 48 BASF SE: COMPANY SNAPSHOT
12.1.7 NATURA &CO HOLDING SA
TABLE 106 NATURA & CO HOLDING SA: COMPANY OVERVIEW
FIGURE 49 NATURA & CO HOLDING SA: COMPANY SNAPSHOT
12.1.8 3M COMPANY
TABLE 107 3M COMPANY: COMPANY OVERVIEW
FIGURE 50 3M COMPANY: COMPANY SNAPSHOT
12.1.9 DABUR INDIA LIMITED
TABLE 108 DABUR INDIA LIMITED: COMPANY OVERVIEW
FIGURE 51 DABUR INDIA LIMITED: COMPANY SNAPSHOT
12.1.10 JYOTHY LABS LIMITED
TABLE 109 JYOTHY LABS LIMITED: COMPANY OVERVIEW
FIGURE 52 JYOTHY LABS LIMITED: COMPANY SNAPSHOT
12.2 STARTUP/SME PLAYERS
12.2.1 PELGAR INTERNATIONAL
TABLE 110 PELGAR INTERNATIONAL: COMPANY SNAPSHOT
12.2.2 AOGRAND GROUP INC.
TABLE 111 AOGRAND GROUP INC.: COMPANY OVERVIEW
12.2.3 ENESIS GROUP
TABLE 112 ENESIS GROUP: COMPANY OVERVIEW
12.2.4 HERBAL STRATEGI
TABLE 113 HERBAL STRATEGI: COMPANY OVERVIEW
12.2.5 SAWYER PRODUCTS, INC.
TABLE 114 SAWYER PRODUCTS, INC.: COMPANY OVERVIEW
12.2.6 HIMALAYA GLOBAL HOLDINGS LTD.
TABLE 115 HIMALAYA GLOBAL HOLDINGS LTD.: COMPANY OVERVIEW
*Details on Business Overview, Products &, Key Insights, Financial, Operational assessment, COVID-19-related developments, Winning imperatives, MnM View might not be captured in case of unlisted companies.
12.3 OTHER COMPANIES
12.3.1 SAREX CHEMICALS
12.3.2 J.K. FRAGRANCES
12.3.3 SOORYA INDUSTRIES
12.3.4 REPELLERS INDIA LLP
12.3.5 GUANGZHOU TOPONE CHEMICAL CO., LTD.
12.3.6 FUJIAN GAOKE INDUSTRY AND TRADE CO., LTD.
12.3.7 JIMO QUÍMICA INDUSTRIAL LTDA
12.3.8 SYNVITA CC
12.3.9 PEACEFUL SLEEP
12.3.10 DERMATANICAL PTY LTD.
12.3.11 TANATEX CHEMICALS B.V.
12.3.12 HELAN COSMESI DI LABORATORIO S.R.L.
12.3.13 JUNO LABORATORIES PTY LTD.
12.3.14 INDUSTRIAS QUÍMICAS MEGAR
12.3.15 HANNOX INTERNATIONAL CORPORATION
13 APPENDIX (Page No. - 239)
13.1 DISCUSSION GUIDE
13.2 KNOWLEDGE STORE: MARKETSANDMARKETS’ SUBSCRIPTION PORTAL
13.3 AVAILABLE CUSTOMIZATIONS
13.4 RELATED REPORTS
13.5 AUTHOR DETAILS
This research study involved four major activities in estimating the current market size for mosquito repellents. Exhaustive secondary research was done to collect information on the market, the peer market, and the parent market. The next step was to validate these findings, assumptions, and sizing with industry experts across the value chain through primary research. Both, top-down and bottom-up approaches were employed to estimate the complete market size. Thereafter, market breakdown and data triangulation procedures were used to estimate the market size of segments and subsegments.
Secondary Research
In the secondary research process, various sources were referred to identify and collect information for this study. The secondary sources included annual reports, press releases, and investor presentations of companies; white papers, journals, and certified publications; and articles from recognized authors, directories, and databases. Data was also collected from publications by entities such as American Mosquito Control Association (AMCA), European Mosquito Control Association (EMCA), Pan-African Mosquito Control Association, Northeastern Mosquito Control Association (NMCA), Innovative Vector Control Consortium (IVCC), and others.
Primary Research
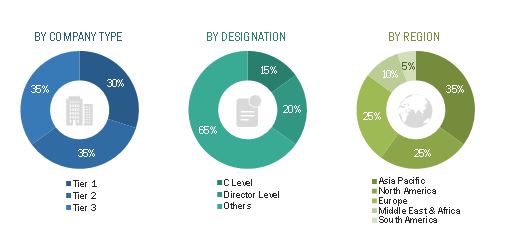
The mosquito repellent market comprises several stakeholders in the value chain, including raw material suppliers, product manufacturers, contractors, and end users. In the primary research process, experts from both the supply and demand sides were interviewed to obtain qualitative and quantitative information for this report. Primary sources from the supply side included industry experts such as CEOs, vice presidents (VPs), marketing directors, and related key executives from major companies and organizations operating in the mosquito repellent market. Primary sources from the demand side included consumers.
Following is the breakdown of primary respondents interviewed:
To know about the assumptions considered for the study, download the pdf brochure
Market Estimation
Both, top-down and bottom-up approaches were used to estimate and validate the total size of the mosquito repellent market. These methods were also used extensively to estimate the size of the various subsegments in the market. The research methodology used to estimate the market size includes the following:
- The key players in the industry and market were identified through extensive secondary research
- The supply chain of the industry and the market size in terms of value were determined through primary and secondary research
- All percentage shares, splits, and breakdowns were determined using secondary sources and verified through primary sources
- All possible parameters that affect the markets covered in this research study were accounted for, viewed in extensive detail, verified through primary research, and analyzed to obtain the final quantitative and qualitative data
- The research includes the study of reports, reviews, and newsletters of the key market players along with extensive interviews for opinions from leaders, such as directors and marketing executives
Data Triangulation
After arriving at the total market size, the overall market was split into several segments. A data triangulation procedure was employed, wherever applicable, to complete the overall market engineering process and arrive at the exact statistics for all segments. The data was triangulated by studying various factors and trends from the demand and supply sides. It was then verified through primary interviews.
Report Objectives
- To define, describe, and forecast the size of the mosquito repellent market in terms of value
- To analyze and forecast the size of the market based on repellent type, distribution channel, and region
- To define, describe, and forecast the market size of mosquito after-bite products at a global level
- To define and describe insect attractant products and their types
- To provide detailed information regarding the major factors (drivers, restraints, opportunities, and challenges) influencing market growth
- To forecast the size of the various segments of the mosquito repellent market based on five regions—North America, Asia Pacific, Europe, South America, and the Middle East & Africa— along with their key countries
- To analyze opportunities in the market for stakeholders and present a competitive landscape for market leaders
- To analyze recent developments, such as acquisitions, expansions, investments, new product launch, and partnerships in the mosquito repellent market
- To strategically profile key players in the market and comprehensively analyze their core competencies*
Note: Core competencies of the companies are determined in terms of product offerings and business strategies adopted by them to sustain in the market.
The following customization options are available for the report
MarketsandMarkets offers customizations according to the specific needs of companies with the given market data. The following customization options are available for the report:
Product Analysis
- Product matrix that gives a detailed comparison of the product portfolio of each company
Regional Analysis
- Further breakdown of a region with respect to a particular country
Company Information
- Detailed analysis and profiling of additional market players (up to five)


 Generating Response ...


Growth opportunities and latent adjacency in Mosquito Repellent Market