Metallized Film Market by Material Type (PP and PET), Metal (Aluminum), End-use Industry (Packaging, Decorative), And Region (North America, Europe, Asia Pacific, Middle East & Africa, and South America) - Global Forecast to 2026
Updated on : September 02, 2025
Metallized Film Market
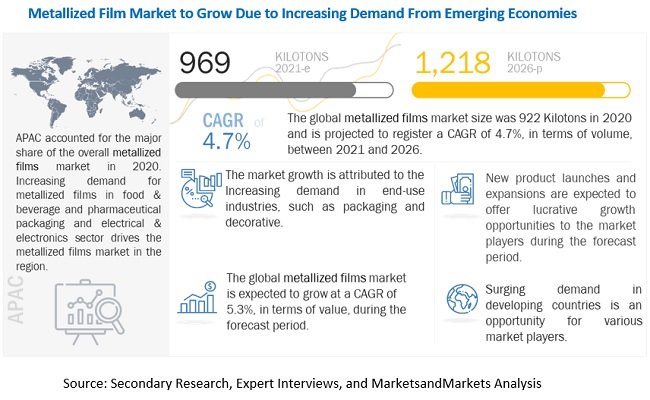
The global metallized film market was valued at USD 2.4 billion in 2020 and is projected to reach USD 3.3 billion by 2026, growing at 5.3% cagr from 2021 to 2026. Rising consumer demand for processed and packaged food items and shifting preference for aesthetically appealing products are fueling the demand for flexible packaging, which, in turn, is driving the market for metallized films.
To know about the assumptions considered for the study, Request for Free Sample Report
COVID-19 Impact on the Global Metallized Films Market
COVID-19 has made a significant economic impact on various financial as well as industrial sectors, such as travel and tourism, manufacturing, and aviation. The worst economic recession is expected during 2020-2021, according to World Bank and IMF. With the increasing number of countries imposing and extending lockdowns, economic activities are declining, impacting the global economy.
In the recent past, the global economy became substantially more interconnected. The adverse consequences of various steps related to the containment of COVID-19 are evident from global supply chain disruptions, weaker demand for imported products and services, and an increase in the unemployment rate. Risk aversion has increased in the financial market, with all-time low interest rates and sharp declines in equity and commodity prices. Consumer and business confidence have also reduced significantly.
Metallized Film Market Dynamics
Driver: Demand for longer shelf life of food products
The increasingly busy lifestyle of consumers and the consequent demand for convenient food packaging is driving the demand for metallized films. Metallized films help increase the product life and reduce the use of preservatives. These films also act as a printing substrate, which provides aesthetic appeal to the product. The food & beverages industry is shifting from traditional packaging formats to lightweight and easy-to-handle packaging. Metallized films help cater to this demand as they are lightweight compared to rigid packaging and eliminate the use of glass and cans, which increases the weight of packaging.
Gain or loss of moisture affects the texture and quality of food as well as pharmaceutical product. It can also aggravate the degradation of products that have fat content. Highly flavored food items such as coffee are likely to lose aroma, and bland foods are likely to absorb odor. To avoid the loss of aroma and to avoid odor, metallized films are used as they provide protection against oxygen, moisture, vapor, and aroma. The use of metallized films in food packaging helps in increasing the shelf life of food products, which directly helps in the reduction of wastage of food.
Restraint: Stringent regulations on automotive films in various countries
The use of metallized films in the automotive sector is regulated by various governments. The regulations imposed by governments vary from country to country. Metallized films that are installed on window glasses of vehicles reduce the Visible Light Transmission (VLT), which restricts the visible light entering the vehicle. Therefore, in many countries, there are laws that restrict the use of these films due to various reasons such as road safety, violence, and so on.
Across the globe, 100% black tint window films on all window glasses are not allowed, as these films restrict the visibility of the motorist and increase the chances of accidents. In countries such as Portugal, Belarus, Libya, Kuwait, Bolivia, Iraq, Kenya, and Pakistan, vehicle should have 100% transparent films for safety reasons. Motorists can use tinted glasses that come installed from the manufacturer. In most of the European countries, metallized films on the front windshield and side windows are not allowed, whereas the installation of films on rear windshield and side windows are allowed, provided the films should be certified and approved for use in the specific country. These regulations may restrict the growth of the metallized film market in the automotive application.
Opportunity: Increasing use of metallized films in the electronics industry
Flexible electronics offer advantages in terms of being able to develop devices that are thinner, lighter, and conformable. Owing to their design versatility and portability, flexible electronics such as organic light emitting devices and organic thin-film solar cells are increasingly used. The metals used in these electronic devices are reactive and are sensitive to water vapor. To avoid deterioration due to the reaction with water vapor, these devices need to be well-protected from water vapor. Metallized films are increasingly being used in the electronics industry.
More than 50% of the film capacitors are manufactured by BOPP metallized films, as they offer high electrostatic capacitance, low dissipation factor, high dielectric constant, and low self-heating characteristic. BOPP metallized films used in capacitors have significant growth opportunities due to their increasing applications in various industries such as consumer electronics, energy & power, automotive, locomotive, and others.
Challenge: Issues in product inspection
The major challenge for the manufacturers of metallized films is product inspection. A large number of users have relied on metal detection as a means of inspection. With the rising demand for products packaged within metallized film-coated pouches, it is challenging for metal detection systems to meet the specifications required by retailers for this format. Vision inspection is not possible as the packages are not clear.
Nowadays, manufacturers are opting for X-ray inspection. As metallized films have very little absorbance value, the X-ray is not affected by the packaging. Hence retailers’ specifications can be met with ease. X-ray is capable of detecting several other physical contaminants, such as metal, stones, and dense plastic, glass, and rubber components. However, installation of X-ray devices entails extra investment for users.
Polypropylene: Largest material industry of metallized film market
Based on material, the polypropylene (PP) segment is estimated to account for the largest share of the metallized film market in 2020. PP metallized film is a good moisture barrier but poor oxygen barrier. This film is metallized to improve its barrier properties and to increase the shelf life of packed products. Owing to its resistance to chemicals and its low odor, this film is suitable for use in applications regulated under the FDA regulations. The use of PP metallized film in packaging application for products which require a long shelf life, such as food, bakery products, snacks, and candies, is driving the growth of this market. This film is also widely used in the electrical & electronics industry for communication equipment, timing circuit, and filter networks. These factors are the key drivers for the glass fiber metallized film market.
Aluminum Metallized Film: Largest segment of metallized film market
Aluminum metallized film is expected to be the largest segment, by metal, during the forecast period. Aluminum metallized film offers excellent barrier performance against water vapor & gases, good metal bond strength, glossy appearance, good lamination bond strength, and good thermal & mechanical properties. Aluminum metallized film is used in packaging for snacks, frozen foods, sweets and pastries, frozen desserts, coffee pouches, and so on. Stand-up pouches allow printing of high-quality, glossy graphics on the package, which makes them attractive and appealing to customers. Such factors are expected to drive the demand for aluminum metallized film in Europe.
High demand from Europe: Major driver for metallized film market
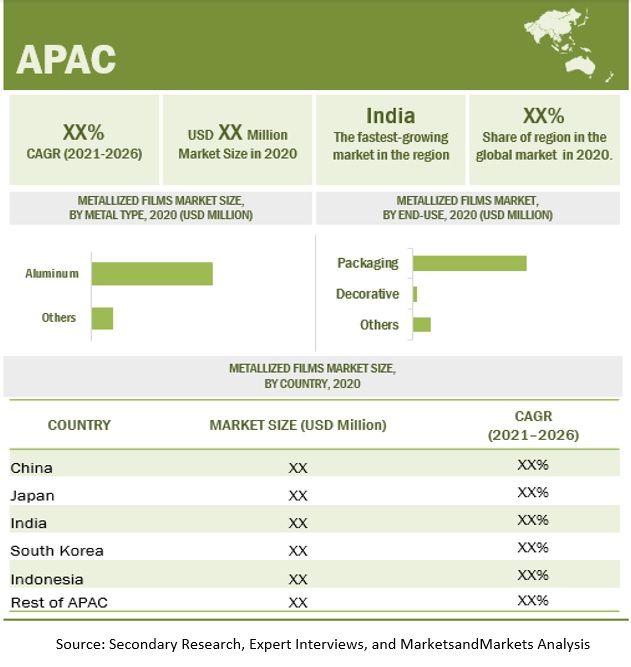
Europe is the second-largest metallized film market in terms of demand. With the recovery of the European economy and increasing demand for metallized films, the market is expected to grow in the coming years. The metallized film market in Europe is regulated by the Registration, Evaluation, Authorisation, and Restriction of Chemical Substances (REACH) which monitors and issues guidelines for protecting the environment and for preventing health hazards caused by chemicals. The future of metallized films in the European economy is strongly influenced by the environmental regulations and fluctuating raw material prices. The companies in this region collaborate with the companies in the US to develop environmentally friendly products.
To know about the assumptions considered for the study, download the pdf brochure
Metallized Film Market Players
Cosmo Films Ltd. (India), Jindal Poly Films Ltd. (India), Polinas (Turkey), and Toray Industries Inc. (Japan) are some of the players operating in the global market.
Metallized Film Market Report Scope
|
Report Metric |
Details |
|
Years considered for the study |
2017–2026 |
|
Base year |
2020 |
|
Forecast period |
2021–2026 |
|
Units considered |
Value (USD Million) and Volume (Kiloton) |
|
Segments |
Metal, Material Type, End-User, and Region. |
|
Regions |
APAC, North America, Europe, the Middle East & Africa, and South America |
|
Companies |
Cosmo Films (India), Jindal Poly Films (India), Uflex (India), Toray Industries (Japan), and Polinas (Turkey). |
This research report categorizes the metallized film market based on resin, vehicle type, application, and region.
Metallized Film Market based on the Material:
- Polypropylene (PP)
- Polyethylene Terephthalate (PET)
- Others
Metallized Film Market based on the Metal:
- Aluminum
- Others
Metallized Film Market based on the End-use Industry:
- Packaging
- Decorative
- Others
Metallized Film Market based on the Region:
- North America
- Europe
- APAC
- Middle East & Africa
- South America
Recent Developments
- In September 2020, Cosmo Films created a new transparent thermal lamination antimicrobial film based on BOPP. The antimicrobial technique utilized in this film addresses the global problem of bacterial infections on packaged products by using an entirely novel method to avoiding microbial growth on the surface. This antimicrobial film is efficient against a wide range of germs, inhibits germ development, and promotes good hygiene.
- In February 2020, The board of directors of Jindal Poly Films has approved its expansion plans of investment of Rs 700 crore in Polyester Film Line-1 and BOPP Film Line-9.
- In September 2018, FlexFilms, Uflex's worldwide film manufacturing arm, has introduced two new cutting-edge BOPET films: FLEXMETPROTECTTM F-HBP-M, an aluminium foil replacement metallized high-barrier BOPET film, and FLEXPETTM F-HPF, a puncture-resistant, nylon replacement BOPET film.
Frequently Asked Questions (FAQ):
What is the mid-to-long term impact of the developments undertaken in the industry?
Continuous developments in the market, including new product launches, mergers & acquisitions, investments & expansions, and partnership and agreement are expected to help the market grow. New product launch/development, merger & acquisition, and investment & expansion are some of the key strategies adopted by the players to achieve growth in the metallized film market.
What are the upcoming technologies used in metallized film industry?
Metallized films are raw materials for plastic films, which are used for the protection of various products against vapor, moisture, and gas. They are produced from PE, PP, PVC, PET/BOPET, and polyamide. These films are used in food & beverage packaging, pharmaceutical packaging, agriculture, and other end-use industries.
Which segment has the potential to register the highest market share?
Europe’s major share of the global metallized film market is due to the growing demand from end-use industries such as packaging and decorative. Globally, the high demand for packaged food products results in higher penetration of metallized films in the food industry.
What is the current competitive landscape in the metallized film market in terms of new technologies, production, and sales?
The competitive landscape of the metallized film market includes the important growth strategies adopted by the key players between 2016 and 2021. Toray Industries Inc., Uflex Ltd., Polyplex Corporation Ltd., Jindal Poly Films Limited, and Cosmo Films limited are some of the leading players that have adopted different growth strategies such as merger & acquisition, investment & expansion, partnership & agreement, and new product launch in the metallized film market.
What will be the growth prospects of the metallized film market?
Metallized films for packaging are important when the product requires extra protection to ensure longer shelf life. Metallized films also provide protective properties for food items requiring restricted visibility. Rising preference for packaged & processed food owing to their extended shelf life and prevention from contamination will create high growth opportunities for the metallized film market. This, in turn, is expected to drive the demand for metallized films, globally. .
To speak to our analyst for a discussion on the above findings, click Speak to Analyst

TABLE OF CONTENTS
1 INTRODUCTION (Page No. - 28)
1.1 OBJECTIVES OF THE STUDY
1.2 MARKET DEFINITION
1.3 MARKET INCLUSIONS AND EXCLUSIONS
1.3.1 MARKET INCLUSIONS
1.3.2 MARKET EXCLUSIONS
1.4 MARKET SCOPE
FIGURE 1 METALLIZED FILM MARKET SEGMENTATION
1.5 YEARS CONSIDERED FOR THE STUDY
1.6 CURRENCY
1.7 UNIT CONSIDERED
1.8 STAKEHOLDERS
1.9 SUMMARY OF CHANGES
2 RESEARCH METHODOLOGY (Page No. - 32)
2.1 RESEARCH DATA
FIGURE 2 METALLIZED FILM MARKET: RESEARCH DESIGN
2.1.1 SECONDARY DATA
2.1.1.1 Key data from secondary sources
2.1.2 PRIMARY DATA
2.1.2.1 Key primary data sources
2.1.2.2 Key data from primary sources
2.1.2.3 Key industry insights
2.1.2.4 Breakdown of primary interviews
2.2 MARKET SIZE ESTIMATION
2.2.1 BOTTOM-UP APPROACH
FIGURE 3 MARKET SIZE ESTIMATION: BOTTOM-UP APPROACH
FIGURE 4 MARKET SIZE ESTIMATION: BASE NUMBER CALCULATION
FIGURE 5 METALLIZED FILM MARKET, BY REGION
2.2.2 TOP-DOWN APPROACH
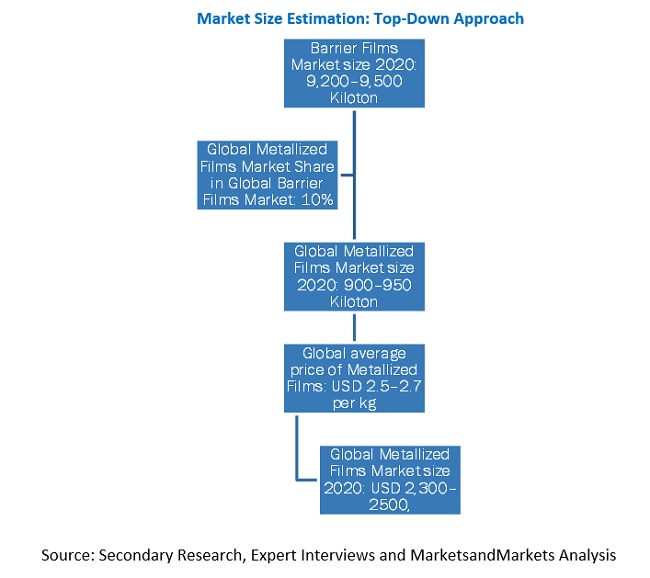
FIGURE 6 MARKET SIZE ESTIMATION: TOP-DOWN APPROACH
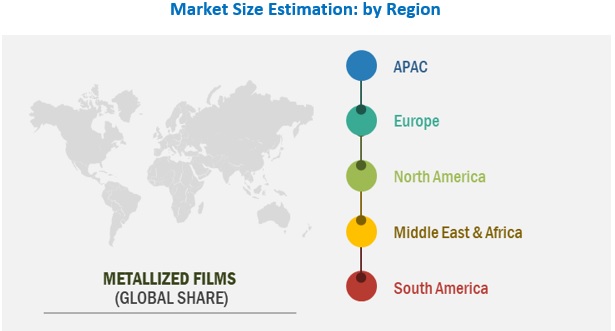
FIGURE 7 MARKET SIZE ESTIMATION: BY REGION
2.3 MARKET FORECAST APPROACH
2.3.1 SUPPLY-SIDE FORECAST
2.3.2 DEMAND-SIDE FORECAST PROJECTION
2.4 MARKET BREAKDOWN AND DATA TRIANGULATION
FIGURE 8 METALLIZED FILM MARKET: DATA TRIANGULATION
2.5 FACTOR ANALYSIS
2.6 ASSUMPTIONS
2.7 RISK ANALYSIS ASSESSMENT
2.8 LIMITATIONS
3 EXECUTIVE SUMMARY (Page No. - 43)
TABLE 1 METALLIZED FILMS: MARKET SNAPSHOT
FIGURE 9 APAC TO BE THE LARGEST AND FASTEST-GROWING REGIONAL-LEVEL MARKET BETWEEN 2021 AND 2026
FIGURE 10 PACKAGING INDUSTRY TO DOMINATE THE OVERALL METALLIZED FILM MARKET BETWEEN 2021 AND 2026
FIGURE 11 POLYPROPYLENE SEGMENT TO LEAD THE METALLIZED FILM MARKET BETWEEN 2021 AND 2026
FIGURE 12 ALUMINUM SEGMENT TO DOMINATE THE OVERALL MARKET BETWEEN 2021 AND 2026
FIGURE 13 EUROPE WAS THE LARGEST METALLIZED FILM MARKET IN 2020
TABLE 2 MAJOR PLAYERS PROFILED IN THIS REPORT
4 PREMIUM INSIGHTS (Page No. - 47)
4.1 ATTRACTIVE GROWTH OPPORTUNITIES IN THE METALLIZED FILM MARKET
FIGURE 14 EMERGING ECONOMIES OFFER LUCRATIVE GROWTH OPPORTUNITIES FOR MARKET PLAYERS
4.2 METALLIZED FILM MARKET, BY METAL
FIGURE 15 ALUMINUM METALLIZED FILMS SEGMENT TO DOMINATE THE OVERALL METALLIZED FILM MARKET
4.3 APAC: METALLIZED FILM MARKET, BY MATERIAL TYPE AND COUNTRY, 2020
FIGURE 16 PP SEGMENT AND CHINA ACCOUNTED FOR THE LARGEST SHARES
4.4 METALLIZED FILM MARKET: DEVELOPED VS. DEVELOPING COUNTRIES
FIGURE 17 DEVELOPING MARKETS TO GROW FASTER THAN DEVELOPED MARKETS
4.5 APAC METALLIZED FILM MARKET
FIGURE 18 INDIA TO BE THE FASTEST-GROWING MARKET IN THE REGION
5 MARKET OVERVIEW (Page No. - 50)
5.1 INTRODUCTION
5.2 VALUE CHAIN ANALYSIS
FIGURE 19 METALLIZED FILM MARKET: VALUE CHAIN ANALYSIS
TABLE 3 METALLIZED FILM MARKET: ECOSYSTEM
5.2.1 COVID-19 IMPACT ON VALUE CHAIN
5.2.1.1 Action plan against current vulnerability
5.3 MARKET DYNAMICS
FIGURE 20 DRIVERS, RESTRAINTS, OPPORTUNITIES, AND CHALLENGES IN THE METALLIZED FILM MARKET
5.3.1 DRIVERS
5.3.1.1 Demand for longer shelf life of food products
5.3.1.2 Increasing demand for customer-friendly packaging
5.3.1.3 Rising demand for metallized films from various end-use industries
5.3.2 RESTRAINTS
5.3.2.1 Stringent regulations on automotive films in various countries
5.3.3 OPPORTUNITIES
5.3.3.1 Increasing use of metallized films in the electronics industry
5.3.4 CHALLENGES
5.3.4.1 Issues in product inspection
5.3.4.2 Issues in the supply chain due to COVID-19
5.4 PORTER’S FIVE FORCES ANALYSIS
FIGURE 21 PORTER’S FIVE FORCES ANALYSIS: METALLIZED FILM MARKET
TABLE 4 METALLIZED FILM MARKET: PORTER’S FIVE FORCES ANALYSIS
5.4.1 THREAT OF NEW ENTRANTS
5.4.2 THREAT OF SUBSTITUTES
5.4.3 BARGAINING POWER OF BUYERS
5.4.4 BARGAINING POWER OF SUPPLIERS
5.4.5 INTENSITY OF COMPETITIVE RIVALRY
5.5 MACROECONOMIC OVERVIEW AND KEY TRENDS
5.5.1 INTRODUCTION
5.5.2 TRENDS AND FORECAST OF GDP
TABLE 5 TRENDS AND FORECAST OF GDP, PERCENTAGE CHANGE, 2018–2025
5.5.3 INCREASE IN MIDDLE-CLASS POPULATION, 2019–2025
TABLE 6 REGION-WISE FORECAST OF THE PACKAGING INDUSTRY
5.6 COVID-19 IMPACT ANALYSIS
5.6.1 COVID-19 ECONOMIC ASSESSMENT
FIGURE 22 LATEST WORLD ECONOMIC OUTLOOK GROWTH PROJECTIONS
5.6.2 COVID-19 ECONOMIC IMPACT – SCENARIO ASSESSMENT
FIGURE 23 FACTORS IMPACTING ECONOMY OF SELECT G20 COUNTRIES IN 2020
5.6.3 IMPACT ON METALLIZED FILMS INDUSTRY
5.6.3.1 Economic outlook by International Monetary Fund (IMF)
TABLE 7 COVID-19 IMPACT: ECONOMIC OUTLOOK, 2020–2021
5.6.3.2 Stimulus package by G-20 countries
TABLE 8 RELIEF PACKAGES ANNOUNCED BY G-20 COUNTRIES
5.7 AVERAGE PRICING ANALYSIS
FIGURE 24 AVERAGE PRICE COMPETITIVENESS IN THE METALLIZED FILM MARKET
5.8 METALLIZED FILMS ECOSYSTEM
FIGURE 25 METALLIZED FILMS ECOSYSTEM
5.8.1 YC AND YCC SHIFT
FIGURE 26 YCC SHIFT FOR METALLIZED FILMS INDUSTRY
5.9 OPERATIONAL DATA AND KEY INDUSTRY TRENDS
5.9.1 PHARMACEUTICAL SALES GLOBALLY 2017–2020
5.9.2 PACKAGED FOOD SALES GLOBALLY 2017–2019
5.10 METALLIZED FILMS PATENT ANALYSIS
5.10.1 METHODOLOGY
5.10.2 PUBLICATION TRENDS
FIGURE 27 PUBLICATION TRENDS, 2017–2021
5.10.3 INSIGHT
5.10.4 JURISDICTION ANALYSIS
FIGURE 28 JURISDICTION ANALYSIS OF REGISTERED PATENTS, 2017–2021
5.11 TRADE ANALYSIS
5.11.1 IMPORT-EXPORT SCENARIO OF METALLIZED FILM MARKET
TABLE 9 IMPORT-EXPORT TRADE DATA FOR SELECT COUNTRIES, 2019
5.12 CASE STUDY ANALYSIS
5.13 TECHNOLOGY ANALYSIS
5.13.1 POLYAMIDE (PA)
5.13.2 POLYETHYLENE
TABLE 10 PROCESSES COMMONLY USED TO MANUFACTURE POLYETHYLENE RESIN
5.13.3 POLYPROPYLENE
TABLE 11 PROCESSES COMMONLY USED TO MANUFACTURE POLYPROPYLENE RESIN
6 METALLIZED FILM MARKET, BY MATERIAL (Page No. - 72)
6.1 INTRODUCTION
FIGURE 29 PP SEGMENT TO DOMINATE THE METALLIZED FILM MARKET DURING THE FORECAST PERIOD
TABLE 12 METALLIZED FILM MARKET SIZE, BY MATERIAL, 2016–2019 (KILOTON)
TABLE 13 METALLIZED FILM MARKET SIZE, BY MATERIAL, 2020–2026 (KILOTON)
TABLE 14 METALLIZED FILM MARKET SIZE, BY MATERIAL, 2016–2019 (USD MILLION)
TABLE 15 METALLIZED FILM MARKET SIZE, BY MATERIAL, 2020–2026 (USD MILLION)
6.2 POLYPROPYLENE (PP)
6.2.1 PP METALLIZED FILMS ARE SUITABLE FOR USE IN THE PACKAGING APPLICATION
TABLE 16 PP METALLIZED FILM MARKET SIZE, BY REGION, 2016–2019 (KILOTON)
TABLE 17 PP METALLIZED FILM MARKET SIZE, BY REGION, 2020–2026 (KILOTON)
TABLE 18 PP METALLIZED FILM MARKET SIZE, BY REGION, 2016–2019 (USD MILLION)
TABLE 19 PP METALLIZED FILM MARKET SIZE, BY REGION, 2020–2026 (USD MILLION)
6.3 POLYETHYLENE TEREPHTHALATE (PET)
6.3.1 PET METALLIZED FILMS ARE IDEAL FOR APPLICATIONS THAT REQUIRE THE PRESERVATION OF FLAVOR AND FRESHNESS
TABLE 20 PET METALLIZED FILM MARKET SIZE, BY REGION, 2016–2019 (KILOTON)
TABLE 21 PET METALLIZED FILM MARKET SIZE, BY REGION, 2020–2026 (KILOTON)
TABLE 22 PET METALLIZED FILM MARKET SIZE, BY REGION, 2016–2019 (USD MILLION)
TABLE 23 PET METALLIZED FILM MARKET SIZE, BY REGION, 2020–2026 (USD MILLION)
6.4 OTHERS
TABLE 24 OTHER METALLIZED FILM MARKET SIZE, BY REGION, 2016–2019 (KILOTON)
TABLE 25 OTHER METALLIZED FILM MARKET SIZE, BY REGION, 2020–2026 (KILOTON)
TABLE 26 OTHER METALLIZED FILM MARKET SIZE, BY REGION, 2016–2019 (USD MILLION)
TABLE 27 OTHER METALLIZED FILM MARKET SIZE, BY REGION, 2020–2026 (USD MILLION)
7 METALLIZED FILM MARKET, BY METAL (Page No. - 80)
7.1 INTRODUCTION
FIGURE 30 ALUMINUM TO DOMINATE THE OVERALL METALLIZED FILM MARKET DURING
FIGURE 31 THE FORECAST PERIOD
TABLE 28 METALLIZED FILM MARKET SIZE, BY METAL, 2016–2019 (KILOTON)
TABLE 29 METALLIZED FILM MARKET SIZE, BY METAL, 2020–2026 (KILOTON)
TABLE 30 METALLIZED FILM MARKET SIZE, BY METAL, 2016–2019 (USD MILLION)
TABLE 31 METALLIZED FILM MARKET SIZE, BY METAL, 2020–2026 (USD MILLION)
7.2 ALUMINUM
7.2.1 ALUMINUM IS AN IDEAL MATERIAL FOR RECYCLING AS IT IS EASY TO RECLAIM AND PROCESS INTO NEW PRODUCTS
TABLE 32 ALUMINUM-BASED METALLIZED FILM MARKET SIZE, BY REGION, 2016–2019 (KILOTON)
TABLE 33 ALUMINUM-BASED METALLIZED FILM MARKET SIZE, BY REGION, 2020–2026 (KILOTON)
TABLE 34 ALUMINUM-BASED METALLIZED FILM MARKET SIZE, BY REGION, 2016–2019 (USD MILLION)
TABLE 35 ALUMINUM-BASED METALLIZED FILM MARKET SIZE, BY REGION, 2020–2026 (USD MILLION)
7.3 OTHERS
TABLE 36 OTHERS METALLIZED FILM MARKET SIZE, BY REGION, 2016–2019 (KILOTON)
TABLE 37 OTHERS METALLIZED FILM MARKET SIZE, BY REGION, 2020–2026 (KILOTON)
TABLE 38 OTHERS METALLIZED FILM MARKET SIZE, BY REGION, 2016–2019 (USD MILLION)
TABLE 39 OTHERS METALLIZED FILM MARKET SIZE, BY REGION, 2020–2026 (USD MILLION)
8 METALLIZED FILM MARKET, BY END-USE INDUSTRY (Page No. - 87)
8.1 INTRODUCTION
FIGURE 32 PACKAGING INDUSTRY TO DOMINATE METALLIZED FILM MARKET DURING THE FORECAST PERIOD
TABLE 40 METALLIZED FILM MARKET SIZE, BY END-USE INDUSTRY, 2016–2019 (KILOTON)
TABLE 41 METALLIZED FILM MARKET SIZE, BY END-USE INDUSTRY, 2020–2026 (KILOTON)
TABLE 42 METALLIZED FILM MARKET SIZE, BY END-USE INDUSTRY, 2016–2019 (USD MILLION)
TABLE 43 METALLIZED FILM MARKET SIZE, BY END-USE INDUSTRY, 2020–2026 (USD MILLION)
8.2 PACKAGING
8.2.1 METALLIZED FILMS ARE USED TO ADD BARRIER PROPERTY IN THE PACKAGING OF PROCESSED FOODS
8.2.2 FOOD & BEVERAGES
8.2.3 HEALTHCARE
8.2.4 PERSONAL CARE
8.2.5 PET FOOD
8.2.6 ESD PACKAGING
TABLE 44 METALLIZED FILM MARKET SIZE IN PACKAGING INDUSTRY, BY REGION, 2016–2019 (KILOTON)
TABLE 45 METALLIZED FILM MARKET SIZE IN PACKAGING INDUSTRY, BY REGION, 2020–2026 (KILOTON)
TABLE 46 METALLIZED FILM MARKET SIZE IN PACKAGING INDUSTRY, BY REGION, 2016–2019 (USD MILLION)
TABLE 47 METALLIZED FILM MARKET SIZE IN PACKAGING INDUSTRY, BY REGION, 2020–2026 (USD MILLION)
8.3 DECORATIVE
8.3.1 GROWING E-COMMERCE TO DRIVE THE DEMAND FOR DECORATIVE PACKAGING
TABLE 48 METALLIZED FILM MARKET SIZE IN DECORATIVE INDUSTRY, BY REGION, 2016–2019 (KILOTON)
TABLE 49 METALLIZED FILM MARKET SIZE IN DECORATIVE INDUSTRY, BY REGION, 2020–2026 (KILOTON)
TABLE 50 METALLIZED FILM MARKET SIZE IN DECORATIVE INDUSTRY, BY REGION, 2016–2019 (USD MILLION)
TABLE 51 METALLIZED FILM MARKET SIZE IN DECORATIVE INDUSTRY, BY REGION, 2020–2026 (USD MILLION)
8.4 OTHERS
TABLE 52 METALLIZED FILM MARKET SIZE IN OTHER INDUSTRIES, BY REGION, 2016–2019 (KILOTON)
TABLE 53 METALLIZED FILM MARKET SIZE IN OTHER INDUSTRIES, BY REGION, 2020–2026 (KILOTON)
TABLE 54 METALLIZED FILM MARKET SIZE IN OTHER INDUSTRIES, BY REGION, 2016–2019 (USD MILLION)
TABLE 55 METALLIZED FILM MARKET SIZE IN OTHER INDUSTRIES, BY REGION, 2020–2026 (USD MILLION)
9 METALLIZED FILM MARKET, BY REGION (Page No. - 96)
9.1 INTRODUCTION
TABLE 56 METALLIZED FILM MARKET SIZE, BY REGION, 2016–2019 (KILOTON)
TABLE 57 METALLIZED FILM MARKET SIZE, BY REGION, 2020–2026 (KILOTON)
TABLE 58 METALLIZED FILM MARKET SIZE, BY REGION, 2016–2019 (USD MILLION)
TABLE 59 METALLIZED FILM MARKET SIZE, BY REGION, 2020–2026 (USD MILLION)
9.2 APAC
9.2.1 IMPACT OF COVID-19 ON APAC
FIGURE 33 APAC: METALLIZED FILM MARKET SNAPSHOT
9.2.2 APAC METALLIZED FILM MARKET, BY MATERIAL
TABLE 60 APAC: METALLIZED FILM MARKET SIZE, BY MATERIAL, 2016–2019 (KILOTON)
TABLE 61 APAC: METALLIZED FILM MARKET SIZE, BY MATERIAL, 2020–2026 (KILOTON)
TABLE 62 APAC: METALLIZED FILM MARKET SIZE, BY MATERIAL, 2016–2019 (USD MILLION)
TABLE 63 APAC: METALLIZED FILM MARKET SIZE, BY MATERIAL, 2020–2026 (USD MILLION)
9.2.3 APAC METALLIZED FILM MARKET, BY METAL
TABLE 64 APAC: METALLIZED FILM MARKET SIZE, BY METAL, 2016–2019 (KILOTON)
TABLE 65 APAC: METALLIZED FILM MARKET SIZE, BY METAL, 2020–2026 (KILOTON)
TABLE 66 APAC: METALLIZED FILM MARKET SIZE, BY METAL, 2016–2019 (USD MILLION)
TABLE 67 APAC: METALLIZED FILM MARKET SIZE, BY METAL, 2020–2026 (USD MILLION)
9.2.4 APAC METALLIZED FILM MARKET, BY END-USE INDUSTRY
TABLE 68 APAC: METALLIZED FILM MARKET SIZE, BY END-USE INDUSTRY, 2016–2019 (KILOTON)
TABLE 69 APAC: METALLIZED FILM MARKET SIZE, BY END-USE INDUSTRY, 2020–2026 (KILOTON)
TABLE 70 APAC: METALLIZED FILM MARKET SIZE, BY END-USE INDUSTRY, 2016–2019 (USD MILLION)
TABLE 71 APAC: METALLIZED FILM MARKET SIZE, BY END-USE INDUSTRY, 2020–2026 (USD MILLION)
9.2.5 APAC METALLIZED FILM MARKET, BY COUNTRY
TABLE 72 APAC: METALLIZED FILM MARKET SIZE, BY COUNTRY, 2016–2019 (KILOTON)
TABLE 73 APAC: METALLIZED FILM MARKET SIZE, BY COUNTRY, 2020–2026 (KILOTON)
TABLE 74 APAC: METALLIZED FILM MARKET SIZE, BY COUNTRY, 2016–2019 (USD MILLION)
TABLE 75 APAC: METALLIZED FILM MARKET SIZE, BY COUNTRY, 2020–2026 (USD MILLION)
9.2.5.1 China
9.2.5.1.1 Growing demand for processed & semi-processed food to drive the market
9.2.5.2 Japan
9.2.5.2.1 Increasing use of metallized films in food & beverage and pharmaceutical packaging to drive the market
9.2.5.3 South Korea
9.2.5.3.1 Increasing demand for packaged food and blister packaging in the pharmaceutical industry to drive the demand
9.2.5.4 India
9.2.5.4.1 Growth in the demand for FMCG and convenience products to increase the demand for metallized films
9.2.5.5 Indonesia
9.2.5.5.1 Rising consumer spending and growing food & beverage industry to boost the market
9.2.5.6 Rest of APAC
9.3 EUROPE
9.3.1 COVID-19 IMPACT ON EUROPE
FIGURE 34 EUROPE: METALLIZED FILM MARKET SNAPSHOT
9.3.2 EUROPEAN METALLIZED FILM MARKET, BY MATERIAL
TABLE 76 EUROPE: METALLIZED FILM MARKET SIZE, BY MATERIAL, 2016–2019 (KILOTON)
TABLE 77 EUROPE: METALLIZED FILM MARKET SIZE, BY MATERIAL, 2020–2026 (KILOTON)
TABLE 78 EUROPE: METALLIZED FILM MARKET SIZE, BY MATERIAL, 2016–2019 (USD MILLION)
TABLE 79 EUROPE: METALLIZED FILM MARKET SIZE, BY MATERIAL, 2020–2026 (USD MILLION)
9.3.3 EUROPEAN METALLIZED FILM MARKET, BY METAL
TABLE 80 EUROPE: METALLIZED FILM MARKET SIZE, BY METAL, 2016–2019 (KILOTON)
TABLE 81 EUROPE: METALLIZED FILM MARKET SIZE, BY METAL, 2020–2026 (KILOTON)
TABLE 82 EUROPE: METALLIZED FILM MARKET SIZE, BY METAL, 2016–2019 (USD MILLION)
TABLE 83 EUROPE: METALLIZED FILM MARKET SIZE, BY METAL, 2020–2026 (USD MILLION)
9.3.4 EUROPEAN METALLIZED FILM MARKET, BY END-USE INDUSTRY
TABLE 84 EUROPE: METALLIZED FILM MARKET SIZE, BY END-USE INDUSTRY, 2016–2019 (KILOTON)
TABLE 85 EUROPE: METALLIZED FILM MARKET SIZE, BY END-USE INDUSTRY, 2020–2026 (KILOTON)
TABLE 86 EUROPE: METALLIZED FILM MARKET SIZE, BY END-USE INDUSTRY, 2016–2019 (USD MILLION)
TABLE 87 EUROPE: METALLIZED FILM MARKET SIZE, BY END-USE INDUSTRY, 2020–2026 (USD MILLION)
9.3.5 EUROPEAN METALLIZED FILM MARKET, BY COUNTRY
TABLE 88 EUROPE: METALLIZED FILM MARKET SIZE, BY COUNTRY, 2016–2019 (KILOTON)
TABLE 89 EUROPE: METALLIZED FILM MARKET SIZE, BY COUNTRY, 2020–2026 (KILOTON)
TABLE 90 EUROPE: METALLIZED FILM MARKET SIZE, BY COUNTRY, 2016–2019 (USD MILLION)
TABLE 91 EUROPE: METALLIZED FILM MARKET SIZE, BY COUNTRY, 2020–2026 (USD MILLION)
9.3.5.1 Germany
9.3.5.1.1 Germany has the largest metallized films industry in the region
9.3.5.2 France
9.3.5.2.1 A net exporter of metallized films
9.3.5.3 UK
9.3.5.3.1 One of the top five metallized films producers in Europe
9.3.5.4 Italy
9.3.5.4.1 One of the key markets for metallized films in the region
9.3.5.5 Russia
9.3.5.5.1 Packaging demand in major end-use industries is driving the market growth
9.3.5.6 Turkey
9.3.5.6.1 Producer and exporter of food & beverage products globally
9.3.5.7 Rest of Europe
9.4 NORTH AMERICA
9.4.1 IMPACT OF COVID-19 ON NORTH AMERICA
FIGURE 35 NORTH AMERICA: METALLIZED FILM MARKET SNAPSHOT
9.4.2 NORTH AMERICAN METALLIZED FILM MARKET, BY MATERIAL
TABLE 92 NORTH AMERICA: METALLIZED FILM MARKET SIZE, BY MATERIAL, 2016–2019 (KILOTON)
TABLE 93 NORTH AMERICA: METALLIZED FILM MARKET SIZE, BY MATERIAL, 2020–2026 (KILOTON)
TABLE 94 NORTH AMERICA: METALLIZED FILM MARKET SIZE, BY MATERIAL, 2016–2019 (USD MILLION)
TABLE 95 NORTH AMERICA: METALLIZED FILM MARKET SIZE, BY MATERIAL, 2020–2026 (USD MILLION)
9.4.3 NORTH AMERICAN METALLIZED FILM MARKET, BY METAL
TABLE 96 NORTH AMERICA: METALLIZED FILM MARKET SIZE, BY METAL, 2016–2019 (KILOTON)
TABLE 97 NORTH AMERICA: METALLIZED FILM MARKET SIZE, BY METAL, 2020–2026 (KILOTON)
TABLE 98 NORTH AMERICA: METALLIZED FILM MARKET SIZE, BY METAL, 2016–2019 (USD MILLION)
TABLE 99 NORTH AMERICA: METALLIZED FILM MARKET SIZE, BY METAL, 2020–2026 (USD MILLION)
9.4.4 NORTH AMERICAN METALLIZED FILM MARKET, BY END-USE INDUSTRY
TABLE 100 NORTH AMERICA: METALLIZED FILM MARKET SIZE, BY END-USE INDUSTRY, 2016–2019 (KILOTON)
TABLE 101 NORTH AMERICA: METALLIZED FILM MARKET SIZE, BY END-USE INDUSTRY, 2020–2026 (KILOTON)
TABLE 102 NORTH AMERICA: METALLIZED FILM MARKET SIZE, BY END-USE INDUSTRY, 2016–2019 (USD MILLION)
TABLE 103 NORTH AMERICA: METALLIZED FILM MARKET SIZE, BY END-USE INDUSTRY, 2020–2026 (USD MILLION)
9.4.5 NORTH AMERICAN METALLIZED FILM MARKET, BY COUNTRY
TABLE 104 NORTH AMERICA: METALLIZED FILM MARKET SIZE, BY COUNTRY, 2016–2019 (KILOTON)
TABLE 105 NORTH AMERICA: METALLIZED FILM MARKET SIZE, BY COUNTRY, 2020–2026 (KILOTON)
TABLE 106 NORTH AMERICA: METALLIZED FILM MARKET SIZE, BY COUNTRY, 2016–2019 (USD MILLION)
TABLE 107 NORTH AMERICA: METALLIZED FILM MARKET SIZE, BY COUNTRY, 2020–2026 (USD MILLION)
9.4.5.1 US
9.4.5.1.1 Largest consumer of metallized films in the region
9.4.5.2 Canada
9.4.5.2.1 Increasing food production favoring the market growth
9.4.5.3 Mexico
9.4.5.3.1 Demand for packaging to influence the market
9.5 MIDDLE EAST & AFRICA
FIGURE 36 UAE TO BE THE FASTEST-GROWING COUNTRY BETWEEN 2021 AND 2026
9.5.1 COVID-19 IMPACT ON THE MIDDLE EAST & AFRICA
9.5.2 MIDDLE EAST & AFRICAN METALLIZED FILM MARKET, BY MATERIAL
TABLE 108 MIDDLE EAST & AFRICA: METALLIZED FILM MARKET SIZE, BY MATERIAL, 2016–2019 (KILOTON)
TABLE 109 MIDDLE EAST & AFRICA: METALLIZED FILM MARKET SIZE, BY MATERIAL, 2020–2026 (KILOTON)
TABLE 110 MIDDLE EAST & AFRICA: METALLIZED FILM MARKET SIZE, BY MATERIAL, 2016–2019 (USD MILLION)
TABLE 111 MIDDLE EAST & AFRICA: METALLIZED FILM MARKET SIZE, BY MATERIAL, 2020–2026 (USD MILLION)
9.5.3 MIDDLE EAST & AFRICAN METALLIZED FILM MARKET, BY METAL
TABLE 112 MIDDLE EAST & AFRICA: METALLIZED FILM MARKET SIZE, BY METAL, 2016–2019 (KILOTON)
TABLE 113 MIDDLE EAST & AFRICA: METALLIZED FILM MARKET SIZE, BY METAL, 2020–2026 (KILOTON)
TABLE 114 MIDDLE EAST & AFRICA: METALLIZED FILM MARKET SIZE, BY METAL, 2016–2019 (USD MILLION)
TABLE 115 MIDDLE EAST & AFRICA: METALLIZED FILM MARKET SIZE, BY METAL, 2020–2026 (USD MILLION)
9.5.4 MIDDLE EAST & AFRICAN METALLIZED FILM MARKET, BY END-USE INDUSTRY
TABLE 116 MIDDLE EAST & AFRICA: METALLIZED FILM MARKET SIZE, BY END-USE INDUSTRY, 2016–2019 (KILOTON)
TABLE 117 MIDDLE EAST & AFRICA: METALLIZED FILM MARKET SIZE, BY END-USE INDUSTRY, 2020–2026 (KILOTON)
TABLE 118 MIDDLE EAST & AFRICA: METALLIZED FILM MARKET SIZE, BY END-USE INDUSTRY, 2016–2019 (USD MILLION)
TABLE 119 MIDDLE EAST & AFRICA: METALLIZED FILM MARKET SIZE, BY END-USE INDUSTRY, 2020–2026 (USD MILLION)
9.5.5 MIDDLE EAST & AFRICAN METALLIZED FILM MARKET, BY COUNTRY
TABLE 120 MIDDLE EAST & AFRICA: METALLIZED FILM MARKET SIZE, BY COUNTRY, 2016–2019 (KILOTON)
TABLE 121 MIDDLE EAST & AFRICA: METALLIZED FILM MARKET SIZE, BY COUNTRY, 2020–2026 (KILOTON)
TABLE 122 MIDDLE EAST & AFRICA: METALLIZED FILM MARKET SIZE, BY COUNTRY, 2016–2019 (USD MILLION)
TABLE 123 MIDDLE EAST & AFRICA: METALLIZED FILM MARKET SIZE, BY COUNTRY, 2020–2026 (USD MILLION)
9.5.5.1 Saudi Arabia
9.5.5.1.1 Packaged foods to drive the market
9.5.5.2 UAE
9.5.5.2.1 New infrastructural developments to drive the market
9.5.5.3 South Africa
9.5.5.3.1 Urbanization in the country to boost the market
9.5.5.4 Rest of Middle East & Africa
9.6 SOUTH AMERICA
FIGURE 37 BRAZIL TO REGISTER HIGH GROWTH BETWEEN 2021 AND 2026
9.6.1 IMPACT OF COVID-19 ON SOUTH AMERICA
9.6.2 SOUTH AMERICAN METALLIZED FILM MARKET, BY MATERIAL
TABLE 124 SOUTH AMERICA: METALLIZED FILM MARKET SIZE, BY MATERIAL, 2016–2019 (KILOTON)
TABLE 125 SOUTH AMERICA: METALLIZED FILM MARKET SIZE, BY MATERIAL, 2020–2026 (KILOTON)
TABLE 126 SOUTH AMERICA: METALLIZED FILM MARKET SIZE, BY MATERIAL, 2016–2019 (USD MILLION)
TABLE 127 SOUTH AMERICA: METALLIZED FILM MARKET SIZE, BY MATERIAL, 2020–2026 (USD MILLION)
9.6.3 SOUTH AMERICAN METALLIZED FILM MARKET, BY METAL
TABLE 128 SOUTH AMERICA: METALLIZED FILM MARKET SIZE, BY METAL, 2016–2019 (KILOTON)
TABLE 129 SOUTH AMERICA: METALLIZED FILM MARKET SIZE, BY METAL, 2020–2026 (KILOTON)
TABLE 130 SOUTH AMERICA: METALLIZED FILM MARKET SIZE, BY METAL, 2016–2019 (USD MILLION)
TABLE 131 SOUTH AMERICA: METALLIZED FILM MARKET SIZE, BY METAL, 2020–2026 (USD MILLION)
9.6.4 SOUTH AMERICAN METALLIZED FILM MARKET, BY END-USE INDUSTRY
TABLE 132 SOUTH AMERICA: METALLIZED FILM MARKET SIZE, BY END-USE INDUSTRY, 2016–2019 (KILOTON)
TABLE 133 SOUTH AMERICA: METALLIZED FILM MARKET SIZE, BY END-USE INDUSTRY, 2020–2026 (KILOTON)
TABLE 134 SOUTH AMERICA: METALLIZED FILM MARKET SIZE, BY END-USE INDUSTRY, 2016–2019 (USD MILLION)
TABLE 135 SOUTH AMERICA: METALLIZED FILM MARKET SIZE, BY END-USE INDUSTRY, 2020–2026 (USD MILLION)
9.6.5 SOUTH AMERICAN METALLIZED FILM MARKET, BY COUNTRY
TABLE 136 SOUTH AMERICA: METALLIZED FILM MARKET SIZE, BY COUNTRY, 2016–2019 (KILOTON)
TABLE 137 SOUTH AMERICA: METALLIZED FILM MARKET SIZE, BY COUNTRY, 2020–2026 (KILOTON)
TABLE 138 SOUTH AMERICA: METALLIZED FILM MARKET SIZE, BY COUNTRY, 2016–2019 (USD MILLION)
TABLE 139 SOUTH AMERICA: METALLIZED FILM MARKET SIZE, BY COUNTRY, 2020–2026 (USD MILLION)
9.6.5.1 Brazil
9.6.5.1.1 Export of food materials to support market growth
9.6.5.2 Argentina
9.6.5.2.1 Expansion of end-use industries to drive the market
9.6.5.3 Rest of South America
10 COMPETITIVE LANDSCAPE (Page No. - 134)
10.1 OVERVIEW
FIGURE 38 STRATEGIES FOLLOWED BY LEADING PLAYERS
10.2 MARKET SHARE ANALYSIS
TABLE 140 METALLIZED FILM MARKET: DEGREE OF COMPETITION
FIGURE 39 METALLIZED FILM: MARKET SHARE ANALYSIS IN 2020
10.2.1 MARKET RANKING ANALYSIS
TABLE 141 RANKING OF KEY PLAYERS
10.3 COMPANY REVENUE ANALYSIS
FIGURE 40 REVENUE ANALYSIS FOR KEY COMPANIES IN THE PAST 5 YEARS
10.4 COMPANY EVALUATION QUADRANT MATRIX, 2020
10.4.1 STAR
10.4.2 EMERGING LEADERS
10.4.3 PERVASIVE
10.4.4 PARTICIPANTS
FIGURE 41 METALLIZED FILM MARKET: COMPETITIVE LEADERSHIP MAPPING, 2020
10.5 SME MATRIX, 2020
10.5.1 PROGRESSIVE COMPANIES
10.5.2 DYNAMIC COMPANIES
10.5.3 STARTING BLOCKS
10.5.4 RESPONSIVE COMPANIES
FIGURE 42 METALLIZED FILM MARKET: EMERGING COMPANIES COMPETITIVE LEADERSHIP MAPPING, 2020
10.6 STRENGTH OF PRODUCT PORTFOLIO
10.7 BUSINESS STRATEGY EXCELLENCE
10.8 COMPETITIVE SCENARIO
10.8.1 MARKET EVALUATION FRAMEWORK
TABLE 142 STRATEGIC DEVELOPMENTS, BY COMPANY
TABLE 143 MOST FOLLOWED STRATEGY
TABLE 144 GROWTH STRATEGIES ADOPTED BY KEY COMPANIES
10.8.2 MARKET EVALUATION MATRIX
TABLE 145 COMPANY PRODUCT FOOTPRINT
TABLE 146 COMPANY REGION FOOTPRINT
TABLE 147 COMPANY INDUSTRY FOOTPRINT
10.9 STRATEGIC DEVELOPMENTS
TABLE 148 NEW PRODUCT LAUNCH/DEVELOPMENT, 2016–2021
TABLE 149 DEALS, 2016–2021
TABLE 150 OTHER DEVELOPMENTS, 2016–2021
11 COMPANY PROFILES (Page No. - 147)
11.1 KEY PLAYERS
(Business Overview, Products Offered, Recent Developments, MnM view, Key strengths/Right to win, Strategic choices, Weaknesses and competitive threats)*
11.1.1 COSMO FILMS LIMITED
TABLE 151 COSMO FILMS LIMITED: COMPANY OVERVIEW
FIGURE 43 COSMO FILMS LIMITED: COMPANY SNAPSHOT
TABLE 152 COSMO FILMS LIMITED: NEW PRODUCT LAUNCH
TABLE 153 COSMO FILMS LIMITED: OTHER DEVELOPMENTS
11.1.2 JINDAL POLY FILMS LIMITED
TABLE 154 JINDAL POLY FILMS LIMITED: COMPANY OVERVIEW
FIGURE 44 JINDAL POLY FILMS LIMITED: COMPANY SNAPSHOT
TABLE 155 JINDAL POLY FILMS LIMITED: DEALS
TABLE 156 JINDAL POLY FILMS LIMITED: OTHER DEVELOPMENTS
11.1.3 UFLEX LTD.
TABLE 157 UFLEX LTD.: COMPANY OVERVIEW
FIGURE 45 UFLEX LTD.: COMPANY SNAPSHOT
TABLE 158 UFLEX LTD.: NEW PRODUCT LAUNCH
11.1.4 POLYPLEX CORPORATION LTD.
TABLE 159 POLYPLEX CORPORATION LTD.: COMPANY OVERVIEW
FIGURE 46 POLYPLEX CORPORATION LTD: COMPANY SNAPSHOT
11.1.5 TORAY INDUSTRIES INC.
TABLE 160 TORAY INDUSTRIES INC.: COMPANY OVERVIEW
FIGURE 47 TORAY INDUSTRIES INC.: COMPANY SNAPSHOT
TABLE 161 TORAY INDUSTRIES INC.: NEW PRODUCT LAUNCH
TABLE 162 TORAY INDUSTRIES INC.: OTHER DEVELOPMENTS
11.1.6 TAGHLEEF INDUSTRIES LLC
TABLE 163 TAGHLEEF INDUSTRIES LLC: COMPANY OVERVIEW
11.1.7 BOLLORE INC.
TABLE 164 BOLLORE INC.: COMPANY OVERVIEW
11.1.8 POLINAS
TABLE 165 POLINAS: COMPANY OVERVIEW
11.1.9 ESTER INDUSTRIES
TABLE 166 ESTER INDUSTRIES.: COMPANY OVERVIEW
FIGURE 48 ESTER INDUSTRIES: COMPANY SNAPSHOT
1.1.10 DUNMORE
TABLE 167 DUNMORE: COMPANY OVERVIEW
11.2 OTHER PLAYERS
11.2.1 SRF LIMITED
11.2.2 AVERY DENNISON CORPORATION
11.2.3 CELPLAST METALLIZED PRODUCTS LIMITED
11.2.4 ULTIMATE FILMS
11.2.5 PATIDAR CORPORATION
11.2.6 ACCURED PLASTICS LTD.
11.2.7 ROL-VAC, LP
11.2.8 ALL FOILS INC.
11.2.9 MANUCOR S.P.A.
11.2.10 KLÖCKNER PENTAPLAST
11.2.11 JOLYBAR FILMTECHNIC CONVERTING LTD.
11.2.12 ZHEJIANG PENGYUAN NEW MATERIAL CO., LTD.
11.2.13 CHIRIPAL POLY FILMS
11.2.14 KAVERI METALLISING & COATING IND. PRIVATE LIMITED
11.2.15 SUMILON
*Details on Business Overview, Products Offered, Recent Developments, MnM view, Key strengths/Right to win, Strategic choices, Weaknesses and competitive threats might not be captured in case of unlisted companies.
12 ADJACENT/RELATED MARKETS (Page No. - 169)
12.1 INTRODUCTION
12.2 LIMITATION
12.3 BARRIER FILM MARKET
12.3.1 MARKET DEFINITION
12.3.2 BARRIER FILM MARKET, BY MATERIAL
12.3.2.1 Introduction
TABLE 168 BARRIER FILM MARKET SIZE, BY MATERIAL, 2018–2025 (USD MILLION)
12.3.2.2 Polyethylene (PE)
12.3.2.3 Polypropylene (PP)
12.3.2.4 Polyethylene Terephthalate (PET/BOPET)
12.3.2.5 Polyamide (PA)
12.3.2.6 Organic coatings
12.3.2.7 Inorganic oxide coatings
12.3.2.8 Others
12.3.3 BARRIER FILM MARKET, BY END-USE INDUSTRY
12.3.3.1 Introduction
TABLE 169 BARRIER FILM MARKET SIZE, BY END-USE INDUSTRY, 2018–2025 (USD MILLION)
12.3.3.2 Food & beverage packaging
12.3.3.3 Pharmaceutical packaging
12.3.3.4 Agriculture
12.3.3.5 Others
12.3.4 BARRIER FILM MARKET, BY REGION
12.3.4.1 Introduction
TABLE 170 BARRIER FILM MARKET SIZE, BY REGION, 2018–2025 (USD MILLION)
12.3.4.2 APAC
12.3.4.3 North America
12.3.4.4 Europe
12.3.4.5 South America
12.3.4.6 Middle East & Africa
13 APPENDIX (Page No. - 176)
13.1 DISCUSSION GUIDE
13.2 KNOWLEDGE STORE: MARKETSANDMARKETS SUBSCRIPTION PORTAL
13.3 AVAILABLE CUSTOMIZATIONS
13.4 RELATED REPORTS
13.5 AUTHOR DETAILS
The study involved four major activities in estimating the current market size of metallized film. Exhaustive secondary research was done to collect information on the market, the peer market, and the parent market. The next step was to validate these findings, assumptions, and sizing with industry experts across the value chain through primary research. Both top-down and bottom-up approaches were employed to estimate the complete market size. After that, the market breakdown and data triangulation methods were used to estimate the size of the segments and subsegments of the overall market.
Secondary Research
This research report involves the use of extensive secondary sources, directories, and databases, such as Bloomberg, BusinessWeek, Factiva, ICIS, and OneSource to identify and collect information useful for the technical, market-oriented, and commercial study of the metallized film market. The secondary sources included annual reports, press releases & investor presentations of companies, white papers, certified publications, and articles from recognized authors, authenticated directories, and databases.
Primary Research
The metallized film market comprises several stakeholders, such as raw material suppliers, processors, end-product manufacturers, and regulatory organizations. The demand side of this market is characterized by the usage of resin types, such as polyurethane, epoxy, acrylic, methyl methacrylate, silicone, SMP, and other resin such as polysulfide, rubber, polyamide, and others. The supply side included industry experts, such as CEOs, vice presidents, marketing directors, technology and innovation directors, and related key executives from various companies and organizations operating in the market. Various primary sources from both the supply and demand sides of the market were interviewed to obtain qualitative and quantitative information.
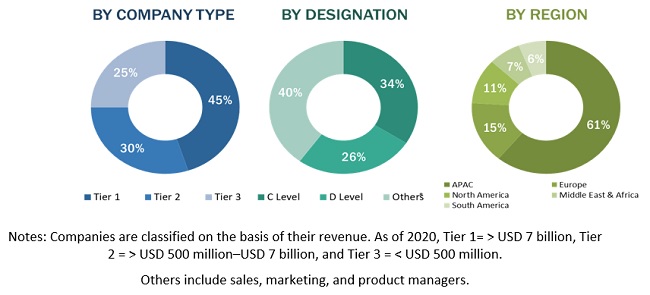
Following is the breakdown of primary respondents:
To know about the assumptions considered for the study, download the pdf brochure
Market Size Estimation
Both top-down and bottom-up approaches have been used to estimate and validate the market sizes of metallized films for various sub-markets in each region. The research methodology used to estimate the market size includes the following steps:
- The key players in the market have been identified through secondary research, and their market shares in the respective regions have been determined through primary and secondary research.
- All percentage shares, splits, and breakdowns have been determined by using secondary sources and verified through primary sources.
- All possible parameters that affect the markets covered in this research study have been accounted for, viewed in extensive detail, verified through primary research, and analyzed to get the final quantitative and qualitative data. This data has been consolidated and added to detailed inputs and analysis and presented in this report.
Bottom-Up Approach
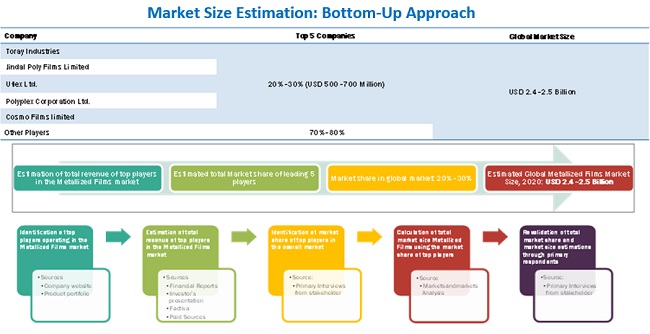
The Bottom-Up Approach Has Been Used To Arrive At The Overall Size Of The Metallized Film Market From The Revenue Of Key Players (Companies) And Their Shares In The Market. The Bottom-Up Approach Has Also Used For The Data Extracted From Secondary Research To Validate The Market Sizes Of The Segments Obtained, In Terms Of Value.
To know about the assumptions considered for the study, Request for Free Sample Report
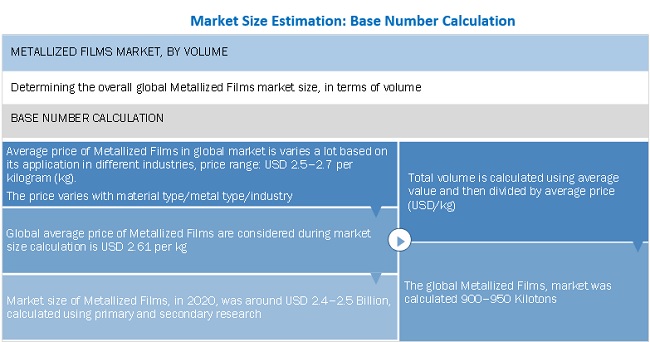
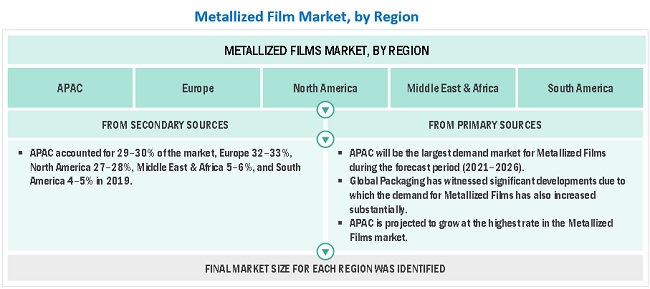
Top-Down Approach
In the top-down approach, the overall market size has been used to estimate the size of the individual market (mentioned in the market segmentation) through percentage splits from secondary and primary research. For the calculation of the size of the various market segments, the most appropriate and immediate parent market has been used to implement the top-down approach.
Data Triangulation
After arriving at the overall market size—using the estimation processes explained above—the market was split into several segments and subsegments. The data triangulation and market breakdown procedures were employed, wherever applicable, to complete the overall market engineering process and arrive at the exact statistics of each market segment and subsegment. The data was triangulated by studying various factors and trends from both the demand and supply sides.
Report Objectives
- To analyze and forecast the metallized film market, in terms of value and volume
- To provide detailed information about the key factors (drivers, restraints, opportunities, and challenges) influencing the growth of the market
- To analyze and forecast the size of the market based on resin, vehicle type, and application
- To estimate and forecast the market size based on five regions, namely, Asia Pacific (APAC), North America, Europe, the Middle East & Africa, and South America
- To estimate and forecast the metallized film market at the country-level in each of the regions
- To analyze the market opportunities and competitive landscape of the market leaders and stakeholders
- To analyze the competitive developments, such as new product launch and merger & acquisition, in the metallized film market
- To strategically identify and profile the key market players and analyze their core competencies
Available Customizations
MarketsandMarkets offers customizations according to the specific needs of the companies with the given market data.
The following customization options are available for the report:
Product Analysis
- Product matrix, which gives a detailed comparison of the product portfolio of each company
Regional Analysis
- A further breakdown of the metallized film market, by country
Company Information
- Detailed analysis and profiling of additional market players (up to five)


 Generating Response ...


Growth opportunities and latent adjacency in Metallized Film Market