We use cookies to enhance your experience. By continuing to visit this site you agree to our use of cookies . More info.
X

Marine Simulators Market

Marine Simulators Market by Solution (Products, Services), By Type (Desktop, Multi Task, Full Mission & Remote Operation), by Application (Ship Simulators, Naval, Other), By End User (Training Institutes, Commercial Ship Operators, Ship Builders and Manufacturers, Coast Guards, Search & Rescue Organisations, Navies & Special Operations Forces, Others) by Platform (Commercial, Defense, Unmanned Underwater Vehicles) and Region - Global Forecast to 2030

Report Code: UC 6222 Jun, 2025, by marketsandmarkets.com

Exhaustive secondary research was done to collect information on Marine Simulators market, its adjacent markets, and its parent market. The next step was to validate these findings, assumptions, and sizing with industry experts across the value chain through primary research. Demand-side analyses were carried out to estimate the overall size of the market. Both top-down and bottom-up approaches were employed to estimate the complete market size. Thereafter, market breakdown and data triangulation were used to estimate the size of segments and subsegments.

Secondary Research

In the secondary research process, various secondary sources, such as D&B Hoovers, Bloomberg, Business Week, and different magazines were referred to identify and collect information for this study. Secondary sources also included annual reports, press releases & investor presentations of companies, certified publications, articles by recognized authors, and research papers.

Primary Research

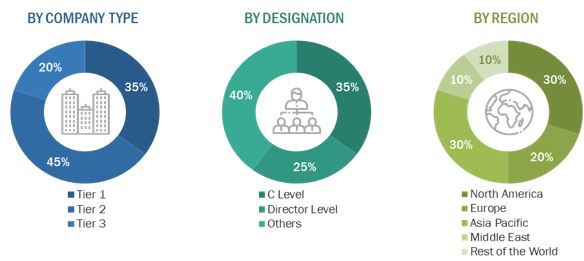
Extensive primary research was conducted after acquiring information regarding the Marine Simulators market scenario through secondary research. The market for Marine Simulators is being driven by a range of stakeholders, including boat manufacturers, infrastructure providers, and governments. The demand-side of this market is characterized by various end users, such as component manufacturers as well as facility providers and service providers. The supply side is characterized by technological advancements and the development in Marine Simulators. Various primary sources from both the supply and demand sides of the market were interviewed to obtain qualitative and quantitative information. Following is the breakdown of primary respondents.
Marine Simulators Market Size, and Share

To know about the assumptions considered for the study, download the pdf brochure

Market Size Estimation

Both the top-down and bottom-up approaches were used to estimate and validate the total size of the Marine Simulators market. These methods were also used extensively to estimate the size of various subsegments in the market. The research methodology used to estimate the market size includes the following:

  • The key players in the industry and markets were identified through extensive secondary research.
  • The industry’s supply chain and market size, in terms of value, were determined through primary and secondary research processes.
  • All percentage shares, splits, and breakdowns were determined using secondary sources and verified through primary sources.

Data Triangulation

After arriving at the overall market size from the market size estimation process, the total market has been split into several segments and subsegments. To complete the overall market engineering process and arrive at the exact statistics for market segments and subsegments, the data triangulation procedure has been implemented, wherever applicable. The data has been triangulated by studying various factors and trends from both the demand and supply sides. Along with this, the market size has been validated using both top-down and bottom-up approaches.

Report Objectives

  • To define, describe, segment, and forecast the size of the Marine Simulators market based on solution, type, application, end user, platform, and region.
  • To forecast the size of different segments of the market with respect to five key regions, namely, North America, Europe, Asia Pacific, Middle East, and Latin America, along with their key countries
  • To identify and analyze the key drivers, restraints, opportunities, and challenges influencing the growth of the market.
  • To identify technology trends currently prevailing in the Marine Simulators market
  • To analyze micro markets with respect to individual growth trends, prospects, and their contribution to the overall market
  • To analyze opportunities in the market for stakeholders by identifying the key market trends
  • To profile the leading market players and comprehensively analyze their market share and core competencies.
  • To analyze the degree of competition in the market by identifying the key growth strategies, such as acquisitions, new product launches, contracts, and partnerships, adopted by the leading market players.
  • To identify detailed financial positions, key products, and unique selling points of the leading companies in the market
  • To provide a detailed competitive landscape of the market, along with a ranking analysis, market share analysis, and revenue analysis of the key players

Want to explore hidden markets that can drive new revenue in Marine Simulators Market?

Scope of the Report

Report Metric

Details

Market size available for years

2023–2028

Base year considered

2022

Forecast period

2023-2028

Forecast units

Value (USD Million)

Segments covered

By Solution, By Platform, By Application, By Type, By End User

Geographies covered

North America, Europe, Asia Pacific, Middle East, Latin America

Companies covered

CAE Inc. (Canada), L3Harris Technologies (US), Thales Group (France), Indra Sistemas SA (Spain), Cruden (Netherlands), Force Technology (Norway), Wartsila (Finland), Kongsberg Gruppen (Norway), ImageSoft (US) are some of the major players of Marine Simulators market. (25 Companies)

Marine Simulators Market Highlights

The study categorizes the Marine Simulators market based on Propulsion, Application, Engine Position, Type, Size and Region.

Segment

Subsegment

By Solution

  • Products
  • Services

By Type

  • Desktop
  • Multi Task
  • Full Mission & Remote Operation

By Application

  • Ship Simulators
  • Naval
  • Other

By End User

  • Training Institutes
  • Commercial Ship Operators
  • Ship Builders & Manufacturers
  • Coast Guards, Search & Rescue Organizations
  • Navies & Special Operations Forces
  • Others

By Platform

  • Commercial
  • Defense
  • Unmanned Underwater Vehicles

By Region

  • North America
  • Europe
  • Asia Pacific
  • Middle East
  • Latin America

Available Customizations

MarketsandMarkets offers the following customizations for this market report:

Company Information

  • Profiling of additional market players (up to 5)

Product Analysis

  • Product matrix, which provides a detailed comparison of the product portfolio of each company in the Marine Simulators Market.

Exclusive indicates content/data unique to MarketsandMarkets and not available with any competitors.

TABLE OF CONTENTS
 
1 INTRODUCTION 
    1.1 OBJECTIVES OF THE STUDY 
    1.2 DEFINITION 
    1.3 MARKET SCOPE 
           1.3.1 MARKETS COVERED
           1.3.2 REGIONAL SCOPE
           1.3.3 YEARS CONSIDERED FOR THE STUDY
    1.4 CURRENCY 
    1.5 LIMITATIONS 
    1.6 MARKET STAKEHOLDERS 
 
2 RESEARCH METHODOLOGY 
    2.1 RESEARCH DATA 
           2.1.1 SECONDARY DATA
                    2.1.1.1 KEY DATA FROM SECONDARY SOURCES
           2.1.2 PRIMARY DATA
                    2.1.2.1 KEY DATA FROM PRIMARY SOURCES
           2.1.3 MARKET DEFINITION & SCOPE
                    2.1.3.1 INCLUSION
                    2.1.3.2 EXCLUSION
           2.1.4 SEGMENT DEFINITIONS
                    2.1.4.1 SOLUTION
                    2.1.4.2 END-USER
                    2.1.4.3 TYPE
                    2.1.4.4 APPLICATION
    2.2 RESEARCH APPROACH & METHODOLOGY 
           2.2.1 BOTTOM-UP APPROACH
           2.2.2 PRODUCTS
           2.2.3 SERVICES
           2.2.4 TOP-DOWN APPROACH
           2.2.5 PRICING ANALYSIS
    2.3 TRIANGULATION & VALIDATION 
    2.4 RESEARCH ASSUMPTIONS 
           2.4.1 MARKET SIZING
           2.4.2 MARKET FORECAST
    2.5 RISKS 
           2.5.1 LIMITATIONS/GREY AREAS
 
3 EXECUTIVE SUMMARY 
 
4 PREMIUM INSIGHTS 
    4.1 ATTRACTIVE OPPORTUNITIES IN MARITIME SIMULATORS MARKET 
    4.2 MARITIME SIMULATORS MARKET, BY SOLUTION 
    4.2 MARITIME SIMULATORS MARKET, BY TYPE 
    4.2 MARITIME SIMULATORS MARKET, BY APPLICATION 
    4.2 MARITIME SIMULATORS MARKET, BY END-USER 
    4.2 MARITIME SIMULATORS MARKET, BY PLATFORM 
    4.3 MARITIME SIMULATORS MARKET, BY REGION 
 
5 MARKET OVERVIEW 
    5.1 INTRODUCTION 
    5.2 MARKET DYNAMICS 
           5.2.1 DRIVERS
           5.2.2 RESTRAINTS
           5.2.3 OPPORTUNITIES
           5.2.4 CHALLENGES
    5.3 AVERAGE SELLING PRICE TREND 
           5.3.1 AVERAGE SELLING PRICES TREND OF KEY PLAYERS 
           5.3.2 AVERAGE SELLING PRICE TREND BY TYPE
    5.4 VALUE CHAIN ANALYSIS 
    5.5 MARKET ECOSYSTEM MAP 
           5.5.1 PROMINENT COMPANIES 
           5.5.2 PRIVATE AND SMALL ENTERPRISES 
           5.5.3 END USERS 
    5.6 DISRUPTION IMPACTING MARITIME SIMULATORS’ CUSTOMERS’ BUSINESS 
           5.5.1 REVENUE SHIIFT & NEW REVENUE POCKETS FOR MARITIME SIMULATORS
    5.7 PORTERS FIVE FORCES 
    5.8 TRADE ANALYSIS 
    5.9 REGULATORY LANDSCAPE 
           5.9.1 REGULATORY BODIES, GOVERNMENT AGENCIES, AND OTHER ORGANIZATIONS 
    5.11 CASE STUDY ANALYSIS 
    5.12 TOTAL COST OF OWNERSHIP 
    5.13 OPERATIONAL DATA 
    5.14 BUSINESS MODEL 
    5.15 BILL OF MATERIAL 
    5.16 INVESTMENT AND FUNDING SCENARIO 
    5.17 KEY CONFERENCES & EVENTS IN 2025-2026 
    5.18 IMPACT OF AI/GEN AI 
 
6 INDUSTRY TRENDS 
    6.1 INTRODUCTION 
    6.2 TECHNOLOGY TRENDS  
    6.3 TECHNOLOGY ANALYSIS 
           6.3.1 KEY TECHNOLOGY
           6.3.2 COMPLIMENTARY TECHNOLOGY
    6.4 IMPACT OF MEGATRENDS 
    6.5 PATENT ANALYSIS 
    6.6 SUPPLY CHAIN ANALYSIS 
    6.7 TECHNOLOGY ROADMAP FOR MARITIME SIMULATORS MARKET 
 
7 MARITIME SIMULATORS MARKET, BY SOLUTION 
    7.1 PRODUCTS 
           7.1.1 HARDWARE
           7.1.2 SOFTWARE
    7.2 SERVICES 
           7.2.1 UPGRADES (HARDWARE & SOFTWARE)
           7.2.2 MAINTENANCE
           7.2.3 SUPPORT & INSTALLATION
           7.2.4 TRAINING
 
8 MARITIME SIMULATORS MARKET, BY TYPE 
    8.1 DESKTOP 
    8.2 MULTI-TASK 
    8.3 FULL MISSION & REMOTE OPERATION 
 
9 MARITIME SIMULATORS MARKET, BY SIMULATION 
    9.1 SHIP OPERATION 
           9.1.1 SHIP BRIDGE & NAVIGATION 
           9.1.2 FISHING 
           9.1.3 GMDSS
           9.1.4 ICE NAVIGATION 
           9.1.5 DYNAMIC POSITIONING 
           9.1.6 SMALL CRAFT 
           9.1.7 SURVIVAL CRAFT 
           9.1.8 TUG, MOORING & INLAND 
           9.1.9 REMOTE OPERATION
           9.1.10 TOWAGE 
           9.1.11 STEERING 
           9.1.12 ENGINE ROOM 
           9.1.13 SAFETY MANAGEMENT
           9.3.14 CARGO HANDLING & OTHERS
    9.2 NAVAL TRAINING 
           9.2.1 SONAR AND ANTI-SUBMARINE WARFARE (ASW) TRAINER
           9.2.2 SUBMARINE TRAINING
           9.2.3 ACTION SPEED TACTICAL TRAINER
           9.2.4 SURFACE WARSHIP COMMAND TACTICAL TRAINER (CTT)
           9.2.5 NAVAL WEAPON TRAINER (NWT)
           9.2.6 PERISCOPE TRAINER & OTHER
    9.3 OTHER  
           9.3.1 VESSEL TRAFFIC SERVICE 
           9.3.2 SHIP PROTECTION TRAINING 
           9.3.3 PORT OPERATION
           9.3.4 OIL SPILL RESPONSE 
           9.3.5 SHIPYARD  OPERATION
 
10 MARITIME SIMULATORS MARKET, BY END-USER 
     10.1 INTRODUCTION 
     10.2 TRAINING INSTITUTES  
     10.3 COMMERCIAL SHIP OPERATORS 
     10.4 SHIPBUILDERS AND MANUFACTURERS 
     10.5 COAST GUARDS, SEARCH AND RESCUE ORGANISATIONS 
     10.6 NAVIES & SPECIAL OPERATION FORCES 
     10.7 OTHERS  
 
11 MARITIME SIMULATORS MARKET, BY APPLICATION 
     11.1 INTRODUCTION 
     11.2 MILITARY 
             11.2.1 SURFACE VESSELS
             11.2.2 SUBMARINE
     11.3 COMMERCIAL  
             11.3.1 PASSENGER VESSELS
             11.3.2 CARGO VESSELS
             11.3.3 OTHER PLATFORMS
                        11.3.3.1 SPECIALIZED VESSELS 
                        11.3.3.2 OFFSHORE VESSELS 
                        11.3.3.3 RESEARCH VESSELS 
     11.4 UNMANNED MARITIME VESSELS 
             11.4.1 UNMANNED SURFACE VESSELS 
             11.4.2 REMOTELY OPERATED VESSELS  
             11.4.3 AUTONOMOUS UNDERWATER VESSELS  
 
12 MARITIME SIMULATORS MARKET, BY REGION 
     12.1 INTRODUCTION 
     12.2 NORTH AMERICA 
             12.2.1 PESTLE ANALYSIS
             12.2.2 US
             12.2.3 CANADA
     12.3 EUROPE 
             12.3.1 PESTLE ANALYSIS
             12.3.2 FRANCE
             12.3.3 GERMANY
             12.3.4 UK
             12.3.5 ITALY
             12.3.6 SPAIN
             12.3.7 REST OF EUROPE
     12.4 ASIA PACIFIC 
             12.4.1 PESTLE ANALYSIS
             12.4.2 SOUTH KOREA
             12.4.3 JAPAN
             12.4.4 CHINA
             12.4.5 INDIA
             12.4.6 AUSTRALIA
             12.4.8 REST OF ASIA PACIFIC
     12.5 MIDDLE EAST 
             12.5.1 PESTLE ANALYSIS
             12.5.2 GCC COUNTRIES
                        12.5.2.1    UAE 
                        12.5.2.2    SAUDI ARABIA 
             12.5.3 ISRAEL
     12.6 SOUTH AMERICA 
             12.6.1 PESTLE ANALYSIS
             12.6.2 BRAZIL
             12.6.3 MEXICO
             12.6.4 REST OF SOUTH AMERICA
     12.7 AFRICA 
             12.7.1 PESTLE ANALYSIS
             12.7.2 SOUTH AFRICA
             12.7.3 REST OF AFRICA
 
13 COMPETITIVE LANDSCAPES 
     13.1 KEY PLAYER STRATEGIES/RIGHT TO WIN 
             13.1.1 KEY STRATEGIES ADOPTED BY LEADING PLAYERS IN MARITIME SIMULATORS MARKET, 2023
     13.2 MARKET SHARE ANALYSIS OF LEADING PLAYERS, 2023 
     13.3 REVENUE ANALYSIS OF TOP 5 MARKET PLAYERS, 2020-2023 
     13.4 COMPANY EVALUATION MATRIX: KEY PLAYERS, 2023 
             13.4.1  STARS
             13.4.2  EMERGING LEADERS
             13.4.3  PERVASIVE PLAYERS
             13.4.4  PARTICIPANTS
             13.4.5 COMPANY FOOTPRINT: KEY PLAYERS, 2023
                        13.4.5.1 Company Footprint  
                        13.5.5.2 Region Footprint 
                        13.4.5.3 Type Footprint  
                        13.4.5.4 Payload Footprint 
                        13.4.5.5 Range Footprint 
     13.5 COMPANY VALUATION AND FINANCIAL MATRICES 
     13.6 COMPANY EVALUATION MATRIX: START-UPS/SME, 2023  
             13.6.1 PROGRESSIVE COMPANIES
             13.6.2 RESPONSIVE COMPANIES
             13.6.3 DYNAMIC COMPANIES 
             13.6.4 STARTING BLOCKS
             13.6.5 COMPETITIVE BENCHMARKING: STARTUPS/SMES, 2023
                        13.6.5.1 Detailed List of Startups/SMEs 
                        13.6.5.2 Competitive Benchmarking of Startups/SMEs 
     13.7 BRAND/PRODUCT COMPARISON 
     13.8 COMPETITIVE SCENARIO & TRENDS 
             13.8.1 MARKET EVALUATION FRAMEWORK
             13.8.2 RECENT DEVELOPMENTS 
                        13.8.2.1   New Product Launches 
                        13.8.2.2   Deals  
                        13.8.2.3   Others 
 
14 COMPANY PROFILES 
     (Business Overview, Products Offered, Recent Developments, SWOT Analysis, MnM View)*  
     14.1 CAE INC. 
     14.2 L3HARRIS TECHNOLOGIES, INC. 
     14.3 THALES GROUP 
     14.4 INDRA SISTEMAS SA 
     14.5 CRUDEN  
     14.6 FORCE TECHNOLOGY 
     14.7 WARTSILA 
     14.8 KONGSBERG 
     14.9 IMAGESOFT 
     14.10 MITSUI O.S.K. LINES
     14.11 RAYTHEON COMPANY 
     14.12 NAUTICAL SIMULATION 
     14.13 E-TECH SIMULATION 
     14.14 PC MARITIME 
     14.15 VSTEP BV 
     14.16 ARI SIMULATION 
*Details on Business Overview, Products Offered, Recent Developments, SWOT Analysis, and MnM View might not be captured in the case of unlisted companies.  
Note: The given list of companies is tentative and will be extended to 25 during the course of the study
 
15 APPENDIX 
     15.1 DISCUSSION GUIDE 
     15.2 KNOWLEDGE STORE: MARKETSANDMARKETS’ SUBSCRIPTION PORTAL 
     15.3 AVAILABLE CUSTOMIZATION 
     15.4 RELATED REPORTS 
     15.5 AUTHOR DETAILS 


Request for detailed methodology, assumptions & how numbers were triangulated.

Please share your problem/objectives in greater details so that our analyst can verify if they can solve your problem(s).
5 7 5 5 8  
Custom Market Research Services

We will customize the research for you, in case the report listed above does not meet with your exact requirements. Our custom research will comprehensively cover the business information you require to help you arrive at strategic and profitable business decisions.

Request Customization
Report Code
UC 6222
Available for Pre-Book
Choose License Type
Prebook Now
  • SHARE
X
Request Customization
Speak to Analyst
Speak to Analyst
OR FACE-TO-FACE MEETING
PERSONALIZE THIS RESEARCH
  • Triangulate with your Own Data
  • Get Data as per your Format and Definition
  • Gain a Deeper Dive on a Specific Application, Geography, Customer or Competitor
  • Any level of Personalization
REQUEST A FREE CUSTOMIZATION
LET US HELP YOU!
  • What are the Known and Unknown Adjacencies Impacting the Marine Simulators Market
  • What will your New Revenue Sources be?
  • Who will be your Top Customer; what will make them switch?
  • Defend your Market Share or Win Competitors
  • Get a Scorecard for Target Partners
CUSTOMIZED WORKSHOP REQUEST
knowledgestore logo

Want to explore hidden markets that can drive new revenue in Marine Simulators Market?

Find Hidden Markets
  • Call Us
  • +1-888-600-6441 (Corporate office hours)
  • +1-888-600-6441 (US/Can toll free)
  • +44-800-368-9399 (UK office hours)
CONNECT WITH US
ABOUT TRUST ONLINE
©2025 MarketsandMarkets Research Private Ltd. All rights reserved
DMCA.com Protection Status
Website Feedback