Itaconic Acid Market by Derivative (Styrene Butadiene, Methyl Methacrylate, Polyitaconic Acid), Application (SBR Latex, Synthetic Latex, Chillant Dispersant Agent, Superabsorbent Polymer), and Region - Global Forecast to 2022


Itaconic Acid Market Size And Forecast
[104 Pages Report] itaconic acid market is projected to grow from USD 80.8 Million in 2016 to USD 102.3 Million by 2022, at a CAGR of 4.1% from 2017 to 2022. Itaconic acid is increasingly being used in the SBR latex application, as it offers improved bond & tensile strength, good adhesion, resistance to moisture, etc. In this study, years that have been considered to estimate the size of the itaconic acid market are as follows:
- Base Year – 2016
- Estimated Year – 2017
- Projected Year – 2022
- Forecast Period – 2017 to 2022
2016 has been considered as the base year for company profiles. In cases, wherein information was unavailable for the base year, the year to it has been considered.
Objectives of the Study
- To define, describe, and forecast the size of the itaconic acid market in terms of value
- To define, describe, and forecast the itaconic acid market based on derivative and application
- To analyze and forecast the size of the itaconic acid market in North America, Europe, Asia Pacific, Latin America, and the Middle East & Africa (ME&A), along with their respective key countries
- To provide detailed information regarding major factors, such as drivers, restraints, opportunities, and industry-specific challenges influencing the growth of the itaconic acid market
- To strategically profile and analyze key market players and their core competencies
- To analyze recent developments such as agreements, acquisitions, and expansions in the itaconic acid market
Various secondary sources such as company websites, encyclopedias, directories, and databases, such as Bloomberg, Factiva, and Polymer Database, have been used to understand and gain insights into the itaconic acid market. Experts from top companies in the market have been interviewed to verify and collect critical information and assess trends in the itaconic acid market during the forecast period. Top-down, bottom-up, and data triangulation approaches have been implemented to calculate the exact values of the sizes of the overall parent and individual markets.
To know about the assumptions considered for the study, download the pdf brochure
The itaconic acid market has a diversified ecosystem, which includes downstream stakeholders, such as manufacturers, vendors, and end users of itaconic acid as well as various government organizations. The value chain of the itaconic acid market includes manufacturers, such as Itaconix Corporation (UK), Alpha Chemika (India), Qingdao Langyatai (China), etc. Manufacturers of itaconic acid supply their products to various end-use industries, such as paper coating, paper processing, skin care, detergent, medical equipment, etc.
This study focuses on top investment pockets to help stakeholders understand and analyze emerging trends in the itaconic acid market. These stakeholders include:
- Manufacturers of Itaconic Acid
- Raw Material Suppliers
- Distributors and Suppliers of Itaconic Acid
- End-use Industries
- Industry Associations
- R&D Institutions
Scope of the Report:
This research report categorizes the itaconic acid market based on derivative, application, and region. It forecasts revenue growth and analyzes trends in each of the sub-markets till 2022.
Itaconic Acid Market, By Derivative
- Styrene Butadiene Itaconic Acid
- Methyl Methacrylate
- Polyitaconic Acid
- Others
Itaconic Acid Market, by Application
- SBR Latex
- Synthetic Latex
- Chillant Dispersant Agent
- Superabsorbent Polymers
- Others
Itaconic Acid Market, by Region
- North America
- Europe
- Asia Pacific
- Middle East & Africa
- Latin America
Available Customizations
With the given market data, MarketsandMarkets offers customizations according to the specific needs of the companies. The following customization options are available for the report:
Regional Analysis
- Further breakdown of the North America itaconic acid market
- Further breakdown of the Europe itaconic acid market
- Further breakdown of the Asia Pacific itaconic acid market
- Further breakdown of the Middle East & Africa itaconic acid market
- Further breakdown of the Latin America itaconic acid market
Company Information
- Detailed analysis and profiles of additional market players
The itaconic acid market is projected to grow from USD 83.8 Million in 2017 to USD 102.3 Million by 2022, at a CAGR of 4.1% from 2017 to 2022. The increasing demand for bio-based unsaturated polyester resin and its non-toxic properties are fueling the growth of the itaconic acid market across the globe.
The itaconic acid market has been segmented based on derivative into styrene butadiene itaconic acid, methyl methacrylate, polyitaconic acid, and others. Styrene butadiene itaconic acid offers an excellent bond, improved tensile strength, frothing machinability & binder strength, and possesses and flexural and anti-oxidation properties. This results in smoothness, glossy finish, and reduction in the use of expensive coating color additives, making them useful in various applications such as paper processing, paper coating, carpet backing, and non-woven applications. These are some of the factors that are expected to drive the demand for itaconic acid between 2017 and 2022.
Based on application, the itaconic acid market has been segmented into SBR latex, synthetic latex, chillant dispersant agents, superabsorbent polymers, and others. The superabsorbent polymers application segment of the itaconic acid market is projected to grow at the highest CAGR during the forecast period. Itaconic acid-based superabsorbent polymers are used in detergents and skin care, cosmetics, personal care, and hygiene care industries. Various properties of itaconic acid are expected to increase its use in these applications, thus increasing its demand between 2017 and 2022.
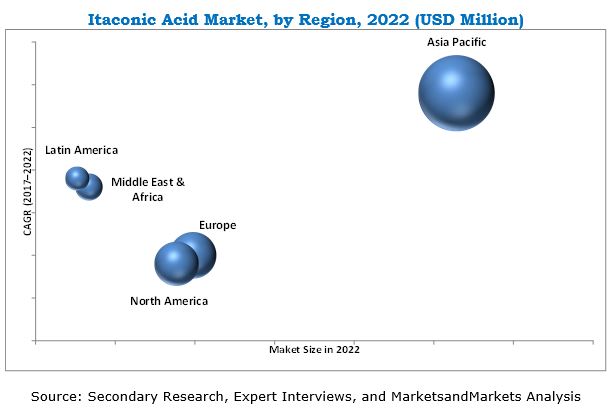
The Asia Pacific itaconic acid market is projected to grow at the highest CAGR from 2017 to 2022. The growth of the Asia Pacific itaconic acid market can be attributed to the increasing demand for itaconic acid from countries such China, India, South Korea, Thailand, and Indonesia, among others, for use in various applications. Moreover, increasing FDI in various industries in these economies is also contributing to the growth of the Asia Pacific itaconic acid market.
Itaconix Corporation (UK), Qingdao Langyatai (China), Zhejiang Guoguang (China), Alpha Chemika (India), Shandong Kaison (China), Jinan Huaming (China), Iwata Chemical (Japan), Aekyung Petrochemical (South Korea), Ronas Chemical (China), and Chengdu Jinkai (China) are some of the leading players operating in the itaconic acid market. These players have been adopting various organic and inorganic growth strategies such as agreements, acquisitions, joint ventures, and expansions to enhance their market shares in the itaconic acid market.
To speak to our analyst for a discussion on the above findings, click Speak to Analyst
 Exclusive indicates content/data unique to MarketsandMarkets and not available with any competitors.
Table of Contents
1 Introduction (Page No. - 11)
1.1 Objectives of the Study
1.2 Market Definition
1.3 Market Scope
1.4 Currency
1.5 Units Considered
1.6 Limitations
1.7 Stakeholders
2 Research Methodology (Page No. - 15)
2.1 Research Data
2.1.1 Secondary Data
2.1.1.1 Key Data From Secondary Sources
2.1.2 Primary Data
2.1.2.1 Key Data From Primary Sources
2.1.2.2 Key Industry Insights
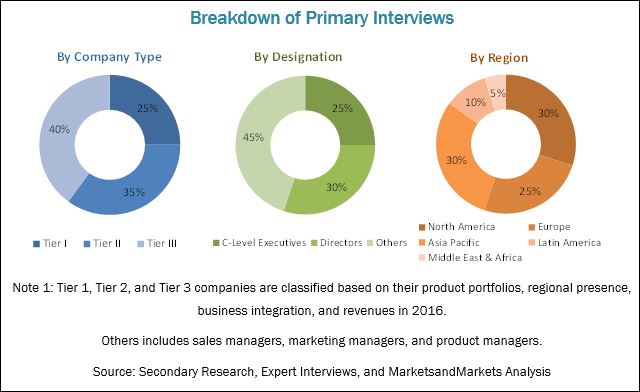
2.1.2.3 Breakdown of Primary Interviews
2.2 Market Size Estimation
2.2.1 Bottom-Up Approach
2.2.2 Top-Down Approach
2.3 Data Triangulation
2.4 Assumptions
3 Executive Summary (Page No. - 23)
4 Premium Insights (Page No. - 26)
4.1 Attractive Opportunities in the IA Market
4.2 IA Market, By Derivative
4.3 IA Market, By Application and Region
4.4 IA Market, By Country
5 Market Overview (Page No. - 28)
5.1 Introduction
5.2 Market Dynamics
5.2.1 Drivers
5.2.1.1 Increasing Demand for Bio-Based Unsaturated Polyester Resin
5.2.1.2 Environment-Friendly and Non-Toxic Properties
5.2.2 Restraints
5.2.2.1 Availability of Low-Cost Substitutes
5.2.3 Opportunities
5.2.3.1 Technological Advancements in Bio-Based Pmma
5.2.4 Challenges
5.2.4.1 Developing Low-Cost Production Technologies
5.3 Porter’s Five Forces Analysis
5.3.1 Threat of New Entrants
5.3.2 Threat of Substitutes
5.3.3 Bargaining Power of Buyers
5.3.4 Bargaining Power of Suppliers
5.3.5 Intensity of Competitive Rivalry
6 Macroeconomic Overview and Key Trends (Page No. - 33)
6.1 Introduction
6.2 Trends and Forecast of GDP
7 IA Market, By Derivative (Page No. - 35)
7.1 Introduction
7.2 Styrene Butadiene Itaconic Acid
7.3 Methyl Methacrylate
7.4 Polyitaconic Acid
7.5 Others
8 IA Market, By Application (Page No. - 42)
8.1 Introduction
8.2 SBR Latex
8.3 Synthetic Latex
8.4 Chillant Dispersant Agent
8.5 Superabsorbent Polymer
8.6 Others
9 IA Market, By Region (Page No. - 51)
9.1 Introduction
9.2 North America
9.2.1 By Application
9.2.2 By Derivative
9.2.3 By Country
9.2.3.1 US
9.2.3.2 Canada
9.3 Europe
9.3.1 By Application
9.3.2 By Derivative
9.3.3 By Country
9.3.3.1 Germany
9.3.3.2 France
9.3.3.3 UK
9.3.3.4 Switzerland
9.3.3.5 Italy
9.3.3.6 Russia
9.4 APAC
9.4.1 By Application
9.4.2 By Derivative
9.4.3 By Country
9.4.3.1 China
9.4.3.2 Japan
9.4.3.3 India
9.4.3.4 South Korea
9.4.3.5 Malaysia
9.5 Middle East & Africa
9.5.1 By Application
9.5.2 By Derivative
9.5.3 By Country
9.5.3.1 Saudi Arabia
9.5.3.2 UAE
9.5.3.3 Qatar
9.5.3.4 Israel
9.6 Latin America
9.6.1 By Application
9.6.2 By Derivative
9.6.3 By Country
9.6.3.1 Brazil
9.6.3.2 Mexico
9.6.3.3 Argentina
10 Competitive Landscape (Page No. - 80)
10.1 Overview
10.2 Market Ranking
10.3 Competitive Scenario
10.3.1 Agreement
10.3.2 Acquisition
10.4 Patent Analysis
11 Company Profiles (Page No. - 84)
Business Overview, Products Offered, Recent Developments, SWOT Analysis, MnM View
11.1 Itaconix Corporation
11.2 Qingdao Langyatai Group Co., Ltd.
11.3 Zhejiang Guoguang Biochemistry Co., Ltd.
11.4 Jinan Huaming Biochemistry Co. Ltd.
11.5 Iwata Chemical Co., Ltd.
11.6 Alpha Chemika
11.7 Shandong Kaison Biochemical Co., Ltd.
11.8 Aekyung Petrochemical Co. Ltd.
11.9 Chengdu Jinkai Biology Engineering Co., Ltd.
11.10 Ronas Chemicals Ind. Co., Ltd.
11.11 Other Key Players
11.11.1 Shandong Shunda
11.11.2 Citrus Food Additives Co., Ltd
11.11.3 Shandong Zhongshun Science & Technology Development Co., Ltd.
11.11.4 Nanjing Huajin Healthcare Biologicals Co. Ltd.
11.11.5 Ultimate Chem India Pvt. Ltd.
*Details Might Not Be Captured in Case of Unlisted Companies.
12 Appendix (Page No. - 97)
12.1 Discussion Guide
12.2 Knowledge Store: Marketsandmarkets’ Subscription Portal
12.3 Introducing RT: Real-Time Market Intelligence
12.4 Available Customizations
12.5 Related Reports
12.6 Author Details
List of Tables (82 Tables)
Table 1 Trends and Forecast of GDP, 2016–2022 (USD Billion)
Table 2 IA Market Size, By Derivative, 2015–2022 (Kiloton)
Table 3 Itaconic Acid Market Size, By Derivative, 2015–2022 (USD Million)
Table 4 IA Market Size in SBIA, By Region, 2015–2022 (Kiloton)
Table 5 Itaconic Acid Market Size in SBIA, By Region, 2015–2022 (USD Million)
Table 6 IA Market Size in MMA, By Region, 2015–2022 (Kiloton)
Table 7 Itaconic Acid Market Size in MMA, By Region, 2015–2022 (USD Million)
Table 8 IA Market Size in PIA, By Region, 2015–2022 (Kiloton)
Table 9 IA Market Size in PIA, By Region, 2015–2022 (USD Million)
Table 10 Itaconic Acid Market Size in Other Derivatives, By Region, 2015–2022 (Kiloton)
Table 11 IA Market Size in Other Derivatives, By Region, 2015–2022 (USD Million)
Table 12 Itaconic Acid Market Size, By Application, 2015–2022 (Kiloton)
Table 13 IA Market Size, By Application, 2015–2022 (USD Million)
Table 14 Itaconic Acid Market Size in SBR Latex, By Region, 2015–2022 (Kiloton)
Table 15 IA Market Size in SBR Latex, By Region, 2015–2022 (USD Million)
Table 16 IA Market Size in Synthetic Latex, By Region, 2015–2022 (Kiloton)
Table 17 Itaconic Acid Market Size in Synthetic Latex, By Region, 2015–2022 (USD Million)
Table 18 IA Market Size in CDA, By Region, 2015–2022 (Kiloton)
Table 19 Itaconic Acid Market Size in CDA, By Region, 2015–2022 (USD Million)
Table 20 IA Market Size in SAP, By Region, 2015–2022 (Kiloton)
Table 21 Itaconic Acid Market Size in SAP, By Region, 2015–2022 (USD Million)
Table 22 IA Market Size in Other Applications, By Region, 2015–2022 (Kiloton)
Table 23 Itaconic Acid Market Size in Other Applications, By Region, 2015–2022 (USD Million)
Table 24 IA Market Size, By Region, 2015–2022 (Kiloton)
Table 25 Itaconic Acid Market Size, By Region, 2015–2022 (USD Million)
Table 26 North America: Itaconic Acid Market Size, By Application, 2015–2022 (Kiloton)
Table 27 North America: IA Market Size, By Application, 2015–2022 (USD Million)
Table 28 North America: Market Size, By Derivative, 2015–2022 (Kiloton)
Table 29 North America: Market Size, By Derivative, 2015–2022 (USD Million)
Table 30 North America: Market Size, By Country, 2015–2022 (Kiloton)
Table 31 North America: Market Size, By Country, 2015–2022 (USD Million)
Table 32 US: Itaconic Acid Market Size, By Application, 2015–2022 (Kiloton)
Table 33 US: IA Market Size, By Application, 2015–2022 (USD Million)
Table 34 Canada: Itaconic Acid Market Size, By Application, 2015–2022 (Kiloton)
Table 35 Canada: IA Market Size, By Application, 2015–2022 (USD Million)
Table 36 Europe: Itaconic Acid Market Size, By Application, 2015–2022 (Kiloton)
Table 37 Europe: Market Size, By Application, 2015–2022 (USD Million)
Table 38 Europe: Market Size, By Derivative, 2015–2022 (Kiloton)
Table 39 Europe: Market Size, By Derivative, 2015–2022 (USD Million)
Table 40 Europe: Market Size, By Country, 2015–2022 (Kiloton)
Table 41 Europe: Market Size, By Country, 2015–2022 (USD Million)
Table 42 Germany: Itaconic Acid Market Size, By Application, 2015–2022 (Kiloton)
Table 43 Germany: IA Market Size, By Application, 2015–2022 (USD Million)
Table 44 France: Itaconic Acid Market Size, By Application, 2015–2022 (Kiloton)
Table 45 France: IA Market Size, By Application, 2015–2022 (USD Million)
Table 46 UK: Itaconic Acid Market Size, By Application, 2015–2022 (Kiloton)
Table 47 UK: IA Market Size, By Application, 2015–2022 (USD Million)
Table 48 APAC: Itaconic Acid Market Size, By Application, 2015–2022 (Kiloton)
Table 49 APAC: IA Market Size, By Application, 2015–2022 (USD Million)
Table 50 APAC: Market Size, By Derivative, 2015–2022 (Kiloton)
Table 51 APAC: Market Size, By Derivative, 2015–2022 (USD Million)
Table 52 APAC: Market Size, By Country, 2015–2022 (Kiloton)
Table 53 APAC: Market Size, By Country, 2015–2022 (USD Million)
Table 54 China: Itaconic Acid Market Size, By Application, 2015–2022 (Kiloton)
Table 55 China: IA Market Size, By Application, 2015–2022 (USD Million)
Table 56 Japan: Itaconic Acid Market Size, By Application, 2015–2022 (Kiloton)
Table 57 Japan: IA Market Size, By Application, 2015–2022 (USD Million)
Table 58 India: Itaconic Acid Market Size, By Application, 2015–2022 (Kiloton)
Table 59 India: IA Market Size, By Application, 2015–2022 (USD Million)
Table 60 Middle East & Africa: Itaconic Acid Market Size, By Application, 2015–2022 (Kiloton)
Table 61 Middle East & Africa: IA Market Size, By Application, 2015–2022 (USD Million)
Table 62 Middle East & Africa: Market Size, By Derivative, 2015–2022 (Kiloton)
Table 63 Middle East & Africa: Market Size, By Derivative, 2015–2022 (USD Million)
Table 64 Middle East & Africa: Market Size, By Country, 2015–2022 (Kiloton)
Table 65 Middle East & Africa: Market Size, By Country, 2015–2022 (USD Million)
Table 66 Saudi Arabia: Itaconic Acid Market Size, By Application, 2015–2022 (Kiloton)
Table 67 Saudi Arabia: IA Market Size, By Application, 2015–2022 (USD Million)
Table 68 UAE: Itaconic Acid Market Size, By Application, 2015–2022 (Kiloton)
Table 69 UAE: IA Market Size, By Application, 2015–2022 (USD Million)
Table 70 Latin America: Itaconic Acid Market Size, By Application, 2015–2022 (Kiloton)
Table 71 Latin America: IA Market Size, By Application, 2015–2022 (USD Million)
Table 72 Latin America: Market Size, By Derivative, 2015–2022 (Kiloton)
Table 73 Latin America: Market Size, By Derivative, 2015–2022 (USD Million)
Table 74 Latin America: Market Size, By Country, 2015–2022 (Kiloton)
Table 75 Latin America: Market Size, By Country, 2015–2022 (USD Million)
Table 76 Brazil: Itaconic Acid Market Size, By Application, 2015–2022 (Kiloton)
Table 77 Brazil: IA Market Size, By Application, 2015–2022 (USD Million)
Table 78 Mexico: Itaconic Acid Market Size, By Application, 2015–2022 (Kiloton)
Table 79 Mexico: IA Market Size, By Application, 2015–2022 (USD Million)
Table 80 Ranking of Key Market Players
Table 81 Agreement, 2011–2017
Table 82 Acquisition, 2011–2017
List of Figures (37 Figures)
Figure 1 Itaconic Acid Market Segmentation
Figure 2 Years Considered for the Study
Figure 3 IA Market: Research Design
Figure 4 Market Size Estimation: Bottom-Up Approach
Figure 5 Market Size Estimation: Top-Down Approach
Figure 6 IA Market: Data Triangulation
Figure 7 SBIA to Lead the IA Market Between 2017 and 2022
Figure 8 SBR Latex Segment to Register the Highest CAGR Between 2017 and 2022
Figure 9 APAC Led the IA Market in 2016
Figure 10 Growth Opportunities in the IA Market Between 2017 and 2022
Figure 11 SBR Latex to Lead the IA Market Between 2017 and 2022
Figure 12 APAC Led the Itaconic Acid Market in 2016
Figure 13 China to Register the Highest CAGR Between 2017 and 2022
Figure 14 Overview of Factors Governing the IA Market
Figure 15 Porter’s Five Forces Analysis of the IA Market
Figure 16 Relative GDP Growth Scenario of Key Economies
Figure 17 SBIA to Lead the IA Market Between 2017 and 2022
Figure 18 APAC to Lead the IA Market in SBIA Between 2017 and 2022
Figure 19 APAC to Lead the IA Market in MMA Between 2017 and 2022
Figure 20 APAC to Lead the IA Market in PIA Between 2017 and 2022
Figure 21 SBR Latex Application to Lead the IA Market Between 2017 and 2022
Figure 22 APAC IA Market in the SBR Latex Application to Account for the Largest Share Between 2017 and 2022
Figure 23 APAC to Lead the IA Market in the Synthetic Latex Application Between 2017 and 2022
Figure 24 APAC to Lead the IA Market in the CDA Application Between 2017 and 2022
Figure 25 APAC to Lead the IA Market in the SAP Application Between 2017 and 2022
Figure 26 China to Register the Highest CAGR Between 2017 and 2022
Figure 27 North America IA Market Snapshot
Figure 28 Europe Itaconic Acid Market Snapshot
Figure 29 APAC IA Market Snapshot
Figure 30 Saudi Arabia is the Most Lucrative IA Market
Figure 31 Brazil is the Most Lucrative IA Market
Figure 32 Companies Majorly Adopted Inorganic Growth Strategies Between 2011 and 2017
Figure 33 APAC has Recorded the Highest Patents Filed Between 2011 and 2018
Figure 34 Highest Number of Patents Recorded in 2015
Figure 35 Itaconix Corporation: Company Snapshot
Figure 36 Itaconix Corporation: SWOT Analysis
Figure 37 Aekyung Petrochemical Co. Ltd.: Company Snapshot


Growth opportunities and latent adjacency in Itaconic Acid Market