Intraoral/ IOL Scanners Market by Modality (Portable, standalone), Application (Prosthodontics, Orthodontics, Restorative), End-user (Laboratories, DSO, Hospitals, Dental Clinics, Research Institutes, and Forensic Labs) - Global Forecast to 2028
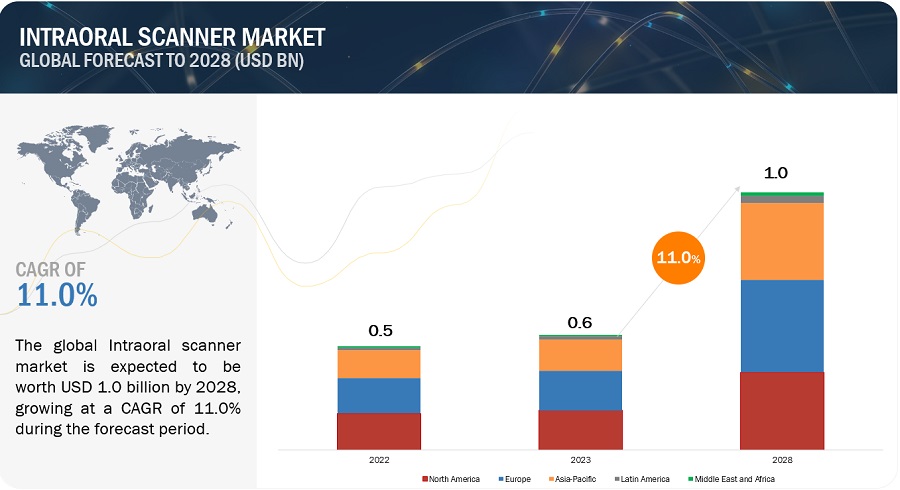
The global intraoral scanners market, valued at US$0.5 billion in 2022, stood at US$0.6 billion in 2023 and is projected to advance at a resilient CAGR of 11.0% from 2023 to 2028, culminating in a forecasted valuation of US$1.0 billion by the end of the period. The new research study consists of an industry trend analysis of the market. The new research study consists of industry trends, pricing analysis, patent analysis, conference and webinar materials, key stakeholders, and buying behaviour in the market. The incidence of dental problems such as dental caries, increase in awareness of oral health and hygiene, increase in the demand for clear aligners, increase in demand for same-day dentistry, technological advancements in intraoral scanners, and the growing market for dental tourism in developing countries are major key drivers for the market. However, the high cost of intraoral scanner systems and the high cost of dental procedures are the factors that impede market growth.
In this report, the intraoral scanners market is segmented into –modality, applications, region, and end users.
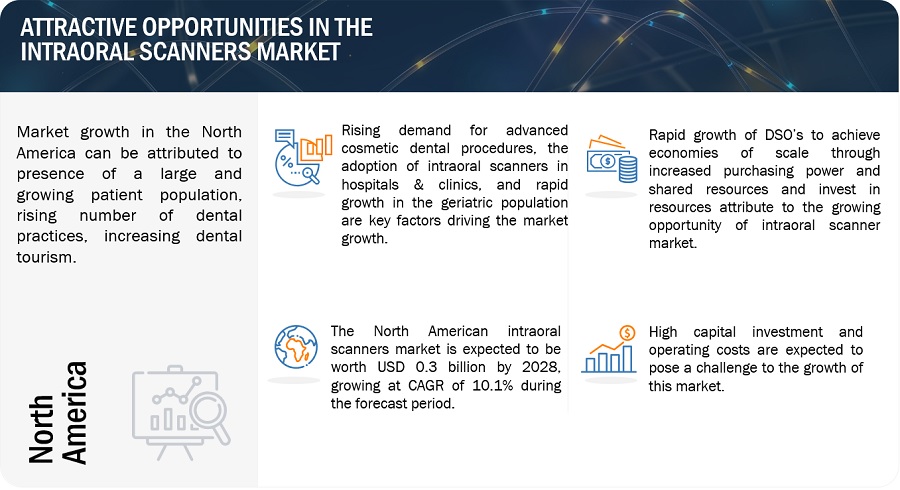
Attractive Opportunities in the Intraoral Scanners Market
To know about the assumptions considered for the study, Request for Free Sample Report
Intraoral Scanners Market Dynamics
Driver: Technological advancements in intraoral scanners
The intraoral scanners and software can be used in the detection and objective monitoring of oral diseases such as caries, tooth wear, or periodontal diseases. Recent technological advancements include caries detection technology, enhanced accuracy of digital impressions, and a decrease in the weight of the scanning wand. For prosthesis fabrication, intraoral scanners enhance the accuracy of an impression and are time efficient with minimal irregularities. In implantology, the intraoral scanners can be used for guided surgery, the creation of custom abutments, or screw-retained crowns, which can be used for the precise placement of implant roots.
Restraint: High cost of intraoral scanners and dental procedures
The average cost of one intraoral scanner can go up to USD 50,000. Due to this, most small and medium-sized dental businesses are unable to invest in intraoral scanners.
Additionally, most dental procedures are offered at a high cost, especially in developed countries. For instance, most of the insurance providers in developed regions across North America and Europe consider dental implants a cosmetic product. Hence, they provide minimal or no reimbursements for dental implants. Therefore, patients must bear the major portion of the cost, with little support from insurance coverage. Because of this, patients' decision to opt for treatment largely depends on their ability to afford it. This is a major factor restricting the adoption of technologically advanced solutions in developed countries leading to becoming a restraint for the adoption of intraoral scanners due to high cost.
Opportunity: Potential for growth in emerging countries
China, Japan, the Middle East, Australia, New Zealand, and India are some of the emerging markets for intraoral scanner systems. In most of these geographies, the market is in a primitive stage.
The high growth potential of these markets can be attributed to their expanding middle-class population and increasing income levels. There is a rapid increase in the incidence of dental disorders, evolving the infrastructure of oral healthcare as well as an inclination to spend more on dental treatments due to the increase in disposable incomes as well as the increasing awareness of oral health is expected to attribute to the increasing demand of the intraoral scanners.
For instance, In Asia, by 2030, it is expected that 66% of the population will be the middle-class population. In countries such as China and India, the rise in purchasing power has enabled people to avail high-cost and advanced diagnostic treatments.
Challenge: Dearth of trained dental practitioners
There is a shortage of dental professionals in countries which is becoming a challenge due to the rapid increase in dental disease burden. There is a rise in incidences of dental caries and gum issues. For instance, according to the National Health Resources And Services Administration, by 2030, the US will be facing a shortage of 4,000 dentists, which will become a challenge.
Intraoral Scanners Market Ecosystem
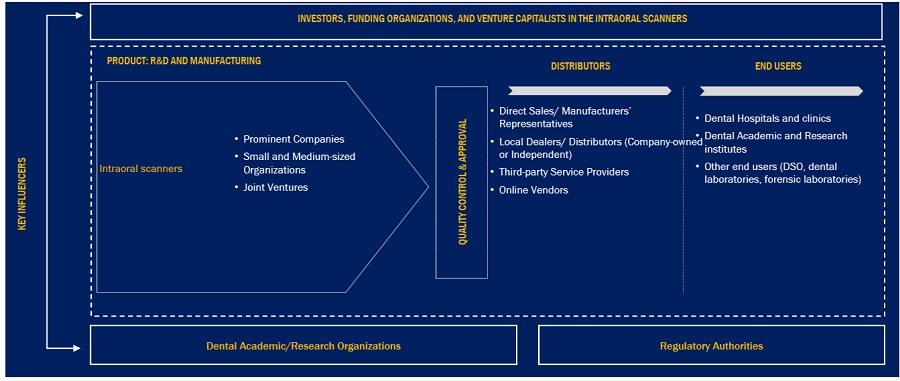
Prominent companies in this market include DENTSPLY SIRONA Inc (US), 3Shape (US), Envista Holdings Corporation (US), Medit Corp. (South Korea), and Align Technology Inc. (US). These are some of the top players that have been operating for several years in the market. These companies have various diversified product portfolios, strong sales across the globe, and marketing networks.
The top companies in this market include manufacturers of intraoral scanners who are financially stable. These companies have various different product portfolios.
Some key market players include DENTSPLY SIRONA Inc (US), Align Technology Inc. (US), Envista Holdings Corporation (US), 3Shape (US), and Medit Corp. (South Korea).
Among end users, Dental Hospitals and Clinics occupy the largest share of the intraoral scanners industry in 2022.
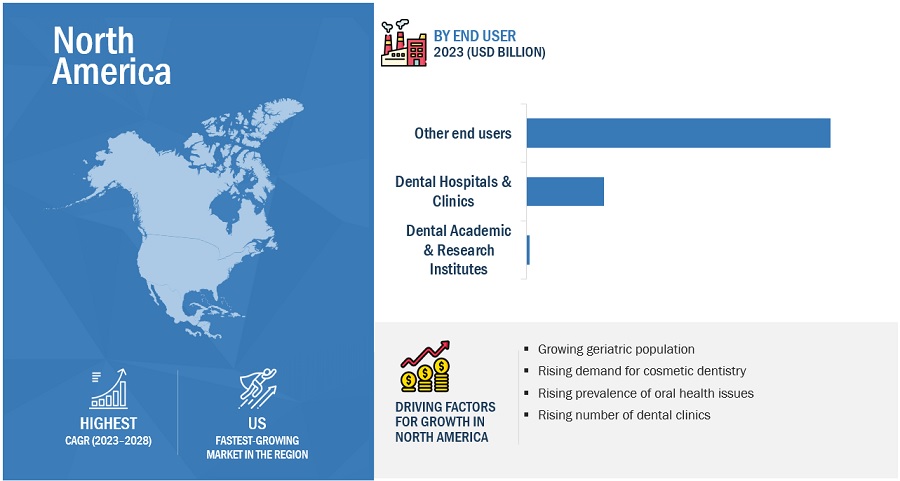
Dental hospitals and clinics occupy the largest share of the intraoral scanners market. This can be attributed to an increasing number of dental practices, rising dental expenditure, growing patient population, and rising demand for dental tourism, especially in developing countries. Dental tourism is a growing and emerging phenomenon that is becoming more attractive due to its potential for decreased expenses, increased convenience, and immediacy of treatment.
Among applications, orthodontics occupies the largest share of the intraoral scanners industry in 2022
The increasing incidences of malocclusions, rising demand for clear aligners, and rising disposable incomes are attributing to the growth of this segment of the intraoral scanners market. The orthodontic laboratories are adopting the use of intraoral scanners for taking impressions as it is time efficient and provides the impressions with accuracy. The use of intraoral scanners in orthodontics enhances the diagnosis as well as helps in better treatment planning by making it easy to transfer the data.
North America was the largest market in the world for intraoral scanners industry in 2022
In 2022, North America has occupied the largest share of the intraoral scanners market globally. The major factor that is attributing to the growth of this region can be the growing prevalence of oral diseases. For instance, according to the Centers for disease control and Prevention, in 2020, about 47% of people who are age 30 have periodontal disease. While other factors include rising awareness of oral diseases and increasing support from the government.
To know about the assumptions considered for the study, download the pdf brochure
The key players in the intraoral scanners market include DENTSPLY SIRONA Inc (US), Align Technology Inc. (US), Envista Holdings Corporation (US), 3shape (US), and Medit Corp.(South Korea).
These companies adopted strategies such as partnerships, acquisitions, and collaborations to strengthen their presence in the intraoral scanners market.
Scope of the Intraoral Scanners Industry
|
Report Metric |
Details |
|
Market Revenue in 2023 |
$0.6 billion |
|
Projected Revenue by 2028 |
$1.0 billion |
|
Revenue Rate |
Poised to Grow at a CAGR of 11.0% |
|
Market Driver |
Technological advancements in intraoral scanners |
|
Market Opportunity |
Potential for growth in emerging countries |
This research report categorizes the intraoral scanners market to forecast revenue and analyze trends in each of the following submarkets:
By Modality
- Wired Scanner
- Wireless Scanner
By Applications
- Prosthodontics
- Orthodontics
- Endodontics
- Others
By End User
- Dental hospitals & Clinics
- Dental Academic and Research Institutes
- Other End Users
By Region
-
North America
- US
- Canada
-
Europe
- Germany
- UK
- France
- Spain
- Italy
-
Asia Pacific
- Japan
- China
- India
- Australia
- South Korea
- RoAPAC
- Latin America
- Middle East & Africa
Recent Developments of Intraoral Scanners Industry
- In September 2022, DENTSPLY SIRONA Inc. launched a new laptop version of the prime scan intraoral scanner. It provides easy scanning of the intraoral cavity.
- In September 2022, one of the market leaders, 3Shape, introduced TRIOS 5 Wireless, a completely new, state-of-the-art intraoral scanner designed to make it easier than ever for dentists to go digital with their dentistry.
- In July 2021, DENTSPLY SIRONA Inc.(US) partnered with 3 Shape (Denmark) To provide better access for TRIOS users to SureSmile Clear aligners.
Frequently Asked Questions (FAQ):
What is the projected market revenue value of the global intraoral scanners market?
The global intraoral scanners market boasts a total revenue value of $1.0 billion in 2028.
What is the estimated growth rate (CAGR) of the global intraoral scanners market?
The global intraoral scanners market has an estimated compound annual growth rate (CAGR) of 11.0% and a revenue size in the region of $0.6 billion in 2023.
To speak to our analyst for a discussion on the above findings, click Speak to Analyst


- 5.1 INTRODUCTION
-
5.2 MARKET DYNAMICSDRIVERS- Increasing prevalence of oral health disorders- Increasing demand for same-day dentistry- Technological advancements in intraoral scannersRESTRAINTS- High cost of intraoral scanners and dental proceduresOPPORTUNITIES- Consolidation of dental practices- Growth potential of emerging economiesCHALLENGES- Dearth of trained dental practitioners- Inability of intraoral scanners to detect deep margin lines in prepared teeth
-
5.3 INDUSTRY TRENDSINCREASING DSO ACTIVITY IN DEVELOPED COUNTRIESGROWING DEMAND FOR DIGITAL DENTISTRY
-
5.4 TECHNOLOGY ANALYSISTRIANGULATIONCONFOCAL MICROSCOPY TECHNOLOGYSTEREOPHOTOGRAMMETRY TECHNOLOGY3D MOTION VIDEO TECHNOLOGYCARIES DETECTION TECHNOLOGYAI IN DENTAL RADIOLOGY
-
5.5 ECOSYSTEM MAPPING
-
5.6 PATENT ANALYSISPATENT PUBLICATION TRENDS FOR INTRAORAL SCANNERSINSIGHTS ON JURISDICTION AND TOP APPLICANT ANALYSIS
- 5.7 TRADE ANALYSIS
- 5.8 ADJACENT MARKETS
-
5.9 PORTER’S FIVE FORCES ANALYSISINTENSITY OF COMPETITIVE RIVALRYBARGAINING POWER OF SUPPLIERSBARGAINING POWER OF BUYERSTHREAT OF SUBSTITUTESTHREAT OF NEW ENTRANTS
-
5.10 REGULATORY LANDSCAPEUSEUROPEAN UNIONCHINAREGULATORY BODIES, GOVERNMENT AGENCIES, AND OTHER ORGANIZATIONS
- 5.11 KEY CONFERENCES AND EVENTS, 2023–2024
-
5.12 PRICING ANALYSISAVERAGE SELLING PRICE OF INTRAORAL SCANNERS, BY TYPEAVERAGE SELLING PRICE TRENDS
- 5.13 VALUE CHAIN ANALYSIS
-
5.14 KEY STAKEHOLDERS AND BUYING CRITERIAKEY STAKEHOLDERS IN BUYING PROCESSBUYING CRITERIA
- 6.1 INTRODUCTION
-
6.2 WIRED SCANNERSHIGH ACCURACY AND DETAIL IN DIGITAL REPRESENTATIONS TO PROPEL USAGE OF WIRED SCANNERS
-
6.3 WIRELESS SCANNERSPORTABILITY, EASE OF USE TO DRIVE ADOPTION
- 7.1 INTRODUCTION
-
7.2 ORTHODONTICSORTHODONTICS TO HOLD LARGEST SHARE OF APPLICATIONS MARKET
-
7.3 PROSTHODONTICSGROWING EDENTULOUS POPULATION TO INCREASE USAGE OF INTRAORAL SCANNERS IN PROSTHODONTICS
-
7.4 IMPLANTOLOGYGROWING PREFERENCE FOR INTRAORAL SCANNERS TO DRIVE MARKET
- 7.5 OTHER APPLICATIONS
- 8.1 INTRODUCTION
-
8.2 DENTAL HOSPITALS & CLINICSDENTAL HOSPITALS & CLINICS TO HOLD LARGEST MARKET SHARE TILL 2028
-
8.3 DENTAL ACADEMIC & RESEARCH INSTITUTESRISING INDUSTRY-ACADEMIC COOPERATION AND FINANCING FOR DENTAL RESEARCH TO DRIVE MARKET
- 8.4 OTHER END USERS
- 9.1 INTRODUCTION
-
9.2 NORTH AMERICANORTH AMERICA: RECESSION IMPACTUS- US to dominate North American intraoral scanners marketCANADA- Growing healthcare expenditure and favorable funding to support growth
-
9.3 EUROPEEUROPE: RECESSION IMPACTGERMANY- Favorable reimbursement policies to support demand growthFRANCE- Rising awareness of dental diseases to drive marketUK- Growing incidence of dental disorders and favorable coverage under NHS to support market growthITALY- Low-cost treatments and growing penetration of dental products to support growthSPAIN- Rising demand for cosmetic dentistry to drive marketREST OF EUROPE
-
9.4 ASIA PACIFICASIA PACIFIC: RECESSION IMPACTCHINA- Rising demand for dental care to favor adoption of scannersJAPAN- Rising geriatric population to support growthINDIA- Growing dental care sector and rising foreign investment to drive marketAUSTRALIA- Rising dental disease prevalence to support market growthSOUTH KOREA- Significant growth opportunities due to rising geriatric populationREST OF ASIA PACIFIC
-
9.5 LATIN AMERICASURGE IN DENTAL TOURISM TO SUPPORT GROWTHLATIN AMERICA: RECESSION IMPACT
-
9.6 MIDDLE EAST & AFRICARISING AWARENESS OF DENTAL HYGIENE TO DRIVE MARKETMIDDLE EAST & AFRICA: RECESSION IMPACT

- 10.1 INTRODUCTION
- 10.2 KEY STRATEGIES ADOPTED BY PLAYERS
- 10.3 REVENUE ANALYSIS OF KEY MARKET PLAYERS
- 10.4 MARKET SHARE ANALYSIS
-
10.5 COMPANY EVALUATION MATRIX, 2022STARSEMERGING LEADERSPERVASIVE PLAYERSPARTICIPANTS
- 10.6 COMPETITIVE BENCHMARKING
-
10.7 COMPETITIVE SCENARIOPRODUCT LAUNCHESDEALSOTHER DEVELOPMENTS
-
11.1 KEY PLAYERSDENTSPLY SIRONA, INC.- Business overview- Products offered- Recent developments- MnM view3SHAPE- Business overview- Products offered- Recent developments- MnM viewSTRAUMANN GROUP- Business overview- Products offered- Recent developments- MnM viewALIGN TECHNOLOGY, INC.- Business overview- Products offered- Recent developments- MnM viewENVISTA HOLDINGS CORPORATION- Business overview- Products offered- Recent developments- MnM viewMEDIT CORP.- Business overview- Products offeredPLANMECA OY- Business overview- Products offered- Recent developmentsSHINING 3D- Business overview- Products offered- Recent developmentsGUANGDONG LAUNCA MEDICAL DEVICE TECHNOLOGY- Business overview- Products offered- Recent developments3DISC- Business overview- Products offered- Recent developments
-
11.2 OTHER PLAYERSCHANGZHOU SIFARY MEDICAL TECHNOLOGY- Business overview- Products offeredALLIEDSTAR MEDICAL EQUIPMENT- Business overview- Products offeredIVOCLAR VIVADENT- Business overview- Products offered- Recent developmentsPANDA SCANNER (FREQTY TECHNOLOGY)- Business overview- Products offered- Recent developmentsNEOSS AG- Business overview- Products offeredFUSSEN TECHNOLOGY- Business overview- Products offered- Recent developmentsCONDOR TECHNOLOGIES NV- Business overview- Products offeredINTELLISCAN 3D- Business overview- Products offeredRUNYES MEDICAL INSTRUMENT- Business overview- Products offeredAMANN GIRRBACH AG- Business overview- Products offered- Recent developmentsDENSYS3DBLZ TECHNOLOGYIMES-ICORE GMBH3M ORAL CAREJIANGSU WEIYUN ARTIFICIAL INTELLIGENCE (AI SMILE)
- 12.1 DISCUSSION GUIDE
- 12.2 KNOWLEDGESTORE: MARKETSANDMARKETS’ SUBSCRIPTION PORTAL
- 12.3 CUSTOMIZATION OPTIONS
- 12.4 RELATED REPORTS
- 12.5 AUTHOR DETAILS
- TABLE 1 STANDARD CURRENCY CONVERSION RATES (UNIT OF USD)
- TABLE 2 RESEARCH ASSUMPTIONS
- TABLE 3 RISK ASSESSMENT
- TABLE 4 US: PEOPLE WITH UNTREATED DENTAL CARIES, BY AGE GROUP, 2019
- TABLE 5 PROJECTED INCREASE IN ABOVE-65 AGE GROUP, BY REGION, 2019–2050 (MILLION)
- TABLE 6 COMPARISON OF IMPRESSIONS: DIGITAL INTRAORAL VS. CONVENTIONAL PHYSICAL
- TABLE 7 KEY INTRAORAL SCANNERS, BY WEIGHT
- TABLE 8 AVERAGE COST OF DENTAL TREATMENT, BY COUNTRY (2022)
- TABLE 9 AVERAGE PROCEDURAL COST IN TOP TEN DENTAL TOURISM DESTINATIONS (USD)
- TABLE 10 RECENT DEALS BACKED BY PRIVATE EQUITY (US), 2020–2022
- TABLE 11 INTRAORAL SCANNERS MARKET: LIST OF MAJOR PATENTS
- TABLE 12 US: INSTRUMENTS AND APPLIANCES USED IN MEDICAL, SURGICAL, DENTAL OR VETERINARY SCIENCES: EXPORTS, 2019–2022 (IN 000’)
- TABLE 13 INTRAORAL SCANNERS MARKET: PORTER’S FIVE FORCES
- TABLE 14 NORTH AMERICA: REGULATORY BODIES, GOVERNMENT AGENCIES, AND OTHER ORGANIZATIONS
- TABLE 15 EUROPE: REGULATORY BODIES, GOVERNMENT AGENCIES, AND OTHER ORGANIZATIONS
- TABLE 16 ASIA PACIFIC: REGULATORY BODIES, GOVERNMENT AGENCIES, AND OTHER ORGANIZATIONS
- TABLE 17 LATIN AMERICA: REGULATORY BODIES, GOVERNMENT AGENCIES, AND OTHER ORGANIZATIONS
- TABLE 18 MIDDLE EAST & AFRICA: REGULATORY BODIES, GOVERNMENT AGENCIES, AND OTHER ORGANIZATIONS
- TABLE 19 KEY CONFERENCES AND EVENTS, 2023–2024
- TABLE 20 AVERAGE SYSTEM COST
- TABLE 21 INFLUENCE OF STAKEHOLDERS ON BUYING PROCESS FOR INTRAORAL SCANNERS
- TABLE 22 DIFFERENCES BETWEEN WIRED AND WIRELESS SCANNERS
- TABLE 23 INTRAORAL SCANNERS MARKET, BY TYPE, 2021–2028 (USD MILLION)
- TABLE 24 WIRED SCANNERS OFFERED BY LEADING PLAYERS
- TABLE 25 WIRED INTRAORAL SCANNERS MARKET, BY COUNTRY, 2021–2028 (USD MILLION)
- TABLE 26 WIRELESS SCANNERS OFFERED BY LEADING PLAYERS
- TABLE 27 WIRELESS INTRAORAL SCANNERS MARKET, BY COUNTRY, 2021–2028 (USD MILLION)
- TABLE 28 INTRAORAL SCANNERS MARKET, BY APPLICATION, 2021–2028 (USD MILLION)
- TABLE 29 INTRAORAL SCANNERS MARKET FOR ORTHODONTICS, BY COUNTRY, 2021–2028 (USD MILLION)
- TABLE 30 INTRAORAL SCANNERS MARKET FOR PROSTHODONTICS, BY COUNTRY, 2021–2028 (USD MILLION)
- TABLE 31 INTRAORAL SCANNERS MARKET FOR IMPLANTOLOGY, BY COUNTRY, 2021–2028 (USD MILLION)
- TABLE 32 INTRAORAL SCANNERS MARKET FOR OTHER APPLICATIONS, BY COUNTRY, 2021–2028 (USD MILLION)
- TABLE 33 INTRAORAL SCANNERS MARKET, BY END USER, 2021–2028 (USD MILLION)
- TABLE 34 TOP DESTINATIONS FOR COST-EFFECTIVE DENTAL TREATMENT
- TABLE 35 INTRAORAL SCANNERS MARKET FOR DENTAL HOSPITALS & CLINICS, BY COUNTRY, 2021–2028 (USD MILLION)
- TABLE 36 TOP 10 NIDCR GRANTS TO US DENTAL INSTITUTIONS (USD MILLION)
- TABLE 37 INTRAORAL SCANNERS MARKET FOR DENTAL ACADEMIC & RESEARCH INSTITUTES, BY COUNTRY, 2021–2028 (USD MILLION)
- TABLE 38 INTRAORAL SCANNERS MARKET FOR OTHER END USERS, BY COUNTRY, 2021–2028 (USD MILLION)
- TABLE 39 INTRAORAL SCANNERS MARKET, BY REGION, 2021–2028 (USD MILLION)
- TABLE 40 NORTH AMERICA: INTRAORAL SCANNERS MARKET, BY COUNTRY, 2021–2028 (USD MILLION)
- TABLE 41 NORTH AMERICA: INTRAORAL SCANNERS MARKET, BY TYPE, 2021–2028 (USD MILLION)
- TABLE 42 NORTH AMERICA: INTRAORAL SCANNERS MARKET, BY APPLICATION, 2021–2028 (USD MILLION)
- TABLE 43 NORTH AMERICA: INTRAORAL SCANNERS MARKET, BY END USER, 2021–2028 (USD MILLION)
- TABLE 44 US: MACROECONOMIC INDICATORS
- TABLE 45 US: INTRAORAL SCANNERS MARKET, BY TYPE, 2021–2028 (USD MILLION)
- TABLE 46 US: INTRAORAL SCANNERS MARKET, BY APPLICATION, 2021–2028 (USD MILLION)
- TABLE 47 US: INTRAORAL SCANNERS MARKET, BY END USER, 2021–2028 (USD MILLION)
- TABLE 48 CANADA: MACROECONOMIC INDICATORS
- TABLE 49 CANADA: INTRAORAL SCANNERS MARKET, BY TYPE, 2021–2028 (USD MILLION)
- TABLE 50 CANADA: INTRAORAL SCANNERS MARKET, BY APPLICATION, 2021–2028 (USD MILLION)
- TABLE 51 CANADA: INTRAORAL SCANNERS MARKET, BY END USER, 2021–2028 (USD MILLION)
- TABLE 52 EUROPE: INTRAORAL SCANNERS MARKET, BY COUNTRY, 2021–2028 (USD MILLION)
- TABLE 53 EUROPE: INTRAORAL SCANNERS MARKET, BY TYPE, 2021–2028 (USD MILLION)
- TABLE 54 EUROPE: INTRAORAL SCANNERS MARKET, BY APPLICATION, 2021–2028 (USD MILLION)
- TABLE 55 EUROPE: INTRAORAL SCANNERS MARKET, BY END USER, 2021–2028 (USD MILLION)
- TABLE 56 GERMANY: MACROECONOMIC INDICATORS
- TABLE 57 GERMANY: INTRAORAL SCANNERS MARKET, BY TYPE, 2021–2028 (USD MILLION)
- TABLE 58 GERMANY: INTRAORAL SCANNERS MARKET, BY APPLICATION, 2021–2028 (USD MILLION)
- TABLE 59 GERMANY: INTRAORAL SCANNERS MARKET, BY END USER, 2021–2028 (USD MILLION)
- TABLE 60 FRANCE: MACROECONOMIC INDICATORS
- TABLE 61 FRANCE: INTRAORAL SCANNERS MARKET, BY TYPE, 2021–2028 (USD MILLION)
- TABLE 62 FRANCE: INTRAORAL SCANNERS MARKET, BY APPLICATION, 2021–2028 (USD MILLION)
- TABLE 63 FRANCE: INTRAORAL SCANNERS MARKET, BY END USER, 2021–2028 (USD MILLION)
- TABLE 64 UK: MACROECONOMIC INDICATORS
- TABLE 65 UK: INTRAORAL SCANNERS MARKET, BY TYPE, 2021–2028 (USD MILLION)
- TABLE 66 UK: INTRAORAL SCANNERS MARKET, BY APPLICATION, 2021–2028 (USD MILLION)
- TABLE 67 UK: INTRAORAL SCANNERS MARKET, BY END USER, 2021–2028 (USD MILLION)
- TABLE 68 ITALY: MACROECONOMIC INDICATORS
- TABLE 69 ITALY: INTRAORAL SCANNERS MARKET, BY TYPE, 2021–2028 (USD MILLION)
- TABLE 70 ITALY: INTRAORAL SCANNERS MARKET, BY APPLICATION, 2021–2028 (USD MILLION)
- TABLE 71 ITALY: INTRAORAL SCANNERS MARKET, BY END USER, 2021–2028 (USD MILLION)
- TABLE 72 SPAIN: MACROECONOMIC INDICATORS
- TABLE 73 SPAIN: INTRAORAL SCANNERS MARKET, BY TYPE, 2021–2028 (USD MILLION)
- TABLE 74 SPAIN: INTRAORAL SCANNERS MARKET, BY APPLICATION, 2021–2028 (USD MILLION)
- TABLE 75 SPAIN: INTRAORAL SCANNERS MARKET, BY END USER, 2021–2028 (USD MILLION)
- TABLE 76 REST OF EUROPE: INTRAORAL SCANNERS MARKET, BY TYPE, 2021–2028 (USD MILLION)
- TABLE 77 REST OF EUROPE: INTRAORAL SCANNERS MARKET, BY APPLICATION, 2021–2028 (USD MILLION)
- TABLE 78 REST OF EUROPE: INTRAORAL SCANNERS MARKET, BY END USER, 2021–2028 (USD MILLION)
- TABLE 79 ASIA PACIFIC: INTRAORAL SCANNERS MARKET, BY COUNTRY, 2021–2028 (USD MILLION)
- TABLE 80 ASIA PACIFIC: INTRAORAL SCANNERS MARKET, BY TYPE, 2021–2028 (USD MILLION)
- TABLE 81 ASIA PACIFIC: INTRAORAL SCANNERS MARKET, BY APPLICATION, 2021–2028 (USD MILLION)
- TABLE 82 ASIA PACIFIC: INTRAORAL SCANNERS MARKET, BY END USER, 2021–2028 (USD MILLION)
- TABLE 83 CHINA: MACROECONOMIC INDICATORS
- TABLE 84 CHINA: INTRAORAL SCANNERS MARKET, BY TYPE, 2021–2028 (USD MILLION)
- TABLE 85 CHINA: INTRAORAL SCANNERS MARKET, BY APPLICATION, 2021–2028 (USD MILLION)
- TABLE 86 CHINA: INTRAORAL SCANNERS MARKET, BY END USER, 2021–2028 (USD MILLION)
- TABLE 87 JAPAN: MACROECONOMIC INDICATORS
- TABLE 88 JAPAN: INTRAORAL SCANNERS MARKET, BY TYPE, 2021–2028 (USD MILLION)
- TABLE 89 JAPAN: INTRAORAL SCANNERS MARKET, BY APPLICATION, 2021–2028 (USD MILLION)
- TABLE 90 JAPAN: INTRAORAL SCANNERS MARKET, BY END USER, 2021–2028 (USD MILLION)
- TABLE 91 INDIA: MACROECONOMIC INDICATORS
- TABLE 92 INDIA: INTRAORAL SCANNERS MARKET, BY TYPE, 2021–2028 (USD MILLION)
- TABLE 93 INDIA: INTRAORAL SCANNERS MARKET, BY APPLICATION, 2021–2028 (USD MILLION)
- TABLE 94 INDIA: INTRAORAL SCANNERS MARKET, BY END USER, 2021–2028 (USD MILLION)
- TABLE 95 AUSTRALIA: MACROECONOMIC INDICATORS
- TABLE 96 AUSTRALIA: INTRAORAL SCANNERS MARKET, BY TYPE, 2021–2028 (USD MILLION)
- TABLE 97 AUSTRALIA: INTRAORAL SCANNERS MARKET, BY APPLICATION, 2021–2028 (USD MILLION)
- TABLE 98 AUSTRALIA: INTRAORAL SCANNERS MARKET, BY END USER, 2021–2028 (USD MILLION)
- TABLE 99 SOUTH KOREA: MACROECONOMIC INDICATORS
- TABLE 100 SOUTH KOREA: INTRAORAL SCANNERS MARKET, BY TYPE, 2021–2028 (USD MILLION)
- TABLE 101 SOUTH KOREA: INTRAORAL SCANNERS MARKET, BY APPLICATION, 2021–2028 (USD MILLION)
- TABLE 102 SOUTH KOREA: INTRAORAL SCANNERS MARKET, BY END USER, 2021–2028 (USD MILLION)
- TABLE 103 REST OF ASIA PACIFIC: INTRAORAL SCANNERS MARKET, BY TYPE, 2021–2028 (USD MILLION)
- TABLE 104 REST OF ASIA PACIFIC: INTRAORAL SCANNERS MARKET, BY APPLICATION, 2021–2028 (USD MILLION)
- TABLE 105 REST OF ASIA PACIFIC: INTRAORAL SCANNERS MARKET, BY END USER, 2021–2028 (USD MILLION)
- TABLE 106 LATIN AMERICA: INTRAORAL SCANNERS MARKET, BY TYPE, 2021–2028 (USD MILLION)
- TABLE 107 LATIN AMERICA: INTRAORAL SCANNERS MARKET, BY APPLICATION, 2021–2028 (USD MILLION)
- TABLE 108 LATIN AMERICA: INTRAORAL SCANNERS MARKET, BY END USER, 2021–2028 (USD MILLION)
- TABLE 109 MIDDLE EAST & AFRICA: INTRAORAL SCANNERS MARKET, BY TYPE, 2021–2028 (USD MILLION)
- TABLE 110 MIDDLE EAST & AFRICA: INTRAORAL SCANNERS MARKET, BY APPLICATION, 2021–2028 (USD MILLION)
- TABLE 111 MIDDLE EAST & AFRICA: INTRAORAL SCANNERS MARKET, BY END USER, 2021–2028 (USD MILLION)
- TABLE 112 OVERALL COMPANY FOOTPRINT (KEY PLAYERS)
- TABLE 113 COMPANY TYPE FOOTPRINT
- TABLE 114 COMPANY END-USER FOOTPRINT
- TABLE 115 COMPANY APPLICATION FOOTPRINT
- TABLE 116 COMPANY REGIONAL FOOTPRINT
- TABLE 117 PRODUCT LAUNCHES, 2019–2023
- TABLE 118 DEALS (JANUARY 2019– JULY 2023)
- TABLE 119 OTHER DEVELOPMENTS, 2019–2023
- TABLE 120 DENTSPLY SIRONA, INC.: BUSINESS OVERVIEW
- TABLE 121 DENTSPLY SIRONA, INC.: PRODUCT LAUNCHES & UPGRADES
- TABLE 122 3SHAPE: BUSINESS OVERVIEW
- TABLE 123 3SHAPE: PRODUCT LAUNCHES
- TABLE 124 3SHAPE: DEALS
- TABLE 125 STRAUMANN GROUP: BUSINESS OVERVIEW
- TABLE 126 STRAUMANN GROUP: PRODUCT LAUNCHES & UPGRADES
- TABLE 127 STRAUMANN GROUP: DEALS
- TABLE 128 ALIGN TECHNOLOGY, INC.: BUSINESS OVERVIEW
- TABLE 129 ALIGN TECHNOLOGY, INC.: PRODUCT LAUNCHES & ENHANCEMENTS
- TABLE 130 ALIGN TECHNOLOGY, INC.: DEALS
- TABLE 131 ALIGN TECHNOLOGY, INC.: OTHER DEVELOPMENTS
- TABLE 132 ENVISTA HOLDINGS CORPORATION: BUSINESS OVERVIEW
- TABLE 133 ENVISTA HOLDINGS CORPORATION: DEALS
- TABLE 134 ENVISTA HOLDINGS CORPORATION: OTHER DEVELOPMENTS
- TABLE 135 MEDIT CORP.: BUSINESS OVERVIEW
- TABLE 136 PLANMECA OY: BUSINESS OVERVIEW
- TABLE 137 PLANMECA OY: PRODUCT LAUNCHES
- TABLE 138 PLANMECA OY: DEALS
- TABLE 139 SHINING 3D: BUSINESS OVERVIEW
- TABLE 140 SHINING 3D: PRODUCT LAUNCHES
- TABLE 141 GUANGDONG LAUNCA MEDICAL DEVICE TECHNOLOGY: BUSINESS OVERVIEW
- TABLE 142 GUANGDONG LAUNCA MEDICAL DEVICE TECHNOLOGY: PRODUCT LAUNCHES
- TABLE 143 3DISC: BUSINESS OVERVIEW
- TABLE 144 3DISC: PRODUCT UPGRADES
- TABLE 145 CHANGZHOU SIFARY MEDICAL TECHNOLOGY: BUSINESS OVERVIEW
- TABLE 146 ALLIEDSTAR MEDICAL EQUIPMENT: BUSINESS OVERVIEW
- TABLE 147 IVOCLAR VIVADENT: BUSINESS OVERVIEW
- TABLE 148 IVOCLAR VIVADENT: DEALS
- TABLE 149 PANDA SCANNER (FREQTY TECHNOLOGY): BUSINESS OVERVIEW
- TABLE 150 PANDA SCANNER (FREQTY TECHNOLOGY): PRODUCT LAUNCHES
- TABLE 151 NEOSS AG: BUSINESS OVERVIEW
- TABLE 152 FUSSEN TECHNOLOGY: BUSINESS OVERVIEW
- TABLE 153 FUSSEN TECHNOLOGY: PRODUCT LAUNCHES
- TABLE 154 CONDOR TECHNOLOGIES NV: BUSINESS OVERVIEW
- TABLE 155 INTELLISCAN 3D: BUSINESS OVERVIEW
- TABLE 156 RUNYES MEDICAL INSTRUMENT: BUSINESS OVERVIEW
- TABLE 157 AMANN GIRRBACH AG: BUSINESS OVERVIEW
- TABLE 158 AMANN GIRRBACH AG: DEALS
- FIGURE 1 RESEARCH DESIGN
- FIGURE 2 PRIMARY SOURCES
- FIGURE 3 BREAKDOWN OF PRIMARY INTERVIEWS: SUPPLY-SIDE AND DEMAND-SIDE PARTICIPANTS
- FIGURE 4 BREAKDOWN OF PRIMARY INTERVIEWS: BY COMPANY TYPE, DESIGNATION, AND REGION
- FIGURE 5 SUPPLY-SIDE MARKET SIZE ESTIMATION: REVENUE SHARE ANALYSIS
- FIGURE 6 REVENUE SHARE ANALYSIS ILLUSTRATION: ALIGN TECHNOLOGY INC.
- FIGURE 7 SUPPLY-SIDE ANALYSIS: INTRAORAL SCANNERS MARKET (2022)
- FIGURE 8 DEMAND SIDE ESTIMATION FOR INTRAORAL SCANNERS MARKET
- FIGURE 9 CAGR PROJECTIONS FROM ANALYSIS OF DRIVERS, RESTRAINTS, OPPORTUNITIES, AND CHALLENGES (2023–2028)
- FIGURE 10 CAGR PROJECTIONS: SUPPLY-SIDE ANALYSIS
- FIGURE 11 TOP-DOWN APPROACH
- FIGURE 12 MARKET DATA TRIANGULATION METHODOLOGY
- FIGURE 13 INTRAORAL SCANNERS MARKET, BY TYPE, 2023 VS. 2028 (USD MILLION)
- FIGURE 14 INTRAORAL SCANNERS MARKET, BY APPLICATION, 2023 VS. 2028 (USD MILLION)
- FIGURE 15 INTRAORAL SCANNERS MARKET, BY END USER, 2023 VS. 2028 (USD MILLION)
- FIGURE 16 GEOGRAPHIC SNAPSHOT: INTRAORAL SCANNERS MARKET
- FIGURE 17 RISING CASES OF DENTAL CARIES AND OTHER DENTAL DISORDERS TO DRIVE ADOPTION OF INTRAORAL SCANNERS
- FIGURE 18 WIRED SCANNERS HELD LARGEST MARKET SHARE IN 2022
- FIGURE 19 CHINA TO REGISTER HIGHEST GROWTH RATE DURING FORECAST PERIOD
- FIGURE 20 NORTH AMERICA TO DOMINATE INTRAORAL SCANNERS MARKET THROUGHOUT FORECAST PERIOD
- FIGURE 21 EMERGING ECONOMIES TO REGISTER HIGHER GROWTH RATES TILL 2028
- FIGURE 22 INTRAORAL SCANNERS MARKET: DRIVERS, RESTRAINTS, OPPORTUNITIES, AND CHALLENGES
- FIGURE 23 PREVALENCE OF DENTAL CARIES IN 6–19 AGE GROUP, BY COUNTRY, 2019 (PERCENTAGE OF POPULATION)
- FIGURE 24 INTRAORAL SCANNERS MARKET: ECOSYSTEM ANALYSIS
- FIGURE 25 PATENT PUBLICATION TRENDS (2013–2023)
- FIGURE 26 TOP APPLICANTS AND OWNERS (COMPANIES/INSTITUTES) FOR INTRAORAL SCANNER PATENTS, 2013–2023
- FIGURE 27 TOP 10 APPLICANT COUNTRIES/REGIONS FOR INTRAORAL SCANNER PATENTS, 2013–2023
- FIGURE 28 INTRAORAL SCANNERS MARKET: ADJACENT MARKETS
- FIGURE 29 AVERAGE SELLING PRICE OF INTRAORAL SCANNERS, BY TYPE
- FIGURE 30 VALUE CHAIN ANALYSIS
- FIGURE 31 INFLUENCE OF STAKEHOLDERS ON BUYING PROCESS FOR INTRAORAL SCANNERS
- FIGURE 32 KEY BUYING CRITERIA FOR INTRAORAL SCANNERS
- FIGURE 33 NORTH AMERICA: INTRAORAL SCANNERS MARKET SNAPSHOT
- FIGURE 34 US: RISE IN DENTAL EXPENDITURE, 2010–2022
- FIGURE 35 ASIA PACIFIC: INTRAORAL SCANNERS MARKET SNAPSHOT
- FIGURE 36 REVENUE ANALYSIS OF KEY MARKET PLAYERS
- FIGURE 37 INTRAORAL SCANNERS MARKET SHARE, BY KEY PLAYER (2022)
- FIGURE 38 INTRAORAL SCANNERS MARKET: COMPANY EVALUATION MATRIX (2022)
- FIGURE 39 DENTSPLY SIRONA, INC.: COMPANY SNAPSHOT
- FIGURE 40 STRAUMANN GROUP: COMPANY SNAPSHOT (2022)
- FIGURE 41 ALIGN TECHNOLOGY, INC.: COMPANY SNAPSHOT (2022)
- FIGURE 42 ENVISTA HOLDINGS CORPORATION: COMPANY SNAPSHOT (2022)
This study involved the extensive use of both primary and secondary sources. The research process involved the study of various factors affecting the industry to identify the segmentation types, key players, competitive landscape, key market dynamics, and key player strategies.
Secondary Research
The secondary research process involved the widespread use of secondary sources, directories, databases (such as Bloomberg Businessweek, Factiva, and D&B Hoovers), white papers, annual reports, company house documents, investor presentations, and SEC filings of companies. Secondary research was used to identify and collect information useful for the extensive, technical, market-oriented, and commercial study of the intraoral scanner market. It was also used to obtain important information about the key players and market classification and segmentation according to industry trends to the bottom-most level and key developments related to market and technology perspectives. A database of the key industry leaders was also prepared using secondary research.
Primary Research
In the primary research process, various sources from both the supply and demand sides were interviewed to obtain qualitative and quantitative information for this report. The primary sources from the supply side include industry experts such as CEOs, vice presidents, marketing and sales directors, technology & innovation directors, and related key executives from various key companies and organizations operating in the intraoral scanner market. The primary sources from the demand side included industry experts, purchase & sales managers, doctors, and personnel from research organizations. Primary research was conducted to validate the market segmentation, identify key players in the market, and gather insights on key industry trends and key market dynamics.
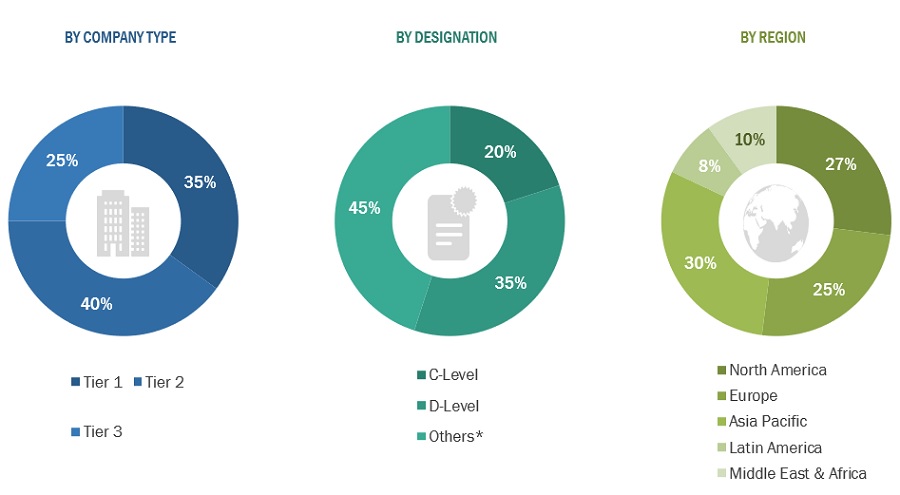
A breakdown of the primary respondents for the intraoral scanners market is provided below:
To know about the assumptions considered for the study, download the pdf brochure
Tiers are defined based on a company’s total revenue. As of 2022: Tier 1= >USD 1 billion, Tier 2 = USD 500 million to USD 1 billion, and Tier 3=
Breakdown of Primary Interviews: Supply-Side and Demand-Side Participants

Market Size Estimation
The total size of the intraoral scanner market was determined after data triangulation from four approaches, as mentioned below. After each approach, the weighted average of the three approaches was taken based on the level of assumptions used in each approach.
Global Intraoral Scanners Market Size
Approach to calculating the revenue of different players in the market
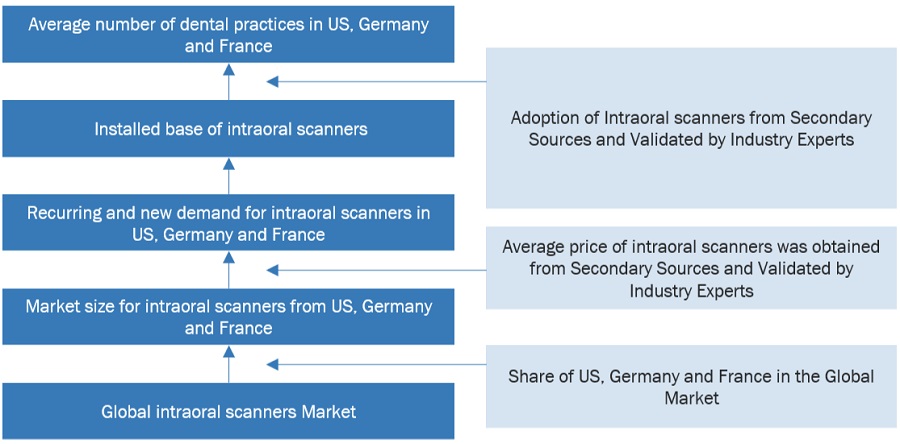
The size of the global intraoral scanner market was obtained from annual reports, SEC filings, online publications, and extensive primary interviews. A percentage split was applied to arrive at the size of market segments. Further splits were applied to arrive at the size for each sub-segment. These percentage splits were validated by primary participants. The country-level market sizes obtained from the annual reports, SEC filings, online publications, and extensive primary interviews were added up to reach the total market size for regions. By adding up the market sizes for all the regions, the global intraoral scanner market was derived.
Approach to derive the market size and estimate market growth
The market size and market growth were estimated through primary interviews on a regional and global level. All responses were collated, and a weighted average was taken to derive a probabilistic estimate of the market size and growth rate.

Data Triangulation
After arriving at the overall market size—using the market size estimation processes explained above—the market was split into several segments and sub-segments. To complete the overall market engineering process and arrive at the exact statistics of each market segment and subsegment, data triangulation and market breakdown procedures were employed, wherever applicable. The data was triangulated by studying various factors and trends from both the demand and supply sides.
Market Definition
Intraoral scanners are tools that transmit light into the mouth and take pictures of the soft tissues and teeth to make digital impressions of the oral cavity. Compared to conventional impressions, they are less messy and uncomfortable and don't expose you to radiation. The intraoral scanners are segmented by modality into wired and wireless scanners. These are used for applications such as orthodontics, prosthodontics, implantology and other dental applications.
Key Stakeholders
- Manufacturers and distributors of medical devices
- Intraoral scanner manufacturers
- Contract manufacturers of intraoral scanner
- Distributors of intraoral scanner
- Research and consulting firms
- Raw material suppliers of intraoral scanner
- Dental hospitals and clinics
- Dental laboratories and associations
- Dental practitioners
- Dental laboratory technicians
- Healthcare institutions
- Diagnostic laboratories
- Hospitals and clinics
- Academic institutions
- Research institutions
- Government associations
- Market research and consulting firms
- Venture capitalists and investors
Report Objectives
- To define, describe, segment, and forecast the intraoral scanner market by modality, application, end user, and region/country.
- To provide detailed information about the factors influencing the market growth (drivers, restraints, opportunities, and challenges).
- To analyze micromarkets with respect to individual growth trends, prospects, and contributions to the overall market.
- To analyze market opportunities for stakeholders and provide details of the competitive landscape for key players.
- To forecast the size of the intraoral scanner market in Europe, North America, Asia Pacific, Latin America, and the Middle East and Africa.
- To strategically profile key players in the intraoral scanner market and comprehensively analyze their core competencies.
- To track and analyze competitive developments, such as acquisitions, product launches, partnerships, and collaborations.
- To analyze the impact of the recession on the intraoral scanner market.
Available Customizations:
With the given market data, MarketsandMarkets offers customizations as per the company’s specific needs. The following customization options are available for the report:
- Additional country-level analysis of the intraoral scanner market
- Profiling of additional market players (up to 5)


Growth opportunities and latent adjacency in Intraoral/ IOL Scanners Market