Industrial Nitrogen Market by Form (Liquid, Compressed), Technology (Cryogenic distillation, Membrane separation), Transportation (Cylinder, Bulk, Pipeline), End-use industry (Metal manufacturing, Food & beverage), and Region - Global Forecast to 2022


[156 Pages Report] Industrial Nitrogen Market was valued at USD 15.03 Billion in 2017 and is expected to reach USD 19.96 Billion by 2022. The market is projected to grow at a CAGR of 5.83% during the forecast period. The base year considered for the study is 2016, and the market size is projected from 2017 to 2022.
The report aims at estimating the size and future growth potential of the industrial nitrogen market across different segments form, transportation & distribution, technology, end-use industry, and region. It also provides detailed information regarding the main factors influencing the growth of the market (drivers, restraints, opportunities, and industry-specific challenges). It aims to study the individual growth trends, prospects, and contribution of the various segments to the total market. The study also analyzes the opportunities in the market for stakeholders and details of the competitive landscape of market leaders. It also strategically profiles the key players and comprehensively analyzes their core competencies.
The research methodology used to estimate and forecast the industrial nitrogen market begins with capturing data on key vendor revenues through secondary research and associations such as the European Industrial Gases Association AISBL, US Environmental Protection Agency (IBEF), and the European Environment Agency. Vendor offerings are also taken into consideration to determine the market segmentation. The bottom-up procedure was employed to arrive at the overall size of the global industrial nitrogen market from the revenues of key players. After arriving at the overall market size, the total market was split into several segments and subsegments, which were then verified through primary research by conducting extensive interviews with key people such as CEOs, VPs, directors, and executives. These data triangulation and market breakdown procedures were employed to complete the overall market engineering process and arrive at the exact statistics for all segments and subsegments. The breakdown of profiles of primary participants is depicted in the figure below:
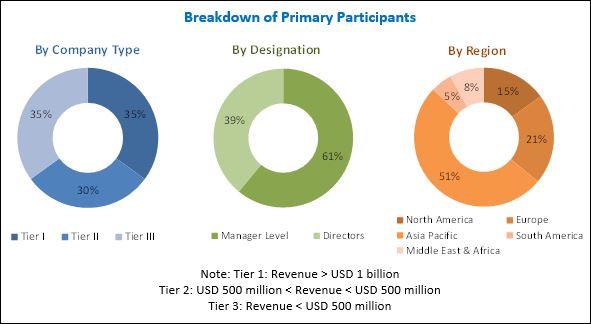
To know about the assumptions considered for the study, download the pdf brochure
The market ecosystem includes various stakeholders involved in the supply chain of the industrial nitrogen industry starting from raw material suppliers, research & development, and manufacturing. Post this, the marketing and sales of the products take place, which is only possible if an efficient distribution channel is developed. Finally, the end products are made available to the consumers. The global market for industrial nitrogen is dominated by players such as Praxair (US), Air Products and Chemicals (US), Air Liquide (France), Linde (Germany), and Taiyo Nippon Sanso (Japan). Other players in this market include Messer Group (Germany), Nexair LLC (US), and Gulf Cryo (Kuwait).
Target Audience
- Industrial nitrogen producers
- Raw material producers and suppliers
- Industrial nitrogen distributors and traders
- End-use sectors
- Governments and R&D institutions
- Associations and industry bodies
Scope of the Report
The research report segments the industrial nitrogen market into the following submarkets:
By Form:
- Compressed gas
- Liquid nitrogen
By Technology:
- Cryogenic fractional distillation
- Pressure swing adsorption
- Membrane separation
By Transportation & Distribution:
- Bulk
- Cylinder & packed gas
- Tonnage/Pipeline
By End-use Industry:
- Metal manufacturing & fabrication
- Oil & gas
- Petrochemical
- Pharmaceutical & healthcare
- Chemical
- Food & beverages
- Electronics
By Region:
- North America
- Europe
- Asia Pacific
- Middle East & Africa
- South America
Available Customizations
With the given market data, MarketsandMarkets offers customizations according to client-specific needs. The following customization options are available for the report:
Product Analysis
- Product Matrix, which gives a detailed comparison of the product portfolio of each company
Geographic Analysis
- Further analysis of the industrial nitrogen market for additional countries
Company Information
- Detailed analysis and profiling of additional market players
MarketsandMarkets projects that the industrial nitrogen market will grow from USD 15.03 Billion in 2017 to USD 19.96 Billion by 2022, at a CAGR of 5.83%. This market is witnessing considerable growth due to the growing food & beverage and pharmaceutical industries in the emerging Asia Pacific market. Technological advancements in industrial gas are the key factors driving the growth of the industrial nitrogen market.
The industrial nitrogen market, by form, is segmented into compressed gas and liquid nitrogen. The compressed gas segment accounted for the largest share in 2016. The dominant position of this segment is owing to the fact that nitrogen gas finds wide application in a large number of industries as it is used to store petroleum liquefied explosive and flammable materials since it is an active element. As nitrogen is an inert gas, it is also used in the manufacturing of stainless steel.
The industrial liquid nitrogen market, by end-use industry, is segmented into food & beverages, pharmaceuticals & healthcare, electronics, metal manufacturing & fabrication, chemical, oil & gas, petrochemical, and others (construction, automotive, R&D, rubber, and plastic). The food & beverage segment accounted for the largest market share in 2017. Industrial nitrogen creates a dry atmosphere, so foodstuffs do not perish due to moisture. It is also used to maintain freshness and increase the shelf life of products, which helps in the packaging and storage of food & beverages is driving the demand for industrial nitrogen in this sector.
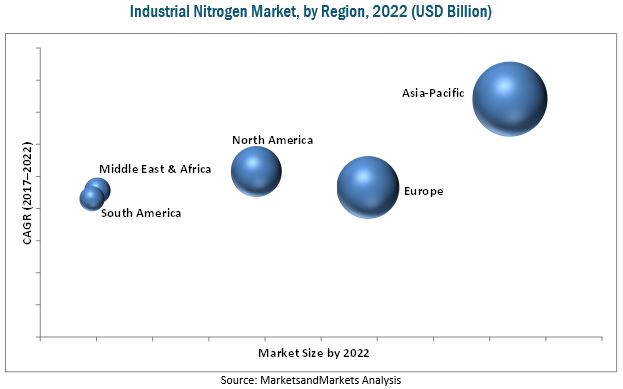
In 2016, Asia Pacific accounted for the largest share of the global industrial nitrogen market and is projected to grow at the highest rate during the forecast period. The increase in the demand for industrial nitrogen can largely be attributed to the rising population of the region with high disposable incomes and growing industrialization in the region.
However, factors such structural and regulatory restrictions are restraining the growth of the industrial nitrogen market. The global industrial nitrogen market is dominated by players such Praxair (US), Air Products and Chemicals (US), Air Liquide (France), Linde (Germany), and Taiyo Nippon Sanso (Japan). Other players in this market include Messer Group (Germany), Nexair LLC (US), and Gulf Cryo (Kuwait). These players adopted various strategies such as expansions & investments, joint ventures & agreements, contracts, new product launches, and mergers & acquisitions to increase their share in the industrial nitrogen market.
To speak to our analyst for a discussion on the above findings, click Speak to Analyst
 Exclusive indicates content/data unique to MarketsandMarkets and not available with any competitors.
Table of Contents
1 Introduction (Page No. - 16)
1.1 Objectives of the Study
1.2 Market Definition
1.3 Market Scope
1.3.1 Regional Scope
1.3.2 Years Considered
1.4 Currency Considered
1.5 Unit Considered
1.6 Stakeholders
2 Research Methodology (Page No. - 20)
2.1 Research Data
2.1.1 Secondary Data
2.1.1.1 Key Data From Secondary Sources
2.1.2 Primary Data
2.1.2.1 Key Data From Primary Sources
2.1.2.2 Key Industry Insights
2.2 Market Size Estimation
2.2.1 Bottom-Up Approach
2.2.2 Top-Down Approach
2.3 Market Share Estimation
2.4 Data Triangulation
2.5 Research Assumptions & Limitations
2.5.1 Research Assumptions
2.5.2 Limitations
3 Executive Summary (Page No. - 28)
3.1 Compressed Gas Segment to Dominate the Market By 2022
3.2 Cryogenic Fraction Distillation Technology to Dominate the Market Through 2022
3.3 Asia Pacific to Dominate the Market By 2022
4 Premium Insights (Page No. - 32)
4.1 Attractive Market Opportunities in the Industrial Nitrogen Market
4.2 Asia Pacific Industrial Nitrogen Market
4.3 Food & Beverage Industry is Projected to Dominate the Liquid Nitrogen Segment By 2022
4.4 Metal Manufacturing & Fabrication Industry is Projected to Dominate the Compressed Gas Segment By 2022
4.5 Cryogenic Fraction Distillation Technology Projected to Dominate the Market
5 Market Overview (Page No. - 35)
5.1 Introduction
5.2 Market Dynamics
5.2.1 Drivers
5.2.1.1 Growth of the Food & Beverage Industry
5.2.1.2 Growth of Modern Healthcare in Developing Markets
5.2.2 Restraints
5.2.2.1 Structural and Regulatory Restrictions
5.2.3 Opportunities
5.2.3.1 High Demand From the Chemical Industry
5.2.4 Challenges
5.2.4.1 High Cost of Production and Uncertain Rois
5.2.4.2 Growth Stagnation in North America and Europe
6 Industry Trends (Page No. - 38)
6.1 Porter�s Five Forces Analysis
6.1.1 Threat of New Entrants
6.1.2 Threats of Substitutes
6.1.3 Bargaining Power of Suppliers
6.1.4 Bargaining Power of Buyers
6.1.5 Intensity of Competitive Rivalry
7 Industrial Nitrogen Market, By Form (Page No. - 41)
7.1 Introduction
7.2 Compressed Gas
7.3 Liquid Nitrogen
8 Industrial Nitrogen Market, By Technology (Page No. - 44)
8.1 Introduction
8.2 Cryogenic Fraction Distillation
8.3 Membrane Separation
8.4 Pressure Swing Adsorption
9 Industrial Nitrogen Market, By Transportation & Distribution (Page No. - 47)
9.1 Introduction
9.2 Cylinders & Packaged Gas
9.3 Bulk
9.4 Tonnage/Pipeline
10 Industrial Nitrogen Market, By End-Use Industry (Page No. - 50)
10.1 Introduction
10.2 Petrochemical
10.3 Oil & Gas
10.4 Metal Manufacturing & Fabrication
10.5 Food & Beverage
10.6 Electronics
10.7 Pharmaceutical & Healthcare
10.8 Chemical
10.9 Others
11 Industrial Nitrogen Market, By Grade (Page No. - 56)
11.1 Introduction
11.1.1 High Purity
11.1.2 Low Purity
12 Industrial Nitrogen Market, By Region (Page No. - 59)
12.1 Introduction
12.2 North America
12.2.1 US
12.2.2 Canada
12.2.3 Mexico
12.3 Europe
12.3.1 UK
12.3.2 Italy
12.3.3 Germany
12.3.4 France
12.3.5 Rest of Europe
12.4 Asia Pacific
12.4.1 China
12.4.2 India
12.4.3 Japan
12.4.4 Australia
12.4.5 Rest of Asia Pacific
12.5 Middle East & Africa
12.5.1 Saudi Arabia
12.5.2 South Africa
12.5.3 Turkey
12.5.4 Rest of Middle East & Africa
12.6 South America
12.6.1 Brazil
12.6.2 Argentina
12.6.3 Rest of South America
13 Competitive Landscape (Page No. - 110)
13.1 Overview
13.2 Competitive Scenario
13.2.1 Expansions & Investments
13.2.2 Mergers & Acquisitions
13.2.3 Agreements, Contracts, and Joint Ventures
13.2.4 New Product and Technology Launches
13.3.1 Air Liquide
13.3.2 The Linde Group
13.3.3 Praxair Inc.
13.3.4 Air Products and Chemicals
13.3.5 Messer Group
14 Company Profiles (Page No. - 116)
(Business Overview, Products Offered, Recent Developments, SWOT Analysis, MnM View)*
14.1 The Linde Group
14.2 Praxair Inc.
14.3 Air Liquide
14.4 Air Products and Chemicals
14.5 Messer Group
14.6 Southern Industrial Gas Berhad
14.7 Taiyo Nippon Sanso Corporation
14.8 Gulf Cryo
14.9 Emirates Industrial Gases Co. LLC
14.10 Nexair LLC
*Details on Business Overview, Products Offered, Recent Developments, SWOT Analysis, MnM View Might Not Be Captured in Case of Unlisted Companies.
14.11 Additional Companies
14.11.1 Universal Industrial Gases
14.11.2 Yingde Gases Group Company
14.11.3 Aspen Air Corp.
14.11.4 Ellenbarrie Industrial Gases
14.11.5 Cryotec Anlagenbau GmbH
14.11.6 Bhuruka Gases Limited
14.11.7 Sudanese Liquid Air Company
14.11.8 Cross Country Infrastructure Services Inc
14.11.9 Canair Nitrogen Inc.
14.11.10 Bombay Oxygen Corporation Ltd
15 Appendix (Page No. - 149)
15.1 Discussion Guide
15.2 Knowledge Store: Marketsandmarkets� Subscription Portal
15.3 Introducing RT: Real-Time Market Intelligence
15.4 Available Customizations
15.5 Related Reports
15.6 Author Details
List of Tables (138 Tables)
Table 1 Industrial Nitrogen Market Size, By Form, 2015�2022 (USD Billion)
Table 2 Industrial Nitrogen Market Size, By Form, 2015�2022 (Billion Cubic Feet)
Table 3 Industrial Nitrogen Market Size, By Technology, 2015�2022 (USD Billion)
Table 4 Industrial Nitrogen Market Size, By Technology, 2015�2022 (Billion Cubic Feet)
Table 5 Industrial Compressed Nitrogen Gas Market Size, By Transportation & Distribution, 2015�2022 (USD Billion)
Table 6 Industrial Compressed Nitrogen Gas Market Size, By Transportation & Distribution, 2015�2022 (Billion Cubic Feet)
Table 7 Industrial Liquid Nitrogen Market Size, By Transportation & Distribution, 2015�2022 (USD Billion)
Table 8 Industrial Liquid Nitrogen Market Size, By Transportation & Distribution, 2015�2022 (Billion Cubic Feet)
Table 9 Industrial Compressed Nitrogen Gas Market Size, By End-Use Industry, 2015�2022 (USD Billion)
Table 10 Industrial Compressed Nitrogen Gas Market Size, By End-Use Industry, 2015�2022 (Billion Cubic Feet)
Table 11 Industrial Liquid Nitrogen Market Size, By End-Use Industry, 2015�2022 (USD Billion)
Table 12 Industrial Liquid Nitrogen Market Size, By End-Use Industry, 2015�2022 (Billion Cubic Feet)
Table 13 Industrial Nitrogen Market Size, By Grade, 2015�2022 (USD Billion)
Table 14 Industrial Nitrogen Market Size, By Grade, 2015�2022 (Billion Cubic Feet)
Table 15 Industrial Nitrogen Market Size, By Region, 2015�2022 (USD Billion)
Table 16 Industrial Nitrogen Market Size, By Region, 2015�2022 (Billion Cubic Feet)
Table 17 North America: Industrial Nitrogen Market Size, By Form, 2015�2022 (USD Billion)
Table 18 North America: Industrial Nitrogen Market Size, By Form, 2015�2022 (Billion Cubic Feet)
Table 19 North America: Industrial Nitrogen Market Size, By Technology, 2015�2022 (USD Billion)
Table 20 North America: Industrial Nitrogen Market Size, By Technology, 2015�2022 (Billion Cubic Feet)
Table 21 North America: Industrial Liquid Nitrogen Market Size, By Transportation & Distribution, 2015�2022 (USD Billion)
Table 22 North America: Industrial Liquid Nitrogen Market Size, By Transportation & Distribution, 2015�2022 (Billion Cubic Feet)
Table 23 North America: Industrial Compressed Nitrogen Gas Market Size, By Transportation & Distribution, 2015�2022 (USD Billion)
Table 24 North America: Industrial Compressed Gas Nitrogen Market Size, By Transportation & Distribution, 2015�2022 (Billion Cubic Feet)
Table 25 North America: Industrial Liquid Nitrogen Market Size, By End-Use Industry, 2015�2022 (USD Billion)
Table 26 North America: Industrial Liquid Nitrogen Market Size, By End-Use Industry, 2015�2022 (Billion Cubic Feet)
Table 27 North America: Industrial Compressed Nitrogen Gas Market Size, By End-Use Industry, 2015�2022 (USD Billion)
Table 28 North America: Industrial Compressed Nitrogen Gas Market Size, By End-Use Industry, 2015�2022 (Billion Cubic Feet)
Table 29 North America: Membrane-Separattion Market Size, By End-Use Industry, 2015�2022 (USD Billion)
Table 30 North America: Membrane-Separation Market Size, By End-Use Industry, 2015�2022 (Billion Cubic Feet)
Table 31 US: Industrial Nitrogen Market Size, By Form, 2015�2022 (USD Billion)
Table 32 US: Industrial Nitrogen Market Size, By Form, 2015�2022 (Billion Cubic Feet)
Table 33 Canada: Industrial Nitrogen Market Size, By Form, 2015�2022 (USD Billion)
Table 34 Canada: Industrial Nitrogen Market Size, By Type, 2015�2022 (Billion Cubic Feet)
Table 35 Mexico: Industrial Nitrogen Market Size, By Form, 2015�2022 (USD Billion)
Table 36 Mexico: Industrial Nitrogen Market Size, By Form, 2015�2022 (Billion Cubic Feet)
Table 37 Europe: Industrial Nitrogen Market Size, By Country, 2015�2022 (USD Billion)
Table 38 Europe: Industrial Nitrogen Market Size, By Country, 2015�2022 (Billion Cubic Feet)
Table 39 Europe: Industrial Nitrogen Market Size, By Form, 2015�2022 (USD Billion)
Table 40 Europe: Industrial Nitrogen Market Size, By Form, 2015�2022 (Billion Cubic Feet)
Table 41 Europe: Industrial Nitrogen Market Size, By Technology, 2015�2022 (USD Billion)
Table 42 Europe: Industrial Nitrogen Market Size, By Technology, 2015�2022 (Billion Cubic Feet)
Table 43 Europe: Industrial Liquid Nitrogen Market Size, By Transportation & Distribution, 2015�2022 (USD Billion)
Table 44 Europe: Industrial Liquid Nitrogen Market Size, By Transportation & Distribution, 2015�2022 (Billion Cubic Feet)
Table 45 Europe: Industrial Compressed Nitrogen Gas Market Size, By Transportation & Distribution, 2015�2022 (USD Billion)
Table 46 Europe: Industrial Compressed Nitrogen Gas Market Size, By Transportation & Distribution, 2015�2022 (Billion Cubic Feet)
Table 47 Europe: Industrial Liquid Nitrogen Market Size, By End-Use Industry, 2015�2022 (USD Billion)
Table 48 Europe: Industrial Liquid Nitrogen Market Size, By End-Use Industry, 2015�2022 (Billion Cubic Feet)
Table 49 Europe: Industrial Compressed Nitrogen Gas Market Size, By End-Use Industry, 2015�2022 (USD Billion)
Table 50 Europe: Industrial Compressed Nitrogen Gas Market Size, By End-Use Industry, 2015�2022 (Billion Cubic Feet)
Table 51 Europe: Membrane Separation Market Size, By End-Use Industry, 2015�2022 (USD Billion)
Table 52 Europe: Membrane Separation Market Size, By End-Use Industry, 2015�2022 (Billion Cubic Feet)
Table 53 UK: Industrial Nitrogen Market Size, By Form, 2015�2022 (USD Billion)
Table 54 UK: Industrial Nitrogen Market Size, By Type, 2015�2022 (Billion Cubic Feet)
Table 55 Italy: Industrial Nitrogen Market Size, By Form, 2015�2022 (USD Billion)
Table 56 Italy: Industrial Nitrogen Market Size, By Form, 2015�2022 (Billion Cubic Feet)
Table 57 Germany: Industrial Nitrogen Market Size, By Form, 2015�2022 (USD Billion)
Table 58 Germany: Industrial Nitrogen Market Size, By Form, 2015�2022 (Billion Cubic Feet)
Table 59 France: Industrial Nitrogen Market Size, By Form, 2015�2022 (USD Billion)
Table 60 France: Industrial Nitrogen Market Size, By Form, 2015�2022 (Billion Cubic Feet)
Table 61 Rest of Europe: Industrial Nitrogen Market Size, By Form, 2015�2022 (USD Billion)
Table 62 Rest of Europe: Industrial Nitrogen Market Size, By Form, 2015�2022 (Billion Cubic Feet)
Table 63 Asia Pacific: Industrial Nitrogen Market Size, By Country/Region, 2015�2022 (USD Billion)
Table 64 Asia Pacific: Industrial Nitrogen Market Size, By Country/Region, 2015�2022 (Billion Cubic Feet)
Table 65 Asia Pacific: Industrial Nitrogen Market Size, By Form, 2015�2022 (USD Billion)
Table 66 Asia Pacific: Industrial Nitrogen Market Size, By Form, 2015�2022 (Billion Cubic Feet)
Table 67 Asia Pacific: Industrial Nitrogen Market Size, By Technology, 2015�2022 (USD Billion)
Table 68 Asia Pacific: Industrial Nitrogen Market Size, By Technology, 2015�2022 (Billion Cubic Feet)
Table 69 Asia Pacific: Industrial Liquid Nitrogen Market Size, By Transportation & Distribution, 2015�2022 (USD Billion)
Table 70 Asia Pacific: Industrial Liquid Nitrogen Market Size, By Transportation & Distribution, 2015�2022 (Billion Cubic Feet)
Table 71 Asia Pacific: Industrial Compressed Nitrogen Gas Market Size, By Transportation & Distribution, 2015�2022 (USD Billion)
Table 72 Asia Pacific: Industrial Compressed Nitrogen Gas Market Size, By Transportation & Distribution, 2015�2022 (Billion Cubic Feet)
Table 73 Asia Pacific: Industrial Liquid Nitrogen Market Size, By End-Use Industry, 2015�2022 (USD Billion)
Table 74 Asia Pacific: Industrial Liquid Nitrogen Market Size, By End-Use Industry2015�2022 (Billion Cubic Feet)
Table 75 Asia Pacific: Industrial Compressed Nitrogen Gas Market Size, By End-Use Industry, 2015�2022 (USD Billion)
Table 76 Asia Pacific: Industrial Compressed Nitrogen Gas Market Size, By End-Use Industry, 2015�2022 (Billion Cubic Feet)
Table 77 Asia Pacific: Membrane Separation Market Size, By End-Use Industry, 2015�2022 (USD Billion)
Table 78 Asia Pacific: Membrane Separation Market Size, By End-Use Industry, 2015�2022 (Billion Cubic Feet)
Table 79 China: Industrial Nitrogen Market Size, By Form, 2015�2022 (USD Billion)
Table 80 China: Industrial Nitrogen Market Size, By Form, 2015�2022 (Billion Cubic Feet)
Table 81 India: Industrial Nitrogen Market Size, By Form, 2015�2022 (USD Billion)
Table 82 India: Industrial Nitrogen Market Size, By Form, 2015�2022 (Billion Cubic Feet)
Table 83 Japan: Industrial Nitrogen Market Size, By Form, 2015�2022 (USD Billion)
Table 84 Japan: Industrial Nitrogen Market Size, By Form, 2015�2022 (Billion Cubic Feet)
Table 85 Australia: Industrial Nitrogen Market Size, By Form, 2015�2022 (USD Billion)
Table 86 Australia: Industrial Nitrogen Market Size, By Form, 2015�2022 (Billion Cubic Feet)
Table 87 Rest of Asia Pacific: Industrial Nitrogen Market Size, By Form, 2015�2022 (USD Billion)
Table 88 Rest of Asia Pacific: Industrial Nitrogen Market Size, By Form, 2015�2022 (Billion Cubic Feet)
Table 89 Middle East & Africa: Industrial Nitrogen Market Size, By Country, 2015�2022 (USD Billion)
Table 90 Middle East & Africa: Industrial Nitrogen Size, By Country, 2015�2022 (Billion Cubic Feet)
Table 91 Middle East & Africa: Industrial Nitrogen Market Size, By Form, 2015�2022 (USD Billion)
Table 92 Middle East & Africa: Industrial Nitrogen Market Size, By Form, 2015�2022 (Billion Cubic Feet)
Table 93 Middle East & Africa: Industrial Nitrogen Market Size, By Technology, 2015�2022 (USD Billion)
Table 94 Middle East & Africa: Industrial Nitrogen Market Size, By Technology, 2015�2022 (Billion Cubic Feet)
Table 95 Middle East & Africa: Industrial Liquid Nitrogen Market Size, By Transportation & Distribution, 2015�2022 (USD Billion)
Table 96 Middle East & Africa: Industrial Liquid Nitrogen Market Size, By Transportation & Distribution, 2015�2022 (Billion Cubic Feet)
Table 97 Middle East & Africa: Industrial Compressed Nitrogen Gas Market Size, By Transportation & Distribution, 2015�2022 (USD Billion)
Table 98 Middle East & Africa: Industrial Compressed Nitrogen Gas Market Size, By Transportation & Distribution, 2015�2022 (Billion Cubic Feet)
Table 99 Middle East & Africa: Industrial Liquid Nitrogen Market Size, By End-Use Industry, 2015�2022 (USD Billion)
Table 100 Middle East & Africa: Industrial Liquid Nitrogen Market Size, By End-Use Industry, 2015�2022 (Billion Cubic Feet)
Table 101 Middle East & Africa: Industrial Compressed Nitrogen Gas Market Size, By End-Use Industry, 2015�2022 (USD Billion)
Table 102 Middle East & Africa: Industrial Compressed Nitrogen Gas Market Size, By End-Use Industry, 2015�2022 (Billion Cubic Feet)
Table 103 Middle East & Africa: Membrane Separation Market Size, By End-Use Industry, 2015�2022 (USD Billion)
Table 104 Middle East & Africa: Membrane Separation Market Size, By End-Use Industry, 2015�2022 (Billion Cubic Feet)
Table 105 Saudi Arabia: Industrial Nitrogen Market Size, By Form, 2015�2022 (USD Billion)
Table 106 Saudi Arabia: Industrial Nitrogen Market Size, By Form, 2015�2022 (Billion Cubic Feet)
Table 107 South Africa: Industrial Nitrogen Market Size, By Form, 2015�2022 (USD Billion)
Table 108 South Africa: Industrial Nitrogen Market Size, By Form, 2015�2022 (Billion Cubic Feet)
Table 109 Turkey: Industrial Nitrogen Market Size, By Form, 2015�2022 (USD Billion)
Table 110 Turkey: Industrial Nitrogen Market Size, By Form, 2015�2022 (Billion Cubic Feet)
Table 111 Rest of Middle East & Africa: Industrial Nitrogen Market Size, By Form, 2015�2022 (USD Billion)
Table 112 Rest of Middle East & Africa: Industrial Nitrogen Market Size, By Form, 2015�2022 (Billion Cubic Feet)
Table 113 South America: Industrial Nitrogen Market Size, By Country, 2015�2022 (USD Billion)
Table 114 South America: Industrial Nitrogen Market Size, By Country, 2015�2022 (Billion Cubic Feet)
Table 115 South America: Industrial Nitrogen Market Size, By Form, 2015�2022 (USD Billion)
Table 116 South America: Industrial Nitrogen Market Size, By Form, 2015�2022 (Billion Cubic Feet)
Table 117 South America: Industrial Nitrogen Market Size, By Technology, 2015�2022 (USD Billion)
Table 118 South America: Industrial Nitrogen Market Size, By Technology, 2015�2022 (Billion Cubic Feet)
Table 119 South America: Industrial Liquid Nitrogen Market Size, By Transportation & Distribution, 2015�2022 (USD Billion)
Table 120 South America: Industrial Liquid Nitrogen Market Size, By Transportation & Distribution, 2015�2022 (Billion Cubic Feet)
Table 121 South America: Industrial Compressed Nitrogen Gas Market Size, By Transportation & Distribution, 2015�2022 (USD Billion)
Table 122 South America: Industrial Compressed Nitrogen Gas Market Size, By Transportation & Distribution, 2015�2022 (Billion Cubic Feet)
Table 123 South America: Industrial Liquid Nitrogen Market Size, By End-Use Industry, 2015�2022 (USD Billion)
Table 124 South America: Industrial Liquid Nitrogen Market Size, By End-Use Industry, 2015�2022 (Billion Cubic Feet)
Table 125 South America: Industrial Compressed Nitrogen Gas Market Size, By End-Use Industry, 2015�2022 (USD Billion)
Table 126 South America: Industrial Compressed Nitrogen Gas Market Size, By End-Use Industry, 2015�2022 (Billion Cubic Feet)
Table 127 South America: Membrane-Separation Market Size, By End-Use Industry, 2015�2022 (USD Billion)
Table 128 South America: Membrane-Separation Market Size, By End-Use Industry, 2015�2022 (Billion Cubic Feet)
Table 129 Brazil: Industrial Nitrogen Market Size, By Form, 2015�2022 (USD Billion)
Table 130 Brazil: Industrial Nitrogen Market Size, By Form, 2015�2022 (Billion Cubic Feet)
Table 131 Argentina: Industrial Nitrogen Market Size, By Form, 2015�2022 (USD Billion)
Table 132 Argentina: Industrial Nitrogen Market Size, By Form, 2015�2022 (Billion Cubic Feet)
Table 133 Rest of South America: Industrial Nitrogen Market Size, By Form, 2015�2022 (USD Billion)
Table 134 Rest of South America: Industrial Nitrogen Market Size, By Form, 2015�2022 (Billion Cubic Feet)
Table 135 Expansions & Investments, 2016�2017
Table 136 Mergers & Acquisitions, 2014�2017
Table 137 Agreements & Joint Ventures, 2017
Table 138 Agreements/Joint Ventures
List of Figures (32 Figures)
Figure 1 Industrial Nitrogen Market Segmentation
Figure 2 Industrial Nitrogen Market, By Region
Figure 3 Industrial Nitrogen Market: Research Design
Figure 4 Breakdown of Primaries
Figure 5 Market Size Estimation Methodology: Bottom-Up Approach
Figure 6 Market Size Estimation Methodology: Top-Down Approach
Figure 7 Industrial Nitrogen Market: Data Triangulation
Figure 8 Industrial Nitrogen Gas Market Size, By Form, 2017 vs 2022
Figure 9 Industrial Nitrogen Market Size, By Technology, 2017 vs 2022
Figure 10 Food & Beverage Industry to Dominate the Market in Terms of Liquid Nitrogen Through 2022
Figure 11 Metal Manufacturing & Fabrication Industry to Dominate the Market in Terms of Compressed Nitrogen Gas
Figure 12 Asia Pacific to Be the Fastest-Growing Market for Industrial Nitrogen From 2017 to 2022
Figure 13 Emerging Economies Offer Attractive Opportunities in the Industrial Nitrogen Market
Figure 14 Cryogenic Fraction Distillation Held the Largest Share of the Emerging Asia Pacific Market in 2017
Figure 15 Country-Wise Growth Potential of the Industrial Nitrogen Market, 2017-2022
Figure 16 Liquid Industrial Nitrogen Market, By End-Use Industry, 2016
Figure 17 Compressed Nitrogen Gas Market, By End-Use Industry, 2022
Figure 18 Industrial Nitrogen Market Size, By Technology, 2017�2022
Figure 19 Industrial Nitrogen Market Dynamics
Figure 20 Healthcare Expenditure & Financing
Figure 21 Porter�s Five Forces Analysis
Figure 22 Compressed Gas Segment to Grow at A Higher CAGR From 2017 to 2022
Figure 23 High Purity Segment to Grow at A Higher Rate From 2017 to 2022
Figure 24 Markets in China & India to Register High CAGRs, 2017�2022
Figure 25 Asia Pacific Industrial Nitrogen Market Snapshot
Figure 26 The Linde Group: Company Snapshot
Figure 27 Praxair: Company Snapshot
Figure 28 Air Liquide: Company Snapshot
Figure 29 Air Products and Chemicals: Company Snapshot
Figure 30 Messer Group: Company Snapshot
Figure 31 Southern Industrial Gas Berhad: Company Snapshot
Figure 32 Taiyo Nippon Sanso Corporation: Company Snapshot


Growth opportunities and latent adjacency in Industrial Nitrogen Market