Imaging Chemicals Market by Product Type (Printing Inks, Image Developers), Application (Printing & Packaging, Medical Diagnostics, Textile Processing), and Region (North America, Europe, APAC, MEA, and South America) - Global Forecast to 2022


[125 Pages Report] Imaging chemicals are chemicals substances that used for producing or developing images. Based on the product type, these imaging chemicals are categorized as printing inks, image developers, and other imaging chemicals. Printing inks are the most commonly used imaging chemicals globally. Printing inks are used in conventional printing technologies such as offset, gravure, and screen printing, as well as in digital printing technologies in the form of inkjets and toner cartridges. These are used in applications such as printing & packaging, textile processing, and medical diagnostics, among others.
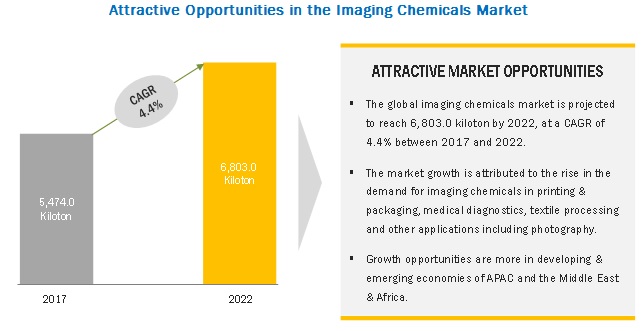
The market size for imaging chemicals was USD 20.77 billion in 2016 and is projected to reach USD 29.97 billion by 2022, at a CAGR of 6.3% between 2017 and 2022. The global imaging chemicals market is projected to reach 6,803 kiloton by 2022, at a CAGR of 4.4% between 2017 and 2022. APAC accounted for the largest share of the imaging chemicals market globally.
�Printing inks is expected to be the largest product type segment in imaging chemicals market during the forecast period.�
Printing inks accounted for the largest share of the imaging chemicals market, globally. Printing inks are used for both analog and digital printing processes. Conventional printing technology is expected to dominate, which is expected to drive the market for printing inks. The market share of digital printing is expected to increase during the forecast period, which is expected to drive the demand for imaging chemicals during the forecast period.
The growth in the demand for imaging chemicals in this application segment is attributed to the increase in the packaging printing, and the shift of printing technology towards digital printing is expected to boost the market demand for imaging chemicals in this application segment.
�APAC is projected to be the fastest-growing market during the forecast period.�
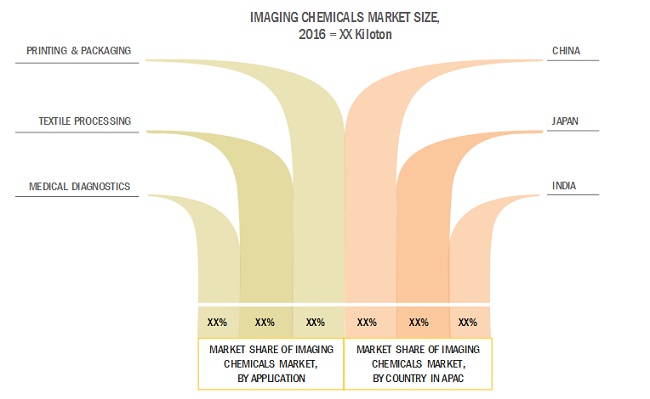
APAC is projected to be the fastest-growing market, in terms of value, between 2017 and 2022. The printing & packaging application segment is the largest application of imaging chemicals in APAC. The textile processing application is projected to be the fastest-growing application for imaging chemicals in APAC. Increasing exports and a rise in domestic consumption of textiles is expected to drive the market demand for textile printing in the region. Emerging markets, such as China, India, and Thailand, among other countries, are the major growth drivers of the APAC market.
Market Dynamics
Driver: Technological shift towards digital and on-demand printing
Owing to faster turnaround time, high quality, lower printing cost for smaller quantities of printing and easily customized printing, digital printing is widely adopted globally. Though the conventional printing process accounts for the largest printing technology, digital printing is expected to take away significant market share from conventional printing technology during the forecast period. This is expected to boost the growth of printing inks used in toners and ink cartridges during the forecast period. However, the conventional printing technology is expected to be in use for large volume printing applications such as newspaper and magazine printing owing to its low cost per print (for large volumes) and reliability for repetitive printing.
Restraint:Digitization hampering the growth of imaging chemicals
An increasing trend of digitization has resulted in the sluggish growth of the imaging chemicals. Electronic storage devices are fast replacing printed archives. E-newspapers, e-media, e-commerce, and e-advertising have drastically reduced the use of print media. This has impacted the usage of imaging chemicals in the application areas.
Opportunity:Return of film-based imaging
Digital imaging is fast replacing conventional film-based photography. Digital imaging offers several advantages over film-based photography such as faster turnaround time, faster developing process, and better color contrast. However, the demand for film-based photography is expected to grow, driven by the increased usage of photographic films by professional photographers. Kodak, a leading photographic film manufacturer, has relaunched its film product KODAK EKTACHROME, which used for photography and motion picture applications. Photographic film sales in leading photographic film manufacturing companies such as Kodak, Fujifilm, and Harman Technology has increased over the past 2-3 years. This return to growth of film-based photography is expected to drive the demand for developers, stop bath solutions, fixers, and other chemicals used for photographic film development.
Challenge: Higher cost of image printing and developing process compared to digital media
One of the shortcomings of the imaging chemicals is the higher cost involved in printing or developing images. Photographic film development makes use of developers, stop bath solutions and fixer along with other chemicals to produce the image which is expensive. The image developing requires a dark room to process these films. Also, the developing process is tedious and time-consuming, which adds to the cost. Furthermore, digital printing requires expensive printing inks such as inks, which are used to print x-rays, MRI-scans, and CT scans. The cost incurred is much higher compared to digital media storage. The rising raw material and energy costs are one of the major challenges faced by the imaging chemicals market.
Scope of the Report
|
Report Metric |
Details |
|
Market size available for years |
2015�2022 |
|
Base year considered |
2016 |
|
Forecast period |
2017�2022 |
|
Forecast units |
USD million and kiloton |
|
Segments covered |
Product Type, Application, and Region. |
|
Geographies covered |
North America, Europe, APAC, South America, the Middle East & Africa |
|
Companies covered |
Fujifilm (Japan), The Eastman Kodak Company (US), Vivimed Labs (India), DIC Corp. (Japan), Flint Group (Germany), Sakata Inx (Japan), Toyo Ink SC (Japan), Siegwerk Druckfarben (Germany), T&K Toka (Japan) |
This research report categorizes the imaging chemicals market on the basis of product type, application, and region.
Imaging chemicals market, by Product Type:- Printing Inks
- Image Developers
- Others
Imaging chemicals market, by Application:
- Printing & Packaging
- Medical Diagnostics
- Textile Processing
- Others
Imaging chemicals market, by Region:
- North America
- Europe
- Asia Pacific
- South America
- Middle East & Africa
Key Market Players
Flint Group (Germany), Sakata Inx (Japan), DIC Corp. (Japan), Siegwerk Druckfarben (Germany), Fujifilm (Japan)
Recent Developments
- In 2018, Eastman Kodak Company relaunched EKTACHROME Film and plans to cater to motion pictures and still photography applications. The product provides extremely fine grain, clean colors, great tones, and contrasts.
- In December 2017, DIC and Nanosys (US) announced a collaboration in the development of Inks for use in the production of Inkjet-Printed quantum dot color filters for displays. This development has helped DIC to strengthen its marketing.
- In October 2017, Kodak and Pinewood signed a long-term collaboration on Kodak�s new film processing lab, Kodak Film Lab London. This film processing facility will consume imaging chemicals for the image developing process and hence will bolster the imaging chemicals market.
- In September 2017, Sun Chemical, a subsidiary of DIC Corporation, acquired Joules Angstrom U.V. Printing Inks Corporation (US). This acquisition helped both companies with numerous opportunities to provide customers with expanded product lines and services.
- In May 2017, DIC Corporation established a new manufacturing plant in Chiba, Japan, for small modules in the SEPAREL series of hollow-fiber membrane modules. These are used in the degassing of inks for industrial inkjet printers. The new facility is expected to strengthen DIC�s production volume and revenue in the new region.
Critical questions the report answers:
- What are the upcoming trends for the imaging chemicals market?
- Which segment in the imaging chemicals market provides the most opportunity for growth?
- Who are the leading vendors operating in the market?
- What are the opportunities for new market entrants in the imaging chemicals market?
To speak to our analyst for a discussion on the above findings, click Speak to Analyst
 Exclusive indicates content/data unique to MarketsandMarkets and not available with any competitors.
Table of Contents
1 Introduction (Page No. - 13)
1.1 Objectives of the Study
1.2 Market Definition
1.3 Market Scope
1.3.1 By Region and Key Countries
1.4 Years Considered for the Study
1.5 Currency and Pricing
1.6 Package Size
1.7 Limitations
1.8 Stakeholders
2 Research Methodology (Page No. - 17)
2.1 Research Data
2.1.1 Secondary Data
2.1.1.1 Key Data From Secondary Sources
2.1.2 Primary Data
2.1.2.1 Key Data From Primary Sources
2.1.2.2 Key Industry Insights
2.1.2.3 Breakdown of Primary Interviews
2.2 Market Size Estimation
2.2.1 Bottom-Up Approach
2.2.2 Top-Down Approach
2.3 Data Triangulation
2.4 Research Assumptions
3 Executive Summary (Page No. - 25)
4 Premium Insights (Page No. - 28)
4.1 Significant Opportunities in the Imaging Chemicals Market
4.2 Imaging Chemicals Market, By Application
4.3 Imaging Chemicals Market, By Application and Country-Wise, in APAC
4.4 Imaging Chemicals Market, By Application
5 Market Overview (Page No. - 30)
5.1 Introduction
5.2 Market Dynamics
5.2.1 Drivers
5.2.1.1 Growth of the Application Areas of Imaging Chemicals
5.2.1.2 Technological Shift Towards Digital and On-Demand Printing
5.2.2 Restraints
5.2.2.1 Digitization Hampering the Growth of Imaging Chemicals
5.2.2.2 Environmental Regulations Related to Imaging Chemicals
5.2.3 Opportunities
5.2.3.1 Return of Film-Based Imaging
5.2.4 Challenges
5.2.4.1 Higher Cost of Image Printing and Developing Process Compared to Digital Media
5.3 Porter�s Five Forces Analysis
5.3.1 Threat of New Entrants
5.3.2 Threat of Substitutes
5.3.3 Bargaining Power of Buyers
5.3.4 Bargaining Power of Suppliers
5.3.5 Intensity of Competitive Rivalry
5.4 Macroeconomic Overview and Key Drivers
5.4.1 Introduction
5.4.2 Medical Diagnostic Imaging
5.4.3 Packaging Printing Trends
6 Imaging Chemicals Market, By Product Type (Page No. - 37)
6.1 Introduction
6.2 Printing Inks
6.2.1 Binders
6.2.2 Carriers
6.2.3 Pigments
6.2.4 Additives
6.3 Image Developers
6.3.1 Hydroquinone
6.3.2 Phenidone
6.3.3 Metol
6.3.4 Other Developers
6.4 Others
7 Imaging Chemicals Market, By Application (Page No. - 43)
7.1 Introduction
7.2 Printing & Packaging
7.3 Medical Diagnostics
7.4 Textile Processing
7.5 Others
8 Imaging Chemicals Market, By Region (Page No. - 50)
8.1 Introduction
8.2 Imaging Chemicals Market, By Region
8.3 APAC
8.3.1 China
8.3.2 Japan
8.3.3 India
8.3.4 South Korea
8.3.5 Thailand
8.3.6 Rest of APAC
8.4 Europe
8.4.1 Germany
8.4.2 France
8.4.3 Italy
8.4.4 UK
8.4.5 Russia
8.4.6 Spain
8.4.7 Rest of Europe
8.5 North America
8.5.1 US
8.5.2 Canada
8.5.3 Mexico
8.6 Middle East & Africa
8.6.1 Saudi Arabia
8.6.2 South Africa
8.6.3 Rest of the Middle East & Africa
8.7 South America
8.7.1 Brazil
8.7.2 Argentina
8.7.3 Rest of South America
9 Competitive Landscape (Page No. - 87)
9.1 Overview
9.2 Competitive Scenario
9.2.1 Expansions
9.2.2 New Product Developments
9.2.3 Mergers & Acquisitions
10 Company Profile (Page No. - 90)
(Business Overview, Products Offered, Recent Developments, SWOT Analysis, and MnM View)*
10.1 Fujifilm
10.2 The Eastman Kodak Company
10.3 Vivimed Labs
10.4 DIC Corporation
10.5 Flint Group
10.6 Sakata Inx
10.7 Toyo Ink Sc
10.8 Siegwerk Druckfarben
10.9 T&K Toka
10.10 Hubergroup Deutschland
10.11 Key Innovators
10.11.1 Sicpa Holding
10.11.2 Altana
10.11.3 Dainichiseika Color & Chemicals
10.11.4 Agfa-Gevaert Group
10.11.5 Yip�s Chemical Holdings
10.11.6 Wikoff Color Corporation
*Details on Business Overview, Products Offered, Recent Developments, SWOT Analysis, and MnM View Might Not Be Captured in Case of Unlisted Companies.
11 Appendix (Page No. - 116)
11.1 Insights From Industry Experts
11.2 Discussion Guide
11.3 Knowledge Store: Marketsandmarkets� Subscription Portal
11.4 Introducing RT: Real-Time Market Intelligence
11.5 Available Customizations
11.6 Related Reports
11.7 Author Details
List of Tables (99 Tables)
Table 1 Diagnostic Imaging Market, By Region (USD Million)
Table 2 Packaging Printing Market, By Region (USD Billion)
Table 3 Market Size, By Product Type, 2015�2022 (Kiloton)
Table 4 Market Size, By Product Type, 2015�2022 (USD Million)
Table 5 Printing Inks Market Size, By Region, 2015�2022 (Kiloton)
Table 6 Printing Inks Market Size, By Region, 2015�2022 (USD Million)
Table 7 Image Developers Market Size, By Region, 2015�2022 (Kiloton)
Table 8 Image Developers Market Size, By Region, 2015�2022 (USD Million)
Table 9 Other Market Size, By Region, 2015�2022 (Kiloton)
Table 10 Other Market Size, By Region, 2015�2022 (USD Million)
Table 11 Market Size, By Application, 2015�2022 (Kiloton)
Table 12 Market Size, By Application, 2015�2022 (USD Million)
Table 13 Imaging Chemicals in Printing & Packaging, By Region, 2015�2022 (Kiloton)
Table 14 Imaging Chemicals in Printing & Packaging, By Region, 2015�2022 (USD Million)
Table 15 Imaging Chemicals in Medical Diagnostics, By Region, 2015�2022 (Kiloton)
Table 16 Imaging Chemicals in Medical Diagnostics, By Region, 2015�2022 (USD Million)
Table 17 Imaging Chemicals in Textile Processing, By Region, 2015�2022 (Kiloton)
Table 18 Imaging Chemicals in Textile Processing, By Region, 2015�2022 (USD Million)
Table 19 Imaging Chemicals in Other Applications, By Region, 2015�2022 (Kiloton)
Table 20 Imaging Chemicals in Other Applications, By Region, 2015�2022 (USD Million)
Table 21 Market Size, By Region, 2015�2022 (Kiloton)
Table 22 Market Size, By Region, 2015�2022 (USD Million)
Table 23 APAC Market Size, By Country, 2015�2022 (Kiloton)
Table 24 APAC Market Size, By Country, 2015�2022 (USD Million)
Table 25 APAC Market Size, By Product Type, 2015�2022 (Kiloton)
Table 26 APAC Market Size, By Product Type, 2015�2022 (USD Million)
Table 27 APAC Market Size, By Application, 2015�2022 (Kiloton)
Table 28 APAC Market Size, By Application, 2015�2022 (USD Million)
Table 29 China: Market Size, By Application, 2015�2022 (Kiloton)
Table 30 China: Market Size, By Application, 2015�2022 (USD Million)
Table 31 Japan: Market Size, By Application, 2015�2022 (Kiloton)
Table 32 Japan: Market Size, By Application, 2015�2022 (USD Million)
Table 33 India: Market Size, By Application, 2015�2022 (Kiloton)
Table 34 India: Market Size, By Application, 2015�2022 (USD Million)
Table 35 South Korea: Market Size, By Application, 2015�2022 (Kiloton)
Table 36 South Korea: Market Size, By Application, 2015�2022 (USD Million)
Table 37 Thailand: Market Size, By Application, 2015�2022 (Kiloton)
Table 38 Thailand: Market Size, By Application, 2015�2022 (USD Million)
Table 39 Rest of APAC: Market Size, By Application, 2015�2022 (Kiloton)
Table 40 Rest of APAC: Market Size, By Application, 2015�2022 (USD Million)
Table 41 Europe Market Size, By Country, 2015�2022 (Kiloton)
Table 42 Europe Market Size, By Country, 2015�2022 (USD Million)
Table 43 Europe Market Size, By Product Type, 2015�2022 (Kiloton)
Table 44 Europe Market Size, By Product Type, 2015�2022 (USD Million)
Table 45 Europe Market Size, By Application, 2015�2022 (Kiloton)
Table 46 Europe Market Size, By Application, 2015�2022 (USD Million)
Table 47 Germany: Market Size, By Application, 2015�2022 (Kiloton)
Table 48 Germany: Market Size, By Application, 2015�2022 (USD Million)
Table 49 France: Market Size, By Application, 2015�2022 (Kiloton)
Table 50 France: Market Size, By Application, 2015�2022 (USD Million)
Table 51 Italy: Market Size, By Application, 2015�2022 (Kiloton)
Table 52 Italy: Market Size, By Application, 2015�2022 (USD Million)
Table 53 UK: Market Size, By Application, 2015�2022 (Kiloton)
Table 54 UK: Market Size, By Application, 2015�2022 (USD Million)
Table 55 Russia: Market Size, By Application, 2015�2022 (Kiloton)
Table 56 Russia: Market Size, By Application, 2015�2022 (USD Million)
Table 57 Spain: Market Size, By Application, 2015�2022 (Kiloton)
Table 58 Spain: Market Size, By Application, 2015�2022 (USD Million)
Table 59 Rest of Europe: Market Size, By Application, 2015�2022 (Kiloton)
Table 60 Rest of Europe: Market Size, By Application, 2015�2022 (USD Million)
Table 61 North America Market Size, By Country, 2015�2022 (Kiloton)
Table 62 North America Market Size, By Country, 2015�2022 (USD Million)
Table 63 North America Market Size, By Product Type, 2015�2022 (Kiloton)
Table 64 North America Market Size, By Product Type, 2015�2022 (USD Million)
Table 65 North America Market Size, By Application, 2015�2022 (Kiloton)
Table 66 North America Market Size, By Application, 2015�2022 (USD Million)
Table 67 US Market Size, By Application, 2015�2022 (Kiloton)
Table 68 US Market Size, By Application, 2015�2022 (USD Million)
Table 69 Canada: Market Size, By Application, 2015�2022 (Kiloton)
Table 70 Canada Market Size, By Application, 2015�2022 (USD Million)
Table 71 Mexico Market Size, By Application, 2015�2022 (Kiloton)
Table 72 Mexico Market Size, By Application, 2015�2022 (USD Million)
Table 73 Middle East & Africa: Market Size, By Country, 2015�2022 (Kiloton)
Table 74 Middle East & Africa: Market Size, By Country, 2015�2022 (USD Million)
Table 75 Middle East & Africa Market Size, By Product Type, 2015�2022 (Kiloton)
Table 76 Middle East & Africa: Market Size, By Product Type, 2015�2022 (USD Million)
Table 77 Middle East & Africa Market Size, By Application, 2015�2022 (Kiloton)
Table 78 Middle East & Africa: Market Size, By Application, 2015�2022 (USD Million)
Table 79 Saudi Arabia: Market Size, By Application, 2015�2022 (Kiloton)
Table 80 Saudi Arabia: Market Size, By Application, 2015�2022 (USD Million)
Table 81 South Africa: Market Size, By Application, 2015�2022 (Kiloton)
Table 82 South Africa: Market Size, By Application, 2015�2022 (USD Million)
Table 83 Rest of Middle East & Africa: Market Size, By Application, 2015�2022 (Kiloton)
Table 84 Rest of Middle East & Africa: Market Size, By Application, 2015�2022 (USD Million)
Table 85 South America: Market Size, By Country, 2015�2022 (Kiloton)
Table 86 South America: Market Size, By Country, 2015�2022 (USD Million)
Table 87 South America Market Size, By Product Type, 2015�2022 (Kiloton)
Table 88 South America Market Size, By Product Type, 2015�2022 (USD Million)
Table 89 South America Market Size, By Application, 2015�2022 (Kiloton)
Table 90 South America Market Size, By Application, 2015�2022 (USD Million)
Table 91 Brazil: Market Size, By Application, 2015�2022 (Kiloton)
Table 92 Brazil: Market Size, By Application, 2015�2022 (USD Million)
Table 93 Argentina: Market Size, By Application, 2015�2022 (Kiloton)
Table 94 Argentina: Market Size, By Application, 2015�2022 (USD Million)
Table 95 Rest of South America: Market Size, By Application, 2015�2022 (Kiloton)
Table 96 Rest of South America: Market Size, By Application, 2015�2022 (USD Million)
Table 97 Expansions, 2013-2017
Table 98 New Product Developments, 2013�2017
Table 99 Mergers & Acquisitions, 2013�2017
List of Figures (27 Figures)
Figure 1 Imaging Chemicals: Market Segmentation
Figure 2 Imaging Chemicals Market: Research Design
Figure 3 Market Size Estimation: Bottom-Up Approach
Figure 4 Market Size Estimation: Top-Down Approach
Figure 5 Imaging Chemicals Market: Data Triangulation
Figure 6 Printing Inks Expected to Be the Largest Product Type Segment in Market During the Forecast Period
Figure 7 Printing & Packaging to Be the Largest Application Segment of the Market Between 2017 and 2022
Figure 8 APAC Accounted for the Largest Share of Market
Figure 9 APAC to Offer Lucrative Growth Opportunities to Industry Players Between 2017 and 2022
Figure 10 Printing Inks to Be the Fastest-Growing Product Type in Market During the Forecast Period
Figure 11 Printing & Packaging to Be the Largest Application in the APAC Market
Figure 12 Printing & Packaging to Account for the Largest Market Share During the Forecast Period
Figure 13 Factors Governing Imaging Chemicals Market
Figure 14 Porter�s Five Forces Analysis of the Imaging Chemicals Market
Figure 15 Printing Inks to Be Largest Product Type of the Market Between 2017 and 2022
Figure 16 Printing & Packaging to Be the Largest Consumer of Market Between 2017 and 2022
Figure 17 India Expected to Experience Fastest Growth During Forecast Period
Figure 18 Growing Packaging and Textile Industry to Drive APAC Market
Figure 19 Imaging Chemicals Market in Europe
Figure 20 US Dominates Imaging Chemicals Market in North America
Figure 21 Companies Adopted New Product Development as Key Growth Strategy Between 2013 and 2017
Figure 22 Fujifilm: Company Snapshot
Figure 23 The Eastman Kodak Company: Company Snapshot
Figure 24 Vivimed Labs: Company Snapshot
Figure 25 DIC Corporation Company: Company Snapshot
Figure 26 Sakata Inx: Company Snapshot
Figure 27 Toyo Ink SC: Company Snapshot


Growth opportunities and latent adjacency in Imaging Chemicals Market