IGBT & Thyristor Market by Packaging Type (IGBT Discrete, IGBT Module), Power Rating (Medium Power IGBT, High Power IGBT), Voltage (Below 400V, 600-650V), Application (Power Transmission Systems, Motor Drives), and Region - Global Forecast to 2025


IGBT & Thyristor Market
IGBT & Thyristor Market and Top Companies
- Infineon Technologies AG (Germany) −Infineon Technologies AG is one of the global leaders providing semiconductor solutions for applications including automotive, communication, consumer, industrial, security, and solutions. The company offers IGBT discrete, IGBT modules, IGBT stacks, IGBT bare dies, and thyristors for varieties of applications in the field of automotive, traction, industrial, and consumer systems.
- Fuji Electric Co., Ltd. (Japan) − Fuji Electric Co., Ltd. is a major provider of technologies in the fields of industrial and social infrastructure. The company’s product portfolio consists of drivers and inverters, semiconductors and devices, power supply systems, sensors and measurement instruments, factory automation systems, and social infrastructure systems. The company offers IGBTs that can be deployed in applications such as inverters, wind turbines, welding machines, power supply switching circuits, rail traction systems, solar inverters, automobiles, and UPS.
- ON Semiconductor (US) − ON Semiconductor is a major supplier of semiconductor-based solutions. The company’s product portfolio consists of amplifiers and comparators, connectivity solutions, isolation and protection devices, power management systems, discrete and drivers, and sensors. IGBTs offered by the company find applications in solar inverters, UPS, welding machines, and switched-mode power supplies (SMPS).
- Mitsubishi Electric Corporation (Japan) − Mitsubishi Electric Corporation manufactures and sells electric and electronic components. The company’s product portfolio comprises air-conditioning systems, home products, factory automation systems, automotive equipment, semiconductor devices, and space systems. The company also manufactures both IGBTs and thyristors that can be deployed in welding machines, DC motor controllers, static switches, electric furnace temperature control systems, light dimmers, solar inverters, and inverters.
- STMicroelectronics (Switzerland) – STMicroelectronics is one of the leading providers of semiconductor solutions that can be primarily deployed in many applications, including smart driving, smart industry, smart home & city, and smart things. IGBTs offered by the company are used in a wide range of applications, such as home appliances, solar cells, UPS, industrial motor controllers, automotive traction inverters, and induction heating equipment.
- Renesas Electronics Corporation (Japan) – Renesas Electronics Corporation delivers semiconductor solutions for automotive, industrial, IoT, and human–machine interface applications. The company offers both IGBTs and thyristors that can be installed in motors, solar cells, UPS, welding machines, and power factor controllers (PFCs).
- Vishay Intertechnology (US) – Vishay Intertechnology provides components for macroeconomic growth drivers such as connectivity, mobility, and sustainability. The company’s portfolio mainly consists of semiconductor components such as dies and wafers, diodes, rectifiers, thyristors, ICs, optoelectronics, and power modules, and passive components including capacitors, magnetics, sensors, and resistors. Vishay offers both IGBTs and thyristors for applications in UPS, industrial welding, motor drivers, and more.
IGBT Market and Top Applications
- Electric Vehicles and Hybrid Electric Vehicles − In electric vehicles and hybrid electric vehicles (EVs/HEVs), IGBTs are replacing MOSFET s for high-current applications. Electric power conversion systems in EV/HEV use IGBT modules as mail switching devices. IGBTs are used in EV/HEV for applications such as on-board charging, power factor correction (PFC), and DC/DC and DC/AC conversion. IGBTs offer high reliability and reduced power losses in automotive applications.
- Motor Drives − Motor drives are one of the major applications of IGBTs. Major motor manufacturers rely on IGBTs instead of MOSFETs as they boost power density because of their high-speed switching capability. IGBT offers several advantages for motor drive applications to ensure built-in protection from power fluctuations, maximized efficiency, high reliability, and lower power loss.
- Power Transmission Systems − Drive current of IGBTs is practically zero, which is required for high-speed switching applications in power transmission systems. Lower ON resistance, high voltage capacity, and fast-switching speed of IGBTs make them suitable for power transmission applications such as electrical transmission systems, voltage source converters (VSC), high-voltage direct current (HVDC) systems, and flexible alternating current transmission systems (FACTS).
- Consumer Electronics − Discrete IGBTs are used in consumer electronics such as air conditioners, washing machines, televisions, laptops, personal computers, refrigerators, and induction cookers owing to their low cost and ability to work on lower power currents. IGBTs protect consumer electronics from the high current surge.
- Renewable Energy − Renewable energy relies on natural resources instead of fossil fuels, which makes it less harmful for the environment. It uses resources such as wind, solar, hydroelectric, geothermal, ocean, hydrogen, and biomass for power generation. IGBTs are suitable for high-scale renewable projects. For instance, solar inverters convert DC from solar array panels to AC and employ IGBT for reducing power loss and stability.
Thyristor Market and Top Applications
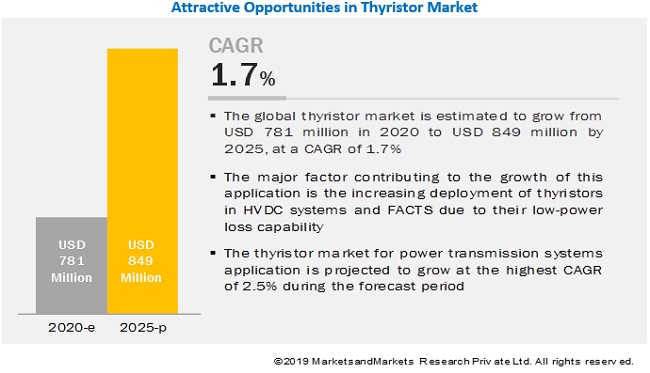
- Power Transmission Systems− HVDC systems and FACTS are among a few of the most effective ways of power transmission. Both HDVC systems and FACTS are used to transmit high-voltage DC and AC and use power electronic converters for power conversion. Thyristors are key components of converter systems; hence, the performance of converter systems highly depends on thyristors.
- Light Dimmers − Over the years, light dimmers are increasingly being adopted in commercial and residential spaces. Light dimmers save electricity by controlling the flow of electricity to the light source. The growing use of smart bulbs in smart buildings and smart homes has raised the demand for light dimmers across the world.
- Motor Controllers − Thyristors’ ability to handle huge amounts of current makes them suitable for motor control applications. Electric motors find a wide range of applications and operate on a few watts to thousands of watts. Thyristors can be deployed in both DC and AC motors used in a range of industrial applications with different speed drives.
- Pressure Control Systems − The pressure is the key factor for creating desirable conditions for several industrial processes such as boiling, chemical reaction, distillation, extrusion, vacuuming, and air conditioning. Pressure control systems are used to control the pressure during the specific process.
- Liquid-level Regulators −A liquid-level regulator or a liquid-level controller is used to controlling the level of liquid in a container. The liquid-level regulator turns on or off when the liquid reaches a certain level. Thyristors with turn-on and turn-off capabilities are used in these devices to control the flow of current.
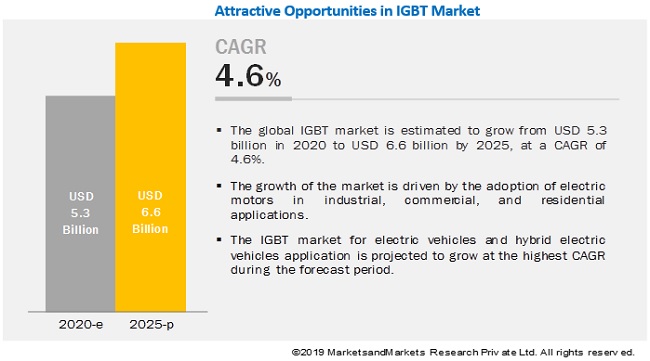
The global IGBT market size is estimated to grow from USD 5.3 billion in 2020 to USD 6.6 billion by 2025, at a CAGR of 4.6%. On the other hand, the global thyristor market size is estimated to grow from USD 781 million in 2020 to USD 849 million by 2025; at a CAGR of 1.7%. Key factors fueling the growth of these markets are government initiatives undertaken in various countries toward the replacement of aging power infrastructure and the adoption of electric motors in industrial, commercial, and residual applications.
IGBT module packaging type segment accounted for a large market share in 2019
The growth of the IGBT module packaging market can be attributed to the increasing adoption of electric and hybrid electric vehicles all over the world. IGBT modules are suitable for high-power applications, such as EVs/HEVs. Countries such as Germany, the US, China, and Belgium have contributed significantly to the global sales of EVs/HEVs. Moreover, governments across the globe are taking initiatives to promote the use of HVDC systems for long-distance power transmission is fueling the demand for IGBT modules. These factors are expected to fuel the growth of the segment during the projected period.
Medium power rating segment accounted for the largest share of the IGBT industry in 2019
The market for medium power rating accounted for the majority of the global IGBT market share in 2019. This growth is attributed to the ability of medium-power IGBTs to meet the increasing requirements for high-voltage direct current (HVDC) systems, flexible alternate current transmission systems (FACTS), and electric vehicles and hybrid electric vehicles (EVs/HEVs). Increasing environmental concerns and government initiatives to reduce carbon emissions have surged the demand for EVs/HEVs, thereby leading to the growing demand for medium-power IGBTs
The IGBT market for electric vehicles and hybrid electric vehicles is expected to grow at the highest CAGR during the forecast period
The market for electric vehicles and hybrid electric vehicles is expected to grow at the highest CAGR during the forecast period owing to the increasing demand for EVs/HEVs due to their energy-efficiency, environmental friendliness, and affordability. Moreover, initiatives taken by the governments of developing countries to minimize CO2 emissions is likely to further drive the demand for EVs and HEVs in the near future. For instance, the Indian government offers a subsidy of USD 1.4 billion to support the domestic electric vehicle industry, which, in turn, would provide lucrative growth opportunities to IGBT manufacturers.
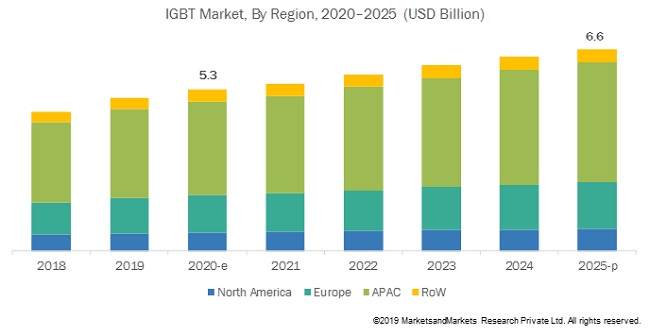
APAC IGBT market expected to grow at the highest CAGR during the forecast period
The market in this region has been studied for China, Japan, South, Korea, India, and Rest of APAC. The growth of the APAC market can be attributed to the considerable manufacturing capabilities and high wind & solar power generation capabilities of the region.
The presence of countries such as China and India with a high population and sufficient manufacturing capacities has contributed significantly to market growth. Moreover, the flourishing market for EVs/HEVs in countries such as China, Japan, India, and South Korea is expected to drive the market in APAC. China contributes the largest share to the sales of EVs/HEVs, and countries such as India have offered subsidies to support the domestic EV/HEV manufacturers.
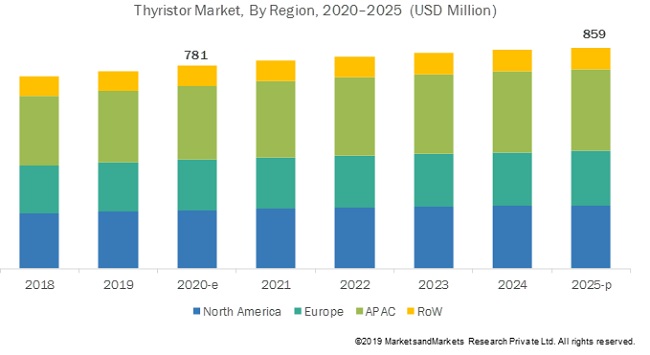
APAC accounted for the largest share of the global thyristor industry in 2019
In 2019, APAC held the largest share of the global thyristor market and is expected to witness the highest CAGR during the forecast period. This growth is attributed to the increasing requirement for more efficient power transmission systems to meet the surging demand for electricity by the ever-increasing population in the region.
Additionally, the region has several HVDC projects. For instance, China has adopted HVDC systems for its high population that requires a substantial power supply. Zhou Shan, Gezhouba – Shanghai, Tian-Guang, and Three Gorges – Changzhou are among a few of the major HVDC projects.
Several IGBT manufacturers and HVDC providers are focusing on deploying their solutions in APAC. For instance, in January 2019, ABB Ltd. (Switzerland) received a contract worth USD 640 million from Power Grid Corporation of India Limited (India), India’s national electricity grid operator. Under this contract, the company is expected to deliver an 800 kilovolt (kV) ultra-high-voltage direct current (UHVDC) transmission link of over 1,800 km, to provide electricity to more than 80 million people.
Key Market Players
Infineon Technologies AG (Germany), Fuji Electric Co., Ltd. (Japan), ON Semiconductor (US), Mitsubishi Electric Corporation (Japan), STMicroelectronics (Switzerland), Renesas Electronics Corporation (Japan), Vishay Intertechnology (US), ABB Ltd (Switzerland), SEMIKRON (Germany), Hitachi, Ltd. (Japan), and Toshiba Corporation (Japan) are a few major companies operating in the global IGBT & thyristor market. These companies have adopted both organic and inorganic growth strategies such as product launches, partnerships, collaborations, contracts, agreements, acquisitions, and expansions to strengthen their position in the market.
Please visit 360Quadrants to see the vendor listing of Top 21 Sustainable Packaging Companies, Worldwide 2023
Scope of the Report:
|
Report Metrics |
Details |
|
Market size available for years |
2017–2025 |
|
Base year |
2019 |
|
Forecast period |
2020–2025 |
|
Forecast unit |
Value (USD million/billion) |
|
Segments covered |
IGBT market by packaging type, power rating, voltage, application, and region |
|
Geographic regions covered |
North America, APAC, Europe, and RoW |
|
Companies covered |
Infineon Technologies AG (Germany), Fuji Electric Co., Ltd. (Japan), ON Semiconductor (US), Mitsubishi Electric Corporation (Japan), STMicroelectronics (Switzerland), Renesas Electronics Corporation (Japan), Vishay Intertechnology (US), ABB Ltd (Switzerland), SEMIKRON (Germany), Hitachi, Ltd. (Japan), and Toshiba Corporation (Japan), ROHM Co., Ltd. (Japan), Danfoss (Denmark), Central Semiconductor Corp. (US), New Jersey Semiconductor (US), Siemens AG (Germany), Schneider Electric (France), Powerex Inc. (US), Silicon Power Corporation (US), StarPower Semiconductor Ltd. (China), and Littelfuse, Inc. (US). |
This report categorizes the IGBT market based on packaging type, power rating, voltage, application, and region and the thyristor market based on application and region.
IGBT Market, By Packaging Type:
- IGBT Discrete
- IGBT Module
IGBT Market, By Power Rating:
- Low
- Medium
- High
IGBT Market, By Voltage:
- <400 V
- 600–650 V
- 1,200–1,700 V
- 2,500–3,300 V
- >4,500 V
IGBT Market, By Application
-
Power Transmission Systems
- HVDC Systems
- FACTS
-
Renewable Energy
- PV Power Generation Systems
- Wind Power Generation Systems
- Rail Traction Systems
- Uninterrupted Power Supply
- Electric Vehicles and Hybrid Electric Vehicles
-
Motor Drives
- Industrial Motors
- Commercial Motors
- Residential Motors
- Consumer Electronics
- Others
Different Classes of Thyristors
- Thyristors with Turn-on Capabilities
- Thyristors with Turn-off Capabilities
- Thyristors with Bidirectional Control
Thyristor Market, By Application:
- Power Transmission Systems
- Motor Controllers
- Light Dimmers
- Pressure Control Systems
- Liquid-level Regulators
- Others
IGBT & Thyristor Market, By Geography:
-
North America
- US
- Canada
- Mexico
-
Europe
- France
- Germany
- UK
- Rest of Europe
-
APAC
- Chain
- Japan
- South Korea
- India
- Rest of APAC
-
RoW
- Middle East & Africa
- South America
Major Market Developments
- In December 2019, ON Semiconductor launched the VE-Tra series of power modules, specially designed for high-voltage automotive traction inverters. These power modules employ smart IGBTs featuring over-temperature protection and over-current protection for faster reaction time.
- In November 2019, STMicroelectronics collaborated with Maxon Motor AG (Switzerland), one of the leading providers of precision motors. The companies will jointly accelerate the development and designing of robotics applications and industrial servo drivers.
- In October 2019, Toshiba Corporation received a contract from the Taiwan Railways Administration (TRA). Under this contract, Toshiba supplied 68 units of electric locomotives to TRA for both passenger and freight trains.
- In August 2019, Fuji Electric Co., Ltd. expanded its lineup of seventh-generation X Series of IGBT modules. New IGBT modules are suitable for largescale wind power generation applications with current ratings ranging from 75 A–1,200 A.
- In June 2019, Infineon Technologies AG acquired Cypress Semiconductor Corporation (US), a microcontroller and connectivity component provider. The acquisition is expected to help Infineon to strengthen and accelerate its growth in the IGBT and thyristor market by tapping potential demands for the Internet of Things (IoT) based devices in the automotive and industrial sectors.
Key Questions Addressed by the Report
- Where will all these developments take the industry in the mid-to-long term?
- What are the upcoming trends in the IGBT & thyristor market?
- What are the opportunities for the existing players, and for those who are planning to enter various stages of the IGBT & thyristor value chain?
- How the adoption of inorganic growth strategies, such as acquisitions and partnerships, will have a positive impact on the growth of the IGBT & thyristor market? Which players are likely to adopt these strategies in the near future to create a position or increase share in this market?
- What are the emerging applications of IGBT & thyristor-based devices?
Frequently Asked Questions (FAQ):
Who are the leading vendors operating in this market?
A few major players in the IGBT and thyristor market include Infineon Technologies AG (Germany), Fuji Electric Co., Ltd. (Japan), ON Semiconductor (US), Mitsubishi Electric Corporation (Japan), STMicroelectronics (Switzerland), Renesas Electronics Corporation (Japan), Vishay Intertechnology (US), ABB Ltd (Switzerland), SEMIKRON (Germany), Hitachi, Ltd. (Japan), and Toshiba Corporation (Japan).
Which are the major applications of IGBTs and thyristors? How huge is the opportunity for their growth in the next five years?
Electric vehicles & hybrid electric vehicles, power transmission systems, and renewable energy are major applications of IGBTs. These are expected to open new revenue pockets for the IGBT market, which will lead to market opportunity of USD 6.6 billion. While power transmission systems, and motor controllers are major applications of thyristors. These are expected to open new revenue pockets for the thyristor market, which will lead to market opportunity of USD 849 million.
What are the drivers and opportunities for the IGBT & thyristor market?
Initiatives of governments across various countries toward the replacement of aging power infrastructure and the adoption of electric motors in industrial, commercial, and residential applications are major factors driving the growth of the IGBT and thyristor market. Increasing adoption of renewable energy sources is expected to act as an opportunity for the manufacturers of IGBT and thyristors.
Which region is expected to witness significant demand for IGBT & thyristor in the coming years?
APAC is the highest growing region for this market. This growth can be attributed to the increasing sales of electric and hybrid electric vehicles in APAC countries. China, Japan, South Korea, and India are the major markets for EVs/HEVs in APAC. Moreover, increasing number of HVDC and FACTS projects in the region has contributed to the growth of this market.
Which are the key strategies adopted by leading companies in the sound reinforcement market?
Product launches were among the key strategies adopted by major players operating in the IGBT and thyristor market. Other strategies adopted by players to grow in the IGBT and thyristor market were partnerships, collaborations, contracts, agreements, acquisitions, and expansions. .
To speak to our analyst for a discussion on the above findings, click Speak to Analyst
 Exclusive indicates content/data unique to MarketsandMarkets and not available with any competitors.
TABLE OF CONTENTS
1 INTRODUCTION (Page No. - 21)
1.1 STUDY OBJECTIVES
1.2 MARKET DEFINITION AND SCOPE
1.2.1 INCLUSIONS AND EXCLUSIONS
1.3 MARKETS COVERED
1.3.1 GEOGRAPHIC SCOPE
1.3.2 YEARS CONSIDERED
1.4 CURRENCY
1.5 LIMITATIONS
1.6 MARKET STAKEHOLDERS
2 RESEARCH METHODOLOGY (Page No. - 27)
2.1 RESEARCH DATA
2.1.1 SECONDARY DATA
2.1.1.1 List of major secondary sources
2.1.1.2 Secondary sources
2.1.2 PRIMARY DATA
2.1.2.1 Breakdown of primaries
2.1.2.2 Key data from primary sources
2.2 MARKET SIZE ESTIMATION
2.2.1 BOTTOM-UP APPROACH FOR IGBT MARKET
2.2.1.1 Approach for capturing market size using bottom-up analysis (demand side)
2.2.2 TOP-DOWN APPROACH FOR IGBT MARKET
2.2.2.1 Approach for capturing market share using top-down analysis (supply side)
2.2.3 BOTTOM-UP APPROACH FOR THYRISTOR MARKET
2.2.3.1 Approach for capturing market size using bottom-up analysis (demand side)
2.2.4 TOP-DOWN APPROACH FOR IGBT MARKET
2.2.4.1 Approach for capturing market share using top-down analysis (supply side)
2.3 MARKET BREAKDOWN AND DATA TRIANGULATION
2.4 RESEARCH ASSUMPTIONS
3 EXECUTIVE SUMMARY (Page No. - 41)
4 PREMIUM INSIGHTS (Page No. - 48)
4.1 ATTRACTIVE GROWTH OPPORTUNITIES IN IGBT MARKET
4.2 ATTRACTIVE GROWTH OPPORTUNITIES IN THYRISTOR MARKET
4.3 IGBT MARKET, BY COUNTRY
4.4 THYRISTOR MARKET, BY REGION
4.5 IGBT MARKET, BY APPLICATION AND REGION
5 MARKET OVERVIEW (Page No. - 51)
5.1 INTRODUCTION
5.2 MARKET DYNAMICS
5.2.1 DRIVERS
5.2.1.1 Initiatives of governments across various countries toward replacement of aging power infrastructure
5.2.1.2 Adoption of electric motors in industrial, commercial, and residential applications
5.2.2 RESTRAINTS
5.2.2.1 High infrastructure development cost and lack of technology awareness
5.2.3 OPPORTUNITIES
5.2.3.1 Increasing adoption of renewable energy sources
5.2.3.2 Growing inclination toward use of electric and hybrid electric vehicles
5.2.4 CHALLENGES
5.2.4.1 Complex structure of firing circuits of IGBTs and thyristors
5.3 VALUE CHAIN ANALYSIS
5.3.1 IGBT AND THYRISTOR VALUE CHAIN
6 IGBT MARKET, BY PACKAGING TYPE (Page No. - 60)
6.1 INTRODUCTION
6.2 IGBT DISCRETE
6.2.1 IGBT DISCRETE OFFERS FAST RESPONSE WITH NO OVERSHOOT
6.3 IGBT MODULE
6.3.1 HIGH DURABILITY AND LOW DOWNTIME TO DRIVE MARKET FOR IGBT MODULE
7 IGBT MARKET, BY POWER RATING (Page No. - 74)
7.1 INTRODUCTION
7.2 LOW
7.2.1 LOW COST AND HIGH FLEXIBILITY TO DRIVE LOW-POWER IGBT MARKET
7.3 MEDIUM
7.3.1 HIGH DEMAND FOR RAIL TRACTION SYSTEMS AND ELECTRIC AND HYBRID ELECTRIC VEHICLES TO SURGE DEMAND FOR MEDIUM-POWER IGBT
7.4 HIGH
7.4.1 INCREASED ADOPTION OF HIGH-POWER IGBT IN RENEWABLE ENERGY AND HVDC APPLICATIONS HAVE POSITIVE IMPACT ON MARKET GROWTH
8 IGBT MARKET, BY VOLTAGE (Page No. - 78)
8.1 INTRODUCTION
8.2 < 400 V
8.2.1 INCREASED DEMAND FOR LESS THAN 400 V IGBT FOR LOW-POWER APPLICATIONS
8.3 600–650 V
8.3.1 INCREASED UTILIZATION OF 600–650 V IGBT DUE TO THEIR CAPABILITY TO HANDLE HIGH CURRENT SURGE AND HIGH CURRENT DENSITY
8.4 1,200–1,700 V
8.4.1 SURGED DEMAND FOR 1,200–1,700 V IGBT AS THEY ELIMINATE REQUIREMENT FOR PARALLELING OF IGBT
8.5 2,500–3,300 V
8.5.1 INCREASED DEPLOYMENT OF 2,500–3,300 V IGBT DUE TO THEIR HIGH THERMAL FATIGUE RESISTANCE
8.6 > 4,500 V
8.6.1 LOW SWITCHING LOSS AND COMPLIANCE WITH ROHS DIRECTIVE DRIVE MARKET FOR IGBTS WITH 4,500 V PROPEL MARKET GROWTH
9 IGBT MARKET, BY APPLICATION (Page No. - 82)
9.1 INTRODUCTION
9.2 POWER TRANSMISSION SYSTEMS
9.2.1 HVDC SYSTEMS
9.2.1.1 High adoption of HVDC systems in long-distance power transmission lines to spur market growth
9.2.2 FACTS
9.2.2.1 Low cost and flexibility of FACTS to accelerate demand of IGBTs
9.3 RENEWABLE ENERGY
9.3.1 PV POWER GENERATION SYSTEMS
9.3.1.1 Increasing number of solar power plants worldwide to augment demand for IGBTs
9.3.2 WIND POWER GENERATION SYSTEMS
9.3.2.1 Growing number of wind farms to propel IGBT market growth
9.4 RAIL TRACTION SYSTEMS
9.4.1 ABILITY OF IGBT TO OPERATE ON HIGH POWER IN ELECTRIC TRAINS FUELING DEMAND FOR IGBT FOR RAIL TRACTION SYSTEMS
9.5 UNINTERRUPTED POWER SUPPLY
9.5.1 DEPLOYMENT OF IGBT FOR SAFEGUARDING UPS AGAINST POWER FLUCTUATIONS FOSTERING GROWTH OF IGBT MARKET
9.6 ELECTRIC VEHICLES AND HYBRID ELECTRIC VEHICLES
9.6.1 INITIATIVES TAKEN BY WORLDWIDE GOVERNMENTS FOR PROMOTING USE OF EV/HEV PROPELLING MARKET GROWTH
9.7 MOTOR DRIVES
9.7.1 INDUSTRIAL MOTORS
9.7.1.1 Use of IGBTs in industrial motors that find applications in food and chemical processing plants boost market growth
9.7.2 COMMERCIAL MOTORS
9.7.2.1 Adoption of IGBTs in commercial motors used in scanners, printers, etc. to propel market growth
9.7.3 RESIDENTIAL MOTORS
9.7.3.1 Low power loss offered by IGBTs enables their utilization in residential motors that are deployed in cameras, washing machines, and so on
9.8 CONSUMER ELECTRONICS
9.8.1 DEPLOYMENT OF DISCRETE IGBTS IN CONSUMER ELECTRONICS TO FUEL THEIR MARKET GROWTH
9.9 OTHERS
10 DIFFERENT CLASSES OF THYRISTORS (Page No. - 98)
10.1 INTRODUCTION
10.2 THYRISTORS WITH TURN-ON CAPABILITY
10.3 THYRISTORS WITH TURN-OFF CAPABILITY
10.4 THYRISTORS WITH BIDIRECTIONAL CONTROL
11 THYRISTOR MARKET, BY APPLICATION (Page No. - 100)
11.1 INTRODUCTION
11.2 POWER TRANSMISSION SYSTEMS
11.2.1 INITIATIVES OF WORLDWIDE GOVERNMENTS WOULD INCREASE DEMAND FOR POWER TRANSMISSION SYSTEMS, THEREBY LEADING TO THYRISTOR MARKET GROWTH
11.3 MOTOR CONTROLLERS
11.3.1 LOW MAINTENANCE AND MINIMIZED LAG TIMES OFFERED BY THYRISTORS PROMOTES THEIR UTILIZATION IN MOTORS CONTROLLERS
11.4 LIGHT DIMMERS
11.4.1 ESCALATED DEMAND FOR THYRISTORS FOR USE IN LIGHT DIMMERS TO SAVE ELECTRICITY BOOST MARKET GROWTH
11.5 PRESSURE CONTROL SYSTEMS
11.5.1 INCREASED USE OF THYRISTORS IN PRESSURE CONTROL SYSTEMS ACCELERATES MARKET GROWTH
11.6 LIQUID-LEVEL REGULATORS
11.6.1 AUGMENTED DEPLOYMENT OF THYRISTORS IN INDUSTRIAL, COMMERCIAL, AND RESIDENTIAL APPLICATIONS FOSTER MARKET GROWTH
11.7 OTHERS
12 GEOGRAPHIC ANALYSIS (Page No. - 109)
12.1 INTRODUCTION
12.2 NORTH AMERICA
12.2.1 US
12.2.1.1 US to continue to command IGBT market in North America during 2020–2025
12.2.2 CANADA
12.2.2.1 Development of new electric and hybrid electric vehicle charging stations to drive Canadian market growth
12.2.3 MEXICO
12.2.3.1 Presence of many solar plants boosting Mexican market growth
12.3 EUROPE
12.3.1 FRANCE
12.3.1.1 High adoption of electric and hybrid electric vehicles to propel French market growth
12.3.2 GERMANY
12.3.2.1 Presence of major IGBT and thyristor manufacturers to fuel market growth in Germany
12.3.3 UK
12.3.3.1 Deployment of wind farms in UK to propel market growth
12.3.4 REST OF EUROPE
12.3.4.1 High sales of electric and hybrid electric vehicles in region is expected to spur market growth
12.4 APAC
12.4.1 CHINA
12.4.1.1 Government initiatives for promoting use of electric and hybrid vehicles surge demand for IGBTs and thyristors in China
12.4.2 JAPAN
12.4.2.1 Highly developed railway network drive market growth in Japan
12.4.3 SOUTH KOREA
12.4.3.1 Development of new HVDC projects to boost demand for IGBTs and thyristors in South Korea
12.4.4 INDIA
12.4.4.1 Replacement of aging transmission lines with HVDC transmission lines to fuel Indian market growth
12.4.5 REST OF APAC
12.4.5.1 Focus on modification of railway networks in RoAPAC to accelerate demand for IGBTs and thyristors
12.5 REST OF THE WORLD
12.5.1 MIDDLE EAST AND AFRICA
12.5.1.1 Presence of world’s biggest solar plants in region contributed significantly to market growth in MEA
12.5.2 SOUTH AMERICA
12.5.2.1 Large number of wind farms in region would fuel South American market growth
13 COMPETITIVE LANDSCAPE (Page No. - 134)
13.1 INTRODUCTION
13.2 MARKET RANKING ANALYSIS, 2019
13.3 COMPETITIVE SCENARIO
13.3.1 PRODUCT LAUNCHES
13.3.2 PARTNERSHIPS, COLLABORATIONS, CONTRACTS, AND AGREEMENTS
13.3.3 ACQUISITIONS
13.3.4 EXPANSIONS
13.4 COMPETITIVE LEADERSHIP MAPPING
13.4.1 VISIONARY LEADERS
13.4.2 DYNAMIC DIFFERENTIATORS
13.4.3 EMERGING COMPANIES
13.5 STRENGTH OF PRODUCT PORTFOLIO
13.6 BUSINESS STRATEGY EXCELLENCE
14 COMPANY PROFILES (Page No. - 144)
(Business Overview, Products Offered, Recent Developments, SWOT Analysis, and MnM View)*
14.1 KEY PLAYERS
14.1.1 INFINEON TECHNOLOGIES AG
14.1.2 FUJI ELECTRIC CO., LTD.
14.1.3 ON SEMICONDUCTOR
14.1.4 MITSUBISHI ELECTRIC CORPORATION
14.1.5 STMICROELECTRONICS
14.1.6 RENESAS ELECTRONICS CORPORATION
14.1.7 VISHAY INTERTECHNOLOGY
14.1.8 ABB LTD
14.1.9 SEMIKRON
14.1.10 HITACHI, LTD.
14.1.11 TOSHIBA CORPORATION
14.2 RIGHT TO WIN
14.3 OTHER KEY PLAYERS
14.3.1 ROHM CO., LTD.
14.3.2 DANFOSS
14.3.3 CENTRAL SEMICONDUCTOR CORP.
14.3.4 NEW JERSEY SEMICONDUCTOR
14.3.5 SIEMENS AG
14.3.6 SCHNEIDER ELECTRIC
14.3.7 POWEREX INC.
14.3.8 SILICON POWER CORPORATION
14.3.9 STARPOWER SEMICONDUCTOR LTD.
14.3.10 LITTELFUSE, INC.
*Details on Business Overview, Products Offered, Recent Developments, SWOT Analysis, and MnM View might not be captured in case of unlisted companies.
15 APPENDIX (Page No. - 177)
15.1 DISCUSSION GUIDE
15.2 KNOWLEDGE STORE: MARKETSANDMARKETS’ SUBSCRIPTION PORTAL
15.3 AVAILABLE CUSTOMIZATIONS
15.4 RELATED REPORTS
15.5 AUTHOR DETAILS
LIST OF TABLES (105 TABLES)
TABLE 1 IGBT MARKET, BY PACKAGING TYPE, 2017–2025 (USD BILLION)
TABLE 2 IGBT DISCRETE MARKET, BY POWER RATING, 2017–2025 (USD MILLION)
TABLE 3 IGBT DISCRETE MARKET, BY APPLICATION, 2017–2025 (USD MILLION)
TABLE 4 IGBT DISCRETE MARKET FOR POWER TRANSMISSION SYSTEMS, BY REGION, 2017–2025 (USD MILLION)
TABLE 5 IGBT DISCRETE MARKET FOR RENEWABLE ENERGY, BY REGION, 2017–2025 (USD MILLION)
TABLE 6 IGBT DISCRETE MARKET FOR RAIL TRACTION SYSTEMS, BY REGION, 2017–2025 (USD MILLION)
TABLE 7 IGBT DISCRETE MARKET FOR UPS, BY REGION, 2017–2025 (USD MILLION)
TABLE 8 IGBT DISCRETE MARKET FOR ELECTRIC AND HYBRID VEHICLES, BY REGION, 2017–2025 (USD MILLION)
TABLE 9 IGBT DISCRETE MARKET FOR MOTOR DRIVES, BY REGION, 2017–2025 (USD MILLION)
TABLE 10 IGBT DISCRETE MARKET FOR CONSUMER ELECTRONICS, BY REGION, 2017–2025 (USD MILLION)
TABLE 11 IGBT DISCRETE MARKET FOR OTHERS, BY REGION, 2017–2025 (USD THOUSAND)
TABLE 12 IGBT DISCRETE MARKET, BY REGION, 2017–2025 (USD THOUSAND)
TABLE 13 IGBT DISCRETE MARKET IN NORTH AMERICA, BY COUNTRY, 2017–2025 (USD THOUSAND)
TABLE 14 IGBT DISCRETE MARKET IN EUROPE, BY COUNTRY, 2017–2025 (USD THOUSAND)
TABLE 15 IGBT DISCRETE MARKET IN APAC, BY COUNTRY, 2017–2025 (USD THOUSAND)
TABLE 16 IGBT DISCRETE MARKET IN ROW, BY REGION, 2017–2025 (USD THOUSAND)
TABLE 17 IGBT MODULE MARKET, BY POWER RATING, 2017–2025 (USD MILLION)
TABLE 18 IGBT MODULE MARKET, BY APPLICATION, 2017–2025 (USD MILLION)
TABLE 19 IGBT MODULE MARKET FOR POWER TRANSMISSION SYSTEMS, BY REGION, 2017–2025 (USD MILLION)
TABLE 20 IGBT MODULE MARKET FOR RENEWABLE ENERGY, BY REGION, 2017–2025 (USD MILLION)
TABLE 21 IGBT MODULE MARKET FOR RAIL TRACTION SYSTEMS, BY REGION, 2017–2025 (USD MILLION)
TABLE 22 IGBT MODULE MARKET FOR UPS, BY REGION, 2017–2025 (USD MILLION)
TABLE 23 IGBT MODULE MARKET FOR ELECTRIC AND HYBRID ELECTRIC VEHICLES, BY REGION, 2017–2025 (USD MILLION)
TABLE 24 IGBT MODULE MARKET FOR MOTOR DRIVES, BY REGION, 2017–2025 (USD MILLION)
TABLE 25 IGBT MODULE MARKET FOR CONSUMER ELECTRONICS, BY REGION, 2017–2025 (USD MILLION)
TABLE 26 IGBT MODULE MARKET FOR OTHERS, BY REGION, 2017–2025 (USD MILLION)
TABLE 27 IGBT MODULE MARKET, BY REGION, 2017–2025 (USD THOUSAND)
TABLE 28 IGBT MODULE MARKET IN NORTH AMERICA, BY COUNTRY, 2017–2025 (USD THOUSAND)
TABLE 29 IGBT MODULE MARKET IN EUROPE, BY COUNTRY, 2017–2025 (USD THOUSAND)
TABLE 30 IGBT MODULE MARKET IN APAC, BY COUNTRY, 2017–2025 (USD THOUSAND)
TABLE 31 IGBT MODULE MARKET IN ROW, BY REGION, 2017–2025 (USD THOUSAND)
TABLE 32 IGBT MARKET, BY POWER RATING, 2017–2025 (USD MILLION)
TABLE 33 LOW-POWER IGBT MARKET, BY PACKAGING TYPE, 2017–2025 (USD MILLION)
TABLE 34 MEDIUM-POWER IGBT MARKET, BY PACKAGING TYPE, 2017–2025 (USD MILLION)
TABLE 35 IGBT MARKET, BY VOLTAGE, 2017–2025 (USD MILLION)
TABLE 36 IGBT MARKET, BY APPLICATION, 2017–2025 (USD MILLION)
TABLE 37 IGBT MARKET FOR POWER TRANSMISSION SYSTEMS, BY PACKAGING TYPE, 2017–2025 (USD MILLION)
TABLE 38 IGBT MARKET FOR POWER TRANSMISSION SYSTEMS, BY REGION, 2017–2025 (USD MILLION)
TABLE 39 IGBT MARKET FOR POWER TRANSMISSION SYSTEMS, BY TYPE, 2017–2025 (USD MILLION)
TABLE 40 IGBT MARKET FOR RENEWABLE ENERGY, BY PACKAGING TYPE, 2017–2025 (USD MILLION)
TABLE 41 IGBT MARKET FOR RENEWABLE ENERGY, BY REGION, 2017–2025 (USD MILLION)
TABLE 42 IGBT MARKET FOR RENEWABLE ENERGY, BY TYPE, 2017–2025 (USD MILLION)
TABLE 43 IGBT MARKET FOR RAIL TRACTION SYSTEMS, BY PACKAGING TYPE, 2017–2025 (USD MILLION)
TABLE 44 IGBT MARKET FOR RAIL TRACTION SYSTEMS, BY REGION, 2017–2025 (USD MILLION)
TABLE 45 IGBT MARKET FOR UPS, BY PACKAGING TYPE, 2017–2025 (USD MILLION)
TABLE 46 IGBT MARKET FOR UPS, BY REGION, 2017–2025 (USD MILLION)
TABLE 47 IGBT MARKET FOR ELECTRIC VEHICLES AND HYBRID ELECTRIC VEHICLES, BY PACKAGING TYPE, 2017–2025 (USD MILLION)
TABLE 48 IGBT MARKET FOR EV/HEV, BY REGION, 2017–2025 (USD MILLION)
TABLE 49 IGBT MARKET FOR MOTOR DRIVES, BY PACKAGING TYPE, 2017–2025 (USD MILLION)
TABLE 50 IGBT MARKET FOR MOTOR DRIVES, BY REGION, 2017–2025 (USD MILLION)
TABLE 51 IGBT MARKET FOR MOTOR DRIVES, BY TYPE, 2017–2025 (USD MILLION)
TABLE 52 IGBT MARKET FOR CONSUMER ELECTRONICS, BY PACKAGING TYPE, 2017–2025 (USD MILLION)
TABLE 53 IGBT MARKET FOR CONSUMER ELECTRONICS, BY REGION, 2017–2025 (USD MILLION)
TABLE 54 IGBT MARKET FOR OTHERS, BY PACKAGING TYPE, 2017–2025 (USD MILLION)
TABLE 55 IGBT MARKET FOR OTHERS, BY REGION, 2017–2025 (USD MILLION)
TABLE 56 THYRISTOR MARKET, BY APPLICATION, 2017–2025 (USD MILLION)
TABLE 57 THYRISTOR MARKET FOR POWER TRANSMISSION SYSTEMS, BY REGION, 2017–2025 (USD MILLION)
TABLE 58 THYRISTOR MARKET FOR POWER TRANSMISSION SYSTEMS, BY TYPE, 2017–2025 (USD MILLION)
TABLE 59 THYRISTOR MARKET FOR HVDC SYSTEMS, BY REGION, 2017–2025 (USD MILLION)
TABLE 60 THYRISTOR MARKET FOR FACTS, BY REGION, 2017–2025 (USD MILLION)
TABLE 61 THYRISTOR MARKET FOR MOTOR CONTROLLERS, BY REGION, 2017–2025 (USD MILLION)
TABLE 62 THYRISTOR MARKET FOR LIGHT DIMMERS, BY REGION, 2017–2025 (USD MILLION)
TABLE 63 THYRISTOR MARKET FOR PRESSURE CONTROL SYSTEMS, BY REGION, 2017–2025 (USD MILLION)
TABLE 64 THYRISTOR MARKET FOR LIQUID-LEVEL REGULATORS, BY REGION, 2017–2025 (USD MILLION)
TABLE 65 THYRISTOR MARKET FOR OTHER APPLICATIONS, BY REGION, 2017–2025 (USD MILLION)
TABLE 66 IGBT MARKET, BY REGION, 2017–2025 (USD MILLION)
TABLE 67 THYRISTOR MARKET, BY REGION, 2017–2025 (USD MILLION)
TABLE 68 IGBT MARKET IN NORTH AMERICA, BY PACKAGING TYPE, 2017–2025 (USD MILLION)
TABLE 69 IGBT MARKET IN NORTH AMERICA, BY APPLICATION, 2017–2025 (USD MILLION)
TABLE 70 THYRISTOR MARKET IN NORTH AMERICA, BY APPLICATION, 2017–2025 (USD MILLION)
TABLE 71 THYRISTOR MARKET IN NORTH AMERICA FOR POWER TRANSMISSION SYSTEMS, BY TYPE, 2017–2025 (USD MILLION)
TABLE 72 IGBT MARKET IN NORTH AMERICA, BY COUNTRY, 2017–2025 (USD MILLION)
TABLE 73 IGBT MARKET IN US, BY PACKAGING TYPE, 2017–2025 (USD MILLION)
TABLE 74 IGBT MARKET IN CANADA, BY PACKAGING TYPE, 2017–2025 (USD MILLION)
TABLE 75 IGBT MARKET IN MEXICO, BY PACKAGING TYPE, 2017–2025 (USD MILLION)
TABLE 76 IGBT MARKET IN EUROPE, BY PACKAGING TYPE, 2017–2025 (USD MILLION)
TABLE 77 IGBT MARKET IN EUROPE, BY APPLICATION, 2017–2025 (USD MILLION)
TABLE 78 THYRISTOR MARKET IN EUROPE, BY APPLICATION, 2017–2025 (USD MILLION)
TABLE 79 THYRISTOR MARKET IN EUROPE FOR POWER TRANSMISSION SYSTEMS, BY TYPE, 2017–2025 (USD MILLION)
TABLE 80 IGBT MARKET IN EUROPE, BY COUNTRY, 2017–2025 (USD MILLION)
TABLE 81 IGBT MARKET IN FRANCE, BY PACKAGING TYPE, 2017–2025 (USD MILLION)
TABLE 82 IGBT MARKET IN GERMANY, BY PACKAGING TYPE, 2017–2025 (USD MILLION)
TABLE 83 IGBT MARKET IN UK, BY PACKAGING TYPE, 2017–2025 (USD MILLION)
TABLE 84 IGBT MARKET IN REST OF EUROPE, BY PACKAGING TYPE, 2017–2025 (USD MILLION)
TABLE 85 IGBT MARKET IN APAC, BY PACKAGING TYPE, 2017–2025 (USD MILLION)
TABLE 86 IGBT MARKET IN APAC, BY APPLICATION, 2017–2025 (USD MILLION)
TABLE 87 THYRISTOR MARKET IN APAC, BY APPLICATION, 2017–2025 (USD MILLION)
TABLE 88 THYRISTOR MARKET IN APAC FOR POWER TRANSMISSION SYSTEMS, BY TYPE, 2017–2025 (USD MILLION)
TABLE 89 IGBT MARKET IN APAC, BY COUNTRY, 2017–2025 (USD MILLION)
TABLE 90 IGBT MARKET IN CHINA, BY PACKAGING TYPE, 2017–2025 (USD MILLION)
TABLE 91 IGBT MARKET IN JAPAN, BY PACKAGING TYPE, 2017–2025 (USD MILLION)
TABLE 92 IGBT MARKET IN SOUTH KOREA, BY PACKAGING TYPE, 2017–2025 (USD MILLION)
TABLE 93 IGBT MARKET IN INDIA, BY PACKAGING TYPE, 2017–2025 (USD MILLION)
TABLE 94 IGBT MARKET IN REST OF APAC, BY PACKAGING TYPE, 2017–2025 (USD MILLION)
TABLE 95 IGBT MARKET IN ROW, BY PACKAGING TYPE, 2017–2025 (USD MILLION)
TABLE 96 IGBT MARKET IN ROW, BY APPLICATION, 2017–2025 (USD MILLION)
TABLE 97 THYRISTOR MARKET IN ROW, BY APPLICATION, 2017–2025 (USD MILLION)
TABLE 98 THYRISTOR MARKET IN ROW FOR POWER TRANSMISSION SYSTEMS, BY TYPE, 2017–2025 (USD MILLION)
TABLE 99 IGBT MARKET IN ROW, BY REGION, 2017–2025 (USD MILLION)
TABLE 100 IGBT MARKET IN MIDDLE EAST AND AFRICA, BY PACKAGING TYPE, 2017–2025 (USD MILLION)
TABLE 101 IGBT MARKET IN SOUTH AMERICA, BY PACKAGING TYPE, 2017–2025 (USD MILLION)
TABLE 102 PRODUCT LAUNCHES, 2018–2019
TABLE 103 PARTNERSHIPS, COLLABORATIONS, CONTRACTS, AND AGREEMENTS, 2017–2019
TABLE 104 ACQUISITIONS, 2018–2019
TABLE 105 EXPANSIONS, 2018–2019
LIST OF FIGURES (70 FIGURES)
FIGURE 1 IGBT AND THYRISTOR MARKET: RESEARCH DESIGN
FIGURE 2 IGBT MARKET SIZE ESTIMATION METHODOLOGY: APPROACH 1 (SUPPLY SIDE): REVENUE GENERATED BY COMPANIES FROM SALES OF IGBTS
FIGURE 3 MARKET SIZE ESTIMATION METHODOLOGY: APPROACH 2 – BOTTOM-UP (SUPPLY SIDE): ILLUSTRATIVE EXAMPLE OF COMPANY OPERATING IN IGBT MARKET
FIGURE 4 MARKET SIZE ESTIMATION METHODOLOGY: APPROACH 3 – BOTTOM-UP APPROACH FOR ESTIMATION OF IGBT MARKET SIZE, BY PACKAGING TYPE
FIGURE 5 MARKET SIZE ESTIMATION METHODOLOGY: APPROACH 1 (SUPPLY SIDE): REVENUE GENERATED BY COMPANIES FROM SALES OF THYRISTORS
FIGURE 6 MARKET SIZE ESTIMATION METHODOLOGY: APPROACH 2 – BOTTOM-UP (SUPPLY SIDE): ILLUSTRATIVE EXAMPLE OF COMPANY OPERATING IN THYRISTOR MARKET
FIGURE 7 MARKET SIZE ESTIMATION METHODOLOGY: BOTTOM-UP APPROACH (IGBT MARKET)
FIGURE 8 MARKET SIZE ESTIMATION METHODOLOGY: TOP-DOWN APPROACH (IGBT MARKET)
FIGURE 9 MARKET SIZE ESTIMATION METHODOLOGY: BOTTOM-UP APPROACH (THYRISTOR MARKET)
FIGURE 10 MARKET SIZE ESTIMATION METHODOLOGY: TOP-DOWN APPROACH (THYRISTOR MARKET)
FIGURE 11 DATA TRIANGULATION
FIGURE 12 RESEARCH STUDY ASSUMPTIONS
FIGURE 13 IGBT MODULE MARKET TO GROW AT HIGHER CAGR FROM 2020 TO 2025
FIGURE 14 HIGH-POWER IGBT MARKET TO GROW AT HIGHEST CAGR FROM 2020 TO 2025
FIGURE 15 ELECTRIC AND HYBRID ELECTRIC VEHICLES TO EXHIBIT HIGHEST CAGR IN IGBT MARKET DURING 2020–2025
FIGURE 16 THYRISTOR MARKET FOR POWER TRANSMISSION SYSTEMS TO GROW AT HIGHEST CAGR DURING 2020–2025
FIGURE 17 IGBT MARKET IN APAC TO GROW AT HIGHEST CAGR FROM 2020 TO 2025
FIGURE 18 APAC TO WITNESS HIGHEST CAGR IN THYRISTOR MARKET FROM 2020 TO 2025
FIGURE 19 ADOPTION OF ELECTRIC MOTORS IN INDUSTRIAL, COMMERCIAL, AND RESIDENTIAL APPLICATIONS TO FUEL MARKET GROWTH
FIGURE 20 INITIATIVES OF GOVERNMENTS ACROSS VARIOUS COUNTRIES TOWARD REPLACEMENT OF AGING POWER INFRASTRUCTURE
FIGURE 21 IGBT MARKET IN CHINA TO GROW AT HIGHEST CAGR FROM 2020 TO 2025
FIGURE 22 APAC TO ACCOUNT FOR LARGEST SHARE OF THYRISTOR MARKET IN 2025
FIGURE 23 ELECTRIC AND HYBRID ELECTRIC VEHICLES AND APAC TO ACCOUNT FOR LARGEST SHARES OF GLOBAL IGBT MARKET IN 2025
FIGURE 24 INITIATIVES OF GOVERNMENTS ACROSS VARIOUS COUNTRIES TOWARD REPLACEMENT OF AGING POWER INFRASTRUCTURE
FIGURE 25 IGBT AND THYRISTOR MARKET DRIVERS AND THEIR IMPACT
FIGURE 26 IGBT AND THYRISTOR MARKET RESTRAINTS AND THEIR IMPACT
FIGURE 27 IGBT AND THYRISTOR MARKET OPPORTUNITIES AND THEIR IMPACT
FIGURE 28 IGBT AND THYRISTOR MARKET CHALLENGES AND THEIR IMPACT
FIGURE 29 IGBT AND THYRISTOR ECOSYSTEM: MAJOR VALUE IS ADDED BY IGBT AND THYRISTOR MANUFACTURERS, AND SUPPLIERS AND DISTRIBUTORS
FIGURE 30 IGBT MARKET, BY PACKAGING TYPE
FIGURE 31 IGBT MODULE MARKET TO GROW AT HIGHER CAGR FROM 2020 TO 2025
FIGURE 32 APAC TO REGISTER HIGHEST CAGR IN IGBT MODULE MARKET FOR RENEWABLE ENERGY FROM 2020 TO 2025
FIGURE 33 IGBT MODULE MARKET FOR ELECTRIC AND HYBRID ELECTRIC VEHICLES IN APAC TO GROW AT HIGHER CAGR FROM 2020 TO 2025
FIGURE 34 IGBT MARKET, BY POWER RATING
FIGURE 35 HIGH-POWER IGBT MARKET PROJECTED TO GROW AT HIGHEST CAGR FROM 2020 TO 2025
FIGURE 36 MEDIUM-POWER IGBT MODULES TO EXHIBIT HIGHER CAGR IN IGBT MARKET DURING 2020–2025
FIGURE 37 IGBT MARKET, BY VOLTAGE
FIGURE 38 1,200–1,700 VOLT IGBT MARKET TO GROW AT HIGHEST CAGR FROM 2020 TO 2025
FIGURE 39 IGBT MARKET, BY APPLICATION
FIGURE 40 EV/HEV APPLICATION PROJECTED TO WITNESS HIGHEST CAGR IN IGBT MARKET FROM 2020 TO 2025
FIGURE 41 HVDC SYSTEMS PROJECTED TO DOMINATE IGBT MARKET FOR POWER TRANSMISSION SYSTEMS FROM 2020 TO 2025
FIGURE 42 PV POWER GENERATION SYSTEMS TO COMMAND IGBT MARKET FOR RENEWABLE ENERGY APPLICATIONS THROUGHOUT FORECAST PERIOD
FIGURE 43 APAC TO REGISTER HIGHEST CAGR IN IGBT MARKET FOR RAIL TRACTION SYSTEMS FROM 2020 TO 2025
FIGURE 44 APAC TO RECORD HIGHEST CAGR IN IGBT MARKET FOR ELECTRIC VEHICLES AND HYBRID ELECTRIC VEHICLES FROM 2020 TO 2025
FIGURE 45 DIFFERENT CLASSES OF THYRISTORS
FIGURE 46 THYRISTOR MARKET, BY APPLICATION
FIGURE 47 POWER TRANSMISSION SYSTEMS TO RECORD HIGHEST CAGR IN THYRISTOR MARKET FROM 2020 TO 2025
FIGURE 48 APAC TO WITNESS HIGHEST CAGR IN THYRISTOR MARKET FOR MOTOR CONTROLLERS FROM 2020 TO 2025
FIGURE 49 IGBT MARKET IN APAC TO GROW AT HIGHEST CAGR FROM 2020 TO 2025
FIGURE 50 THYRISTOR MARKET IN APAC TO GROW AT HIGHEST CAGR FROM 2020 TO 2025
FIGURE 51 NORTH AMERICA: IGBT & THYRISTOR MARKET SNAPSHOT
FIGURE 52 IGBT MARKET IN US TO GROW AT HIGHEST CAGR FROM 2020 TO 2025
FIGURE 53 EUROPE: IGBT AND THYRISTOR MARKET SNAPSHOT
FIGURE 54 GERMANY TO WITNESS HIGHEST CAGR IN EUROPEAN IGBT MARKET FROM 2020 TO 2025
FIGURE 55 APAC: IGBT AND THYRISTOR MARKET SNAPSHOT
FIGURE 56 CHINA TO RECORD HIGHEST CAGR IN IGBT MARKET IN APAC FROM 2020 TO 2025
FIGURE 57 MIDDLE EAST AND AFRICA TO EXHIBIT HIGHER CAGR IN IGBT MARKET IN ROW FROM 2020 TO 2025
FIGURE 58 COMPANIES ADOPTED PARTNERSHIP AS KEY GROWTH STRATEGY FROM 2017 TO 2019
FIGURE 59 RANKING OF TOP 5 PLAYERS IN IGBT AND THYRISTOR MARKET (2019)
FIGURE 60 IGBT AND THYRISTOR MARKET (GLOBAL) COMPETITIVE LEADERSHIP MAPPING, 2019
FIGURE 61 INFINEON TECHNOLOGIES AG: COMPANY SNAPSHOT
FIGURE 62 FUJI ELECTRIC CO., LTD.: COMPANY SNAPSHOT
FIGURE 63 ON SEMICONDUCTOR: COMPANY SNAPSHOT
FIGURE 64 MITSUBISHI ELECTRIC CORPORATION: COMPANY SNAPSHOT
FIGURE 65 STMICROELECTRONICS: COMPANY SNAPSHOT
FIGURE 66 RENESAS ELECTRONICS CORPORATION: COMPANY SNAPSHOT
FIGURE 67 VISHAY INTERTECHNOLOGY: COMPANY SNAPSHOT
FIGURE 68 ABB LTD: COMPANY SNAPSHOT
FIGURE 69 HITACHI, LTD.: COMPANY SNAPSHOT
FIGURE 70 TOSHIBA CORPORATION: COMPANY SNAPSHOT
The study involved four major activities for estimating the market size of the IGBT and thyristor market. Exhaustive secondary research was carried out to collect information relevant to the market, the peer market, and the parent market. Primary research was undertaken to validate these findings, assumptions, and sizing with the industry experts across the value chain of the IGBT & thyristor market. Both top-down and bottom-up approaches were employed to estimate the complete market size. Thereafter, the market breakdown and data triangulation methods were used to estimate the size of different segments and sub-segments of the market.
Secondary Research
The research methodology used to estimate and forecast the size of the IGBT & thyristor market began by capturing data related to the revenues of key vendors in the market through secondary research. This study involved the extensive use of secondary sources, directories, and databases (such as Hoovers, Bloomberg Businessweek, Factiva, and OneSource) to identify and collect information useful for a technical, market-oriented, and commercial study of the IGBT & thyristor market. Vendor offerings have been taken into consideration to determine the market segmentation. The entire research methodology included the study of annual reports, press releases, and investor presentations of companies; white papers; and certified publications and articles by recognized authors, directories, and databases.
Primary Research
The IGBT & thyristor market comprises several stakeholders, such as suppliers of standard components and original equipment manufacturers (OEMs). The demand side of this market is characterized by the development and manufacture of IGBT and thyristor applications, as well as by different applications. The supply side is characterized by advancements carried out in IGBT with packaging types such as IGBT discrete and IGBT modules. Various primary sources from both the supply and demand sides of the market have been interviewed to obtain qualitative and quantitative information. Following is the breakdown of primary respondents.

Market Size Estimation
Both top-down and bottom-up approaches have been used to estimate and validate the size of the IGBT and thyristor market and its segments. The research methodology used to estimate the market size included the following:
- Key players in the market have been identified through extensive secondary research.
- The supply chain of the manufacturing industry and the size of the IGBT and thyristor market, in terms of value, have been determined through primary and secondary research processes.
- All percentage shares, splits, and breakdowns have been determined using secondary sources and verified through primary sources.
Data Triangulation
After arriving at the overall market size—using the market size estimation process explained above—the total market has been split into several segments and subsegments. Data triangulation and market breakdown procedures were employed, wherever applicable, to complete the overall market engineering process and arrive at the exact statistics of each market segment and subsegment. The data was triangulated by studying various factors and trends from both the demand and supply sides of the IGBT & thyristor market.
Research Objectives
- To describe and forecast the overall size of the IGBT market by packaging type, power rating, voltage, and application, in terms of value
- To describe and forecast the overall size of the thyristor market by application, in terms of value
- To describe and forecast the size of the IGBT & thyristor market, by regions—North America, Europe, Asia Pacific (APAC), and the Rest of the World (RoW) in terms of value
- To provide detailed information regarding the major factors such as drivers, restraints, opportunities, and challenges influencing the market growth
- To describe the IGBT & thyristor value chain in brief
- To strategically analyze micro markets with respect to individual growth trends, prospects, and contributions to the overall market
- To strategically profile the key players and comprehensively analyze their position in the IGBT & thyristor market in terms of their ranking and core competencies as well as provide detailed information on the competitive landscape of the market
- To analyze competitive developments such as product launches, partnerships, collaborations, contracts, agreements, acquisitions, and expansions undertaken in the IGBT & thyristor market
Available Customizations:
Along with the market data, MarketsandMarkets offers customizations according to the specific requirements of companies. The following customization options are available for the report:
Company Information
- Detailed analysis and profiling of additional market players (up to 5)
Critical Questions
- What are the new application areas being explored by the providers of IGBTs & thyristors?
- Who are the key players in the IGBT & thyristor market, and how intense is the competition in this market?


Growth opportunities and latent adjacency in IGBT & Thyristor Market