Honeycomb Core Materials Market by Type (Paper, Aluminum, Thermoplastic, Nomex), Application (Composites, Non-composites), End-use Industry (Aerospace & Defense, Packaging, Transportation, Construction & Infrastructure), Region - Global Forecast to 2022


[134 Pages Report] Honeycomb Core Materials Market size was valued at USD 1.87 Billion in 2016 and is projected to reach USD 3.21 Billion by 2022, at a CAGR of 9.5% between 2017 and 2022. The increasing demand for lightweight, high strength, and environment-friendly packaging solutions is driving the growth of the honeycomb core materials market across the globe. The manufacturers of honeycomb core materials are entering into supply agreements with other companies, developing new products, and acquiring smaller companies to expand their presence and secure their position in the honeycomb core materials market, globally. In this study, the years considered to estimate the market size of the honeycomb core materials market are:
- Base Year � 2016
- Estimated Year � 2017
- Projected Year � 2022
- Forecast Period � 2017 to 2022
2016 has been considered as the base year for the company profiles. In cases where information for the base year is not unavailable, the year prior to it has been considered.
Objectives of the Study
- To analyze and forecast the size of the honeycomb core materials market in terms of volume and value
- To provide detailed information regarding the key factors, such as drivers, restraints, opportunities, and challenges, influencing the growth of the honeycomb core materials market
- To define, describe, and forecast the honeycomb core materials market based on type, application, and end-use industry
- To analyze and forecast the size of the honeycomb core materials market in North America, Europe, Asia Pacific (APAC), the Middle East & Africa (MEA), Latin America, and their key countries
- To strategically profile the key players operating in the honeycomb core materials market and analyze their core competencies
- To analyze the market opportunities and competitive landscape for the stakeholders and market leaders
- To analyze competitive developments, such as agreements & partnerships, expansions, and new product launches undertaken by the key market players
Various secondary sources, such as Factiva, Hoovers, and Manta, among others, have been used to understand and gain insights about the honeycomb core materials market. Experts from the top companies manufacturing honeycomb core materials have been interviewed to verify and collect critical information and to assess the trends in the honeycomb core materials market during the forecast period. The top-down, bottom-up, and data triangulation approaches have been implemented to calculate the exact values of the overall parent and individual market sizes.
To know about the assumptions considered for the study, download the pdf brochure
The market for honeycomb core materials has a diversified and established ecosystem consisting of upstream players, such as raw material suppliers; downstream stakeholders, such as manufacturers, vendors, and end-users of honeycomb core materials; and various government organizations. Some of the major players operating in the honeycomb core materials market are Honicel (Netherlands), Hexcel Corporation (US) Euro-Composites (Luxembourg), Argosy International (US), Grigeo (Lithuania), Plascore (US), Tubus Baer GmbH (Germany), Corinth Group (Netherlands), Axxion Group (Netherlands), and Ten Cate (Netherlands).
Target Audience
- Manufacturers of Honeycomb Core Materials
- Suppliers of Raw Materials
- Distributors and Suppliers of Honeycomb Core Materials
- End-use Industries
- Industry Associations
�This study answers several questions for the stakeholders, primarily which market segments to focus on, in the next two to five years for prioritizing their efforts and investments.�
Scope of the Report:
This research report categorizes the honeycomb core materials market based on type, application, end-use industry, and region. It forecasts the revenue growth and analyzes the trends in each of the submarkets.
Honeycomb Core Materials Market, by Type:
- Aluminum
- Paper
- Nomex
- Thermoplastic
- Others
Honeycomb Core Materials Market, by Application:
- Composites
- Non-Composites
Honeycomb Core Materials Market, by End-Use Industry:
- Packaging
- Aerospace & Defense
- Construction & infrastructure
- Transportation
- Others
Honeycomb Core Materials Market, by Region
- North America
- Europe
- Asia Pacific (APAC)
- Middle East & Africa (MEA)
- Latin America
Available Customizations
With the given market data, MarketsandMarkets offers customizations according to the specific needs of the companies. The following customization options are available for the report:
Product Analysis
- Product matrix, which gives a detailed comparison of the product portfolio of each company
Regional Analysis
- Further breakdown of the North America honeycomb core materials market
- Further breakdown of the Europe honeycomb core materials market
- Further breakdown of the Asia Pacific honeycomb core materials market
- Further breakdown of the Middle East & Africa honeycomb core materials market
- Further breakdown of the Latin America honeycomb core materials market
Company Information
- Detailed analysis and profiling of additional market players
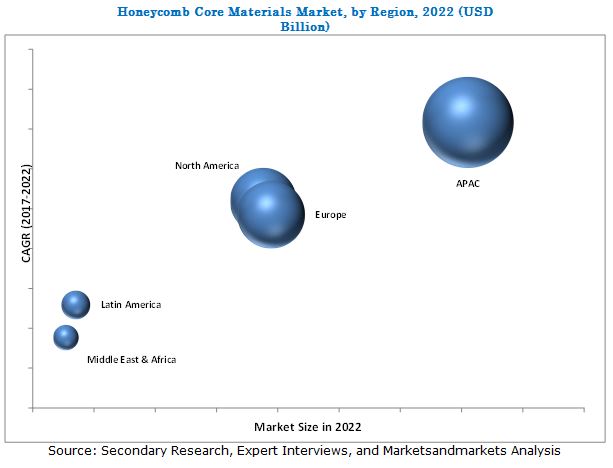
The honeycomb core materials market is projected to reach USD 3.21 Billion by 2022, at a CAGR of 9.5% between 2017 and 2022. The increasing demand for lightweight, high strength, and recyclable packaging solutions is driving the growth of the honeycomb core materials market across the globe.
Based on type, the honeycomb core materials market has been classified into paper, aluminum, Nomex, thermoplastic, and others. The paper segment is expected to lead the honeycomb core materials market in terms of volume, during the forecast period. Nomex honeycombs are also increasingly used in aerospace & defense, transportation, sporting goods, and other applications. The Nomex aerospace grade honeycombs are used in cargo linings, helicopter blades, fuselage components, aircraft flooring, radomes, antennas, and so on. They are exceptional core materials for sandwich structures and are efficient energy absorbers, making them ideal for automotive heat shield and other high-temperature applications.
Based on end-use industry, the packaging segment is estimated to lead the honeycomb core materials market in 2017 in terms of value and volume. The growth of this end-use industry segment can be attributed to the increased demand for paper honeycomb core materials to protect household & industrial appliances, equipment, and other fragile & delicate products against external effects during transportation. Honeycomb core materials are not only strong and durable, but they also offer cushioning and rigidity, thus providing superior protection.
The Asia Pacific (APAC) region is the largest market for the honeycomb core materials market in terms of value and volume. The growth of the APAC honeycomb core materials market can be attributed to the increased demand for honeycomb core materials from the region�s developing countries, such as China and India. The growth of the APAC packaging industry is directly driving the honeycomb core materials market. Paper honeycomb is increasingly used in boxes and pallets for the transportation of goods.
The absorbance of water and moisture by open cell structures of honeycomb and the incapability of honeycomb cores to form cylindrical shapes for packaging are major factors restraining the growth of the honeycomb core materials market across the globe.
Honicel (Netherlands), Euro-Composites (Luxembourg), Hexcel Corporation (US), Argosy International (US), Grigeo AB (Lithuania), Plascore (US), Tubus Baer GmbH (Germany), Corinth. (Netherlands), Axxion (Netherlands), Ten Cate (Netherlands), The Gill Corporation (US), Samia Canada (US), and Corex Honeycomb (UK) are some of the key players operating in the honeycomb core materials market. These players have adopted growth strategies such as agreements & partnerships, expansions, acquisitions, and new product launches, to strengthen their position in the honeycomb core materials market.
Honicel (Netherlands) is one of the major players in the honeycomb core materials market. The company emphasizes excellence in the creation of consumer-centric products for various end-use industries. It is focused on continuous improvements in its businesses and follows strategic moves to sustain its leading position in the market.
To speak to our analyst for a discussion on the above findings, click Speak to Analyst
 Exclusive indicates content/data unique to MarketsandMarkets and not available with any competitors.
Table of Contents
1 Introduction (Page No. - 15)
1.1 Objectives of the Study
1.2 Market Definition
1.3 Market Scope
1.3.1 Years Considered for the Study
1.4 Currency
1.5 Package Size
1.6 Limitations
1.7 Stakeholders
2 Research Methodology (Page No. - 19)
2.1 Research Data
2.1.1 Secondary Data
2.1.1.1 Key Data From Secondary Sources
2.1.2 Primary Data
2.1.2.1 Key Data From Primary Sources
2.1.2.2 Key Industry Insights
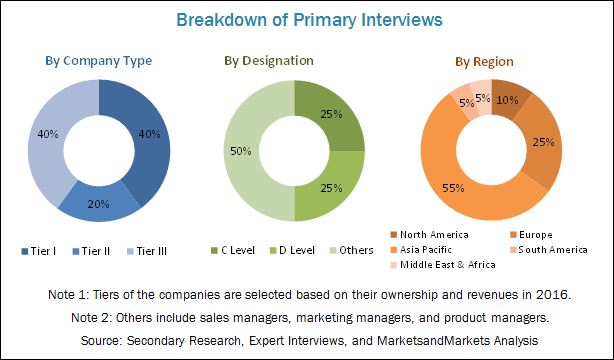
2.1.2.3 Breakdown of Primary Interviews
2.2 Market Size Estimation
2.2.1 Bottom-Up Approach
2.2.2 Top-Down Approach
2.3 Data Triangulation
2.4 Assumptions
3 Executive Summary (Page No. - 26)
4 Premium Insights (Page No. - 31)
4.1 Attractive Growth Opportunities in Honeycomb Core Materials Market
4.2 Honeycomb Core Materials Market, By Type and Region
4.3 Honeycomb Core Materials Market, By Type
4.4 Honeycomb Core Materials Market, By Country
5 Market Overview (Page No. - 34)
5.1 Introduction
5.2 Market Dynamics
5.2.1 Drivers
5.2.1.1 Increase in Demand From Boeing and Airbus
5.2.1.2 Increase in Demand for Lightweight and Excellent Strength-To-Weight Ratio Vehicles
5.2.1.3 Increasing Use of Paper Honeycomb Core in Packaging Industry
5.2.2 Restraints
5.2.2.1 Absorbance of Water and Moisture By Open Cell Structures of Honeycomb
5.2.2.2 High Cost of Nomex Honeycomb Core
5.2.2.3 Structural Limitations of Honeycomb Core Materials
5.2.3 Opportunities
5.2.3.1 Increasing Use of Recyclable Products
5.2.4 Challenges
5.2.4.1 to Produce Low-Cost Nomex Honeycomb Cores
5.3 Porter�s Five Forces Analysis
5.3.1 Threat of New Entrants
5.3.2 Threat of Substitutes
5.3.3 Bargaining Power of Buyers
5.3.4 Bargaining Power of Suppliers
5.3.5 Intensity of Competitive Rivalry
6 Macroeconomic Overview (Page No. - 41)
6.1 Introduction
6.2 Trends and Forecast of GDP
6.3 Per Capita GDP vs Per Capita Core Materials Demand
6.4 Trends and Forecast of Construction Industry
6.5 Trends in Aerospace Industry
6.6 Trends in Automotive Industry
7 Honeycomb Core Materials Market, By Type (Page No. - 49)
7.1 Introduction
7.2 Aluminum
7.3 Nomex
7.4 Thermoplastic
7.5 Paper
7.6 Others
7.6.1 Fiberglass
7.6.2 Carbon
7.6.3 Stainless Steel
8 Honeycomb Core Materials Market, By Application (Page No. - 59)
8.1 Introduction
8.2 Non-Composites
8.3 Composites
9 Honeycomb Core Materials Market, By End-Use Industry (Page No. - 64)
9.1 Introduction
9.2 Packaging
9.3 Aerospace & Defense
9.4 Transportation
9.5 Construction & Infrastructure
9.6 Others
9.6.1 Sporting Goods
9.6.2 Marine
9.6.3 Industrial
10 Honeycomb Core Materials Market By Region (Page No. - 74)
10.1 Introduction
10.2 North America
10.2.1 Honeycomb Core Materials Market in North America, By Country
10.2.1.1 US
10.2.1.2 Canada
10.2.2 Honeycomb Core Materials Market in North America, By Type
10.2.3 Honeycomb Core Materials Market in North America, By End-Use Industry
10.3 Europe
10.3.1 Honeycomb Core Materials Market in Europe, By Country
10.3.1.1 Germany
10.3.1.2 UK
10.3.1.3 France
10.3.1.4 Spain
10.3.1.5 Italy
10.3.1.6 Russia
10.3.1.7 Sweden
10.3.1.8 Netherlands
10.3.2 Honeycomb Core Materials Market in Europe, By Type
10.3.3 Honeycomb Core Materials Market in Europe, By End-Use Industry
10.4 APAC
10.4.1 Honeycomb Core Materials Market in APAC, By Country
10.4.1.1 China
10.4.1.2 Japan
10.4.1.3 India
10.4.1.4 Rest of APAC
10.4.2 Honeycomb Core Materials Market in APAC, By Type
10.4.3 Honeycomb Core Materials Market in Europe, By End-Use Industry
10.5 Middle East & Africa
10.5.1 Honeycomb Core Materials Market Size in Middle East & Africa, By Country
10.5.1.1 South Africa
10.5.1.2 Saudi Arabia
10.5.1.3 UAE
10.5.2 Honeycomb Core Materials Market Size in Middle East & Africa, By Type
10.5.3 Honeycomb Core Materials Market Size in Middle East & Africa, By End-Use Industry
10.6 Latin America
10.6.1 Honeycomb Core Materials Market Size of Latin America, By Country
10.6.1.1 Mexico
10.6.1.2 Brazil
10.6.1.3 Rest of Latin America
10.6.2 Honeycomb Core Materials Market Size in Latin America, By Type
10.6.3 Honeycomb Core Materials Market Size of Latin America, By End-Use Industry
11 Competitive Landscape (Page No. - 100)
11.1 Overview
11.2 Market Ranking
11.2.1 Top 3 Paper Honeycomb Manufacturers
11.2.2 Top 3 Nomex Honeycomb Manufacturers
11.2.3 Top 3 Aluminum Honeycomb Manufacturers
11.2.4 Top 3 Thermoplastic Honeycomb Manufacturers
11.3 Competitive Scenario
11.3.1 Expansion
11.3.2 Agreement & Partnership
11.3.3 New Product Launch/Development
11.3.4 Acquisition
12 Company Profiles (Page No. - 105)
(Overview, Financial*, Products & Services, Strategy, and Developments)
12.1 Hexcel Corporation
12.2 Honicel
12.3 Packaging Corporation of America (PCA)
12.4 Argosy International
12.5 Euro-Composites
12.6 Grigeo
12.7 Dufaylite Developments
12.8 Cartoflex
12.9 Corinth Group
12.10 Axxion Group
12.11 Other Companies
12.11.1 Plascore
12.11.2 Koninklijke Ten Cate B.V
12.11.3 Advanced Honeycomb Technologies (AHT)
12.11.4 Thermhex Waben GmbH
12.11.5 The Gill Corporation
12.11.6 Ten Cate
12.11.7 Samia Canada
12.11.8 Honeycomb Cellpack
12.11.9 Tubus Baer GmbH
12.11.10 Universal Metaltek
12.11.11 Lsquare Eco-Products
12.11.12 I�hexagone
12.11.13 Ti-Vu Plast
12.11.14 Corex Honeycomb
12.11.15 Suzhou Beecore Honeycomb Materials
12.11.16 Rhinokore Composite Solutions
12.11.17 Benecore,
12.11.18 Tricel Honeycomb Corporation
*Details Might Not Be Captured in Case of Unlisted Companies
13 Appendix (Page No. - 126)
13.1 Insights From Industry Experts
13.2 Discussion Guide
13.3 Knowledge Store: Marketsandmarkets Subscription Portal
13.4 Introducing RT: Real-Time Market Intelligence
13.5 Related Reports
13.6 Author Details
List of Tables (75 Tables)
Table 1 Trends and Forecast of GDP, 2016�2022 (USD Billion)
Table 2 Per Capita GDP vs Per Capita Core Materials Demand, 2016 (USD)
Table 3 Trends and Forecast of Construction Industry in North America, 2015�2022 (USD Billion)
Table 4 Trends and Forecast of Construction Industry in Europe, 2015�2022 (USD Billion)
Table 5 Trends and Forecast of Construction Industry in APAC, 2015�2022 (USD Billion)
Table 6 Trends and Forecast of Construction Industry in Middle East & Africa, 2015�2022 (USD Billion)
Table 7 Trends and Forecast of Construction Industry in Latin America, 2015�2022 (USD Billion)
Table 8 Number of Airplane Deliveries, By Region, 2017�2036
Table 9 Automotive Production, Million Units (2011�2016)
Table 10 By Market Size, By Type, 2015�2022 (USD Million)
Table 11 By Market Size, By Type, 2015�2022 (Kiloton)
Table 12 Aluminum Honeycomb Core Materials Market Size, By Region, 2015�2022 (USD Million)
Table 13 Aluminum Honeycomb Core Materials Market Size, By Region, 2015�2022 (Kiloton)
Table 14 Nomex Honeycomb Core Materials Market Size, By Region, 2015�2022 (USD Million)
Table 15 Nomex Honeycomb Core Materials Market Size, By Region, 2015�2022 (Kiloton)
Table 16 Thermoplastic Honeycomb Core Materials Market Size, By Region, 2015�2022 (USD Million)
Table 17 Thermoplastic Honeycomb Core Materials Market Size, By Region, 2015�2022 (Kiloton)
Table 18 Paper Honeycomb Core Materials Market Size, By Region, 2015�2022 (USD Million)
Table 19 Paper Honeycomb Core Materials Market Size, By Region, 2015�2022 (Kiloton)
Table 20 Other Honeycomb Core Materials Market Size, By Region, 2015�2022 (USD Million)
Table 21 Other Honeycomb Core Materials Market Size, By Region, 2015�2022 (Kiloton)
Table 22 By Market Size, By Application, 2015�2022 (USD Million)
Table 23 By Market Size, By Application, 2015�2022 (Kiloton)
Table 24 By Market Size in Non-Composites Application, By Region, 2015�2022 (USD Million)
Table 25 By Market Size in Non-Composites Application, By Region, 2015�2022 (Kiloton)
Table 26 By Market Size in Composites Application, By Region, 2015�2022 (USD Million)
Table 27 By Market Size in Composites Application, By Region, 2015�2022 (Kiloton)
Table 28 By Market Size, By End-Use Industry, 2015�2022 (USD Million)
Table 29 By Market Size, By End-Use Industry, 2015�2022 (Kiloton)
Table 30 By Market Size in Packaging, By Region, 2015�2022 (USD Million)
Table 31 By Market Size in Packaging, By Region, 2015�2022 (Kiloton)
Table 32 By Market Size in Aerospace & Defense, By Region, 2015�2022 (USD Million)
Table 33 By Market Size in Aerospace & Defense, By Region, 2015�2022 (Kiloton)
Table 34 By Market Size in Transportation, By Region, 2015�2022 (USD Million)
Table 35 By Market Size in Transportation, By Region, 2015�2022 (Kiloton)
Table 36 By Market Size in Construction & Infrastructure, By Region, 2015�2022 (USD Million)
Table 37 By Market Size in Construction & Infrastructure, By Region, 2015�2022 (Kiloton)
Table 38 By Market Size in Other End-Use Industries, By Region, 2015�2022 (USD Million)
Table 39 By Market Size in Other End-Use Industries, By Region, 2015�2022 (Kiloton)
Table 40 By Market Size, By Region, 2015�2022 (USD Million)
Table 41 By Market Size, By Region, 2015�2022 (Kiloton)
Table 42 North America: By Market Size, By Country, 2015�2022 (USD Million)
Table 43 North America: By Market Size, By Country, 2015�2022 (Kiloton)
Table 44 North America: By Market Size, By Type, 2015�2022 (USD Million)
Table 45 North America: By Market Size, By Type, 2015�2022 (Kiloton)
Table 46 North America: By Market Size, By End-Use Industry, 2015�2022 (USD Million)
Table 47 North America: By Market Size, By End-Use Industry, 2015�2022 (Kiloton)
Table 48 Europe: By Market Size, By Country, 2015�2022 (USD Million)
Table 49 Europe: By Market Size, By Country, 2015�2022 (Kiloton)
Table 50 Europe: By Market Size, By Type, 2015�2022 (USD Million)
Table 51 Europe: By Market Size, By Type, 2015�2022 (Kiloton)
Table 52 Europe: By Market Size, By End-Use Industry, 2015�2022 (USD Million)
Table 53 Europe: By Market Size, By End-Use Industry, 2015�2022 (Kiloton)
Table 54 APAC: By Market Size, By Country, 2015�2022 (USD Million)
Table 55 APAC: By Market Size, By Country, 2015�2022 (Kiloton)
Table 56 APAC: By Market Size, By Type, 2015�2022 (USD Million)
Table 57 APAC: By Market Size, By Type, 2015�2022 (Kiloton)
Table 58 APAC: By Market Size, By End-Use Industry, 2015�2022 (USD Million)
Table 59 APAC: By Market Size, By End-Use Industry, 2015�2022 (Kiloton)
Table 60 Middle East & Africa: By Market Size, By Country, 2015�2022 (USD Million)
Table 61 Middle East & Africa: By Market Size, By Country, 2015�2022 (Kiloton)
Table 62 Middle East & Africa: By Market Size, By Type, 2015�2022 (USD Million)
Table 63 Middle East & Africa: By Market Size, By Type, 2015�2022 (Kiloton)
Table 64 Middle East & Africa: By Market Size, By End-Use Industry, 2015�2022 (USD Million)
Table 65 Middle East & Africa: By Market Size, By End-Use Industry, 2015�2022 (Kiloton)
Table 66 Latin America: By Market Size, By Country, 2015-2022 (USD Million)
Table 67 Latin America: By Market Size, By Country, 2015-2022 (Kiloton)
Table 68 Latin America: By Market Size, By Type, 2015�2022 (USD Million)
Table 69 Latin America: By Market Size, By Type, 2015�2022 (Kiloton)
Table 70 Latin America: By Market Size, By End-Use Industry, 2015�2022 (USD Million)
Table 71 Latin America: By Market Size, By End-Use Industry, 2015�2022 (Kiloton)
Table 72 Expansion, 2012�2017
Table 73 Agreement & Partnership, 2012�2017
Table 74 New Product Launch/Development, 2012�2017
Table 75 Acquisition, 2012�2017
List of Figures (39 Figures)
Figure 1 Honeycomb Core Materials Market: Research Methodology
Figure 2 Market Size Estimation Methodology: Bottom-Up Approach
Figure 3 Market Size Estimation Methodology: Top-Down Approach
Figure 4 Honeycomb Core Materials Market: Data Triangulation
Figure 5 Paper Honeycomb Materials to Be the Fastest�Growing Type of the Market, 2017�2022
Figure 6 China to Be the Fastest-Growing Honeycomb Core Materials Market, 2017�2022
Figure 7 Packaging to Dominate Honeycomb Core Materials Market Between 2017 and 2022
Figure 8 APAC Dominated the Honeycomb Core Materials Market in 2016
Figure 9 Increased Government Regulations to Drive Honeycomb Core Materials Market, 2017�2022
Figure 10 APAC Dominated Honeycomb Core Materials Market
Figure 11 Paper Honeycomb Core Materials to Dominate Market During the Forecast Period
Figure 12 China to Be the Fastest-Growing Market During the Forecast Period
Figure 13 Drivers, Restraints, Opportunities, and Challenges in Honeycomb Core Material Market
Figure 14 Porter�s Five Forces Analysis of Honeycomb Core Materials Market
Figure 15 GDP of Major Countries in 2016 (USD Billion)
Figure 16 Trends and Forecast of Construction Industry in North America, 2017 vs 2022 (USD Billion)
Figure 17 Trends and Forecast of Construction Industry in Europe, 2017 vs 2022 (USD Billion)
Figure 18 Trends and Forecast of Construction Industry in APAC, 2017 vs 2022 (USD Billion)
Figure 19 Trends and Forecast of Construction Industry in Middle East & Africa, 2017 vs 2022 (USD Billion)
Figure 20 Trends and Forecast of Construction Industry in Latin America, 2017 vs 2022 (USD Billion)
Figure 21 Nomex Honeycomb Core Materials to Register the Highest CAGR in North America Between 2017 and 2022
Figure 22 Thermoplastic Honeycomb Core Materials to Register the Highest CAGR in APAC Between 2017 and 2022
Figure 23 APAC to Lead the Honeycomb Core Materials Market in Non-Composites Application, 2017 Vs.2022
Figure 24 APAC to Be the Fastest-Growing Market in Packaging Between 2017 and 2022
Figure 25 North America to Dominate Aerospace & Defense Segment During the Forecast Period
Figure 26 China to Drive Honeycomb Core Materials Market Between 2017 and 2022
Figure 27 North America Snapshot: US to Be the Most Lucrative Honeycomb Core Materials Market
Figure 28 Europe Snapshot: Germany is the Fastest-Growing Honeycomb Core Materials Market
Figure 29 APAC Snapshot: China to Be the Key Honeycomb Core Materials Market Between 2017 and 2022
Figure 30 Companies Adopted Expansion as the Key Growth Strategy Between 2012 and 2017
Figure 31 Honicel: the Largest Company in the Paper Honeycomb Core Materials Market
Figure 32 Hexcel Corporation: Company Snapshot
Figure 33 Hexcel Corporation: SWOT Analysis
Figure 34 Honicel: SWOT Analysis
Figure 35 Packaging Corporation of America: Company Snapshot
Figure 36 Packaging Corporation of America: SWOT Analysis
Figure 37 Argosy International: SWOT Analysis
Figure 38 Euro-Composites: SWOT Analysis
Figure 39 Grigeo: Company Snapshot


Growth opportunities and latent adjacency in Honeycomb Core Materials Market