Healthcare Interoperability Solutions Market by Type (Software (EHR, Lab System, Imaging, Health Information Exchange, Enterprises), and Services), Interoperability Level (Foundational, Structural, Semantic), End User, and Region - Global Forecast to 2027
Global Healthcare Interoperability Solutions Market Trends
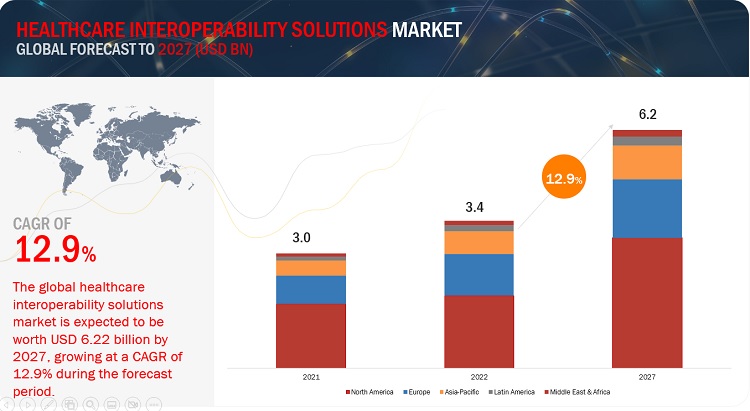
To know about the assumptions considered for the study, Request for Free Sample Report
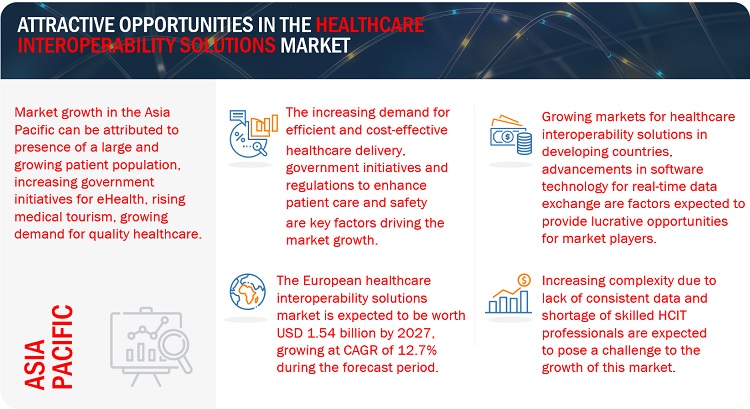
Healthcare interoperability solutions Market Dynamics
Drivers: Emergence of new medical technologies
Technological advances over the last several decades have been on the rise. However, the cost of some of these technological advances is what is partially responsible for the overall increase in healthcare costs. In fact, new medical technologies are responsible for 40–50% of annual cost increases. Healthcare interoperability has several potential benefits. Well-communicating systems can improve operational efficiency, thereby reducing the time spent on administrative tasks such as manually entering data received from faxes. Interoperability can also reduce duplicate clinical interventions such as imaging studies or lab orders, thus decreasing waste and overall costs and also improving patient safety by reducing exposure to radiation or invasive procedures. Finally, interoperability may also improve clinical care by facilitating improved access to relevant and longitudinal clinical data at the point of care. FHIR, or Fast Healthcare Interoperability Resources, is an open-source standards framework for healthcare data that draws on HL7, a previous standards framework. FHIR was developed to facilitate the transfer of healthcare data from one system to another.
Restraints: Lack of accurate interoperability solutions across healthcare supply chain
The lack of accurate interoperability between healthcare providers, systems, technology, and information is a challenge across the healthcare supply chain. Diverse vendors, processes, and standards all obstruct the delivery of optimal patient results. Increasing healthcare expenditures, increased patient expectations, and a movement to value-based care requires providers to improve healthcare interoperability. The lack of true interoperability among electronic systems is a major concern. While many hospitals are able to use their current EHRs for some information exchange activities that promote interoperability (such as finding, sending, or receiving information), only 23% of hospitals can perform all four information exchange activities (find, send, receive, and use).
Opportunities: Advancements in software technology for real-time data exchange
The capacity of different solutions to freely and readily communicate with one another is referred to as software interoperability. Interoperable systems exchange data in real time without the need for specialized IT assistance or behind-the-scenes code. It might be as simple as a customer relationship management (CRM) system that integrates deeply with automation software to generate a data flow between sales and marketing. Alternatively, the team may set up a whole tech stack comprised of interconnected apps that communicate data to stramline procedures. The purpose of software interoperability is to eliminate data silos. This is getting increasingly crucial as the number of platforms and applications used. Some of the trends in market are HL-7 FHIR, Big data, Deep interoperability, EHR integration.
Challenges: Increasing complexity due to lack of consistent data
The healthcare IT landscape has grown increasingly vast and complex, with each department in a healthcare facility having its own IT system, from emergency services to imaging, laboratories, and patient wards. With the sheer volume of healthcare data that a hospital generates on a daily basis, healthcare facilities all around the world are under pressure to enhance efficiency and patient outcomes. The proliferation of technologically complex medical equipment, hidden pockets of unstructured data, and a lack of system compatibility limit their capacity to do more with the data they collect. Making disparate medical systems interoperable and wrangling patient record data from siloed hospital departments is important for several reasons—extracting data from hidden siloes takes valuable time away from the patient. There is also the chance that critical data could be missed. Devices and systems that can connect with each other and share data have the potential to enable a 360-degree view of the patient’s health, allowing clinicians to make faster and more responsive decisions, which is behind the drive to prioritize interoperability in hospital IT systems.
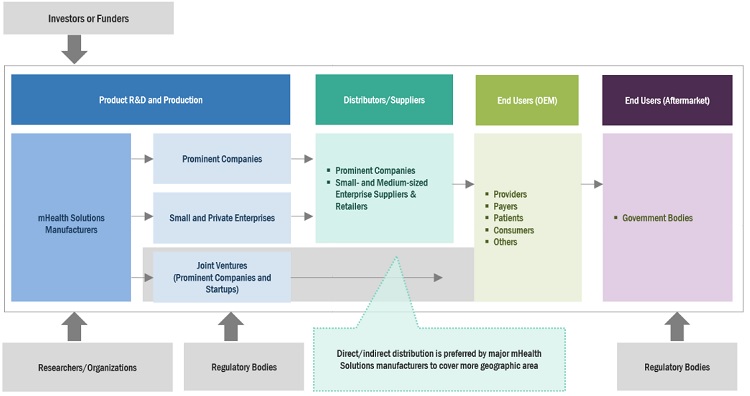
Healthcare Interoperability Solutions Market Ecosystem
Prominent companies in this market include well-established manufacturers and service providers of healthcare interoperability Solutions. These companies have been operating in the market for several years and possess a diversified product portfolio, organic & inorganic strategies, strong global sales and marketing networks. Prominent companies in this market include Oracle Health (US), Epic Systems Corporation (US), Infor, Inc. (US), InterSystems Corporation (US), Koninklijke Philips N.V. (Netherlands), Veradigm LLC (US), Cognizant (US), Change Healthcare (US), NextGen Healthcare, Inc. (US), Merative (US), Medical Information Technology, Inc. (US), and Lyniate (US).
Healthcare interoperability solutions Market Map
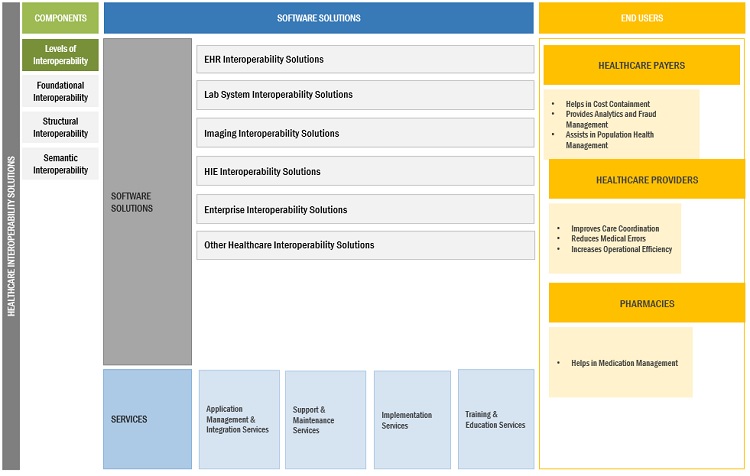
EHR interoperability solutions segment accounted for the largest share in the healthcare interoperability solutions market for software in 2021
On the basis of type, the EHR interoperability solutions segment accounted for the largest share in the market for software in 2021. The large share of the EHR interoperability solutions segment can be attributed to the large installed base of EHR solutions and the growing need to make these EHR systems interoperable to facilitate quick decision-making
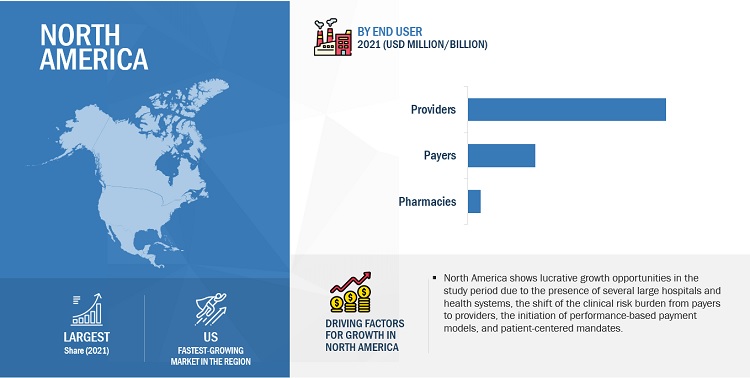
Healthcare providers is the largest end user segment in the healthcare interoperability solutions market in 2021
Based on end user, the healthcare providers segment is expected to register the highest CAGR during the forecast period. Factors responsible for the growth of this segment are increasing volume of patient data pertaining to increasing hospital enteries, shift towards quality-based care.
APAC region of healthcare interoperability solutions market to witness the highest growth rate during the forecast period.
The Asia Pacific market is projected to grow at the highest CAGR during the forecast period. Market growth in the APAC region is mainly driven by factors such as technological revolution in the region, growing penetration of smart gadgets, shift towards digitalization to ensure patient safety as well as streamline operationin healthcare enterprises, and various initiatives taken by developed countries in the region to unfold new policies and rework on the existing ones.
To know about the assumptions considered for the study, download the pdf brochure
The products and services market is dominated by a few globally established players such as Oracle Health (US), Epic Systems Corporation (US), Infor, Inc (US), InterSystems Corporation (US), Koninklijke Philips N.V. Veradigm LLC (US) Cognizant (US) Change Healthcare (US) NextGen Healthcare, Inc. (US) Merative (US) Medical Information Technology, Inc. (MEDITECH) (US) Lyniate (US) OSP Labs (US) Orion Health Group of Companies (New Zealand) Onyx Technology LLC (US) ViSolve (US) Jitterbit (US) iNTERFACEWARE Inc. (Canada) Virtusa Corp. (US) Consensus Cloud Solutions Inc. (US) MphRx (US) Wipro (India) eMids (US) Nalashaa (US) Deevita LLC (US)
Healthcare Interoperability Solutions Market Report Scope:
|
Report Metric |
Details |
|
Market size available for years |
2020–2027 |
|
Base year considered |
2021 |
|
Forecast period |
2022–2027 |
|
Forecast units |
Million/Billion (USD) |
|
Segments covered |
Type, level of Interoperability, software solution, end user, healthcare providers and region. |
|
Geographies covered |
North America, Europe, Asia Pacific, Latin America, and Middle East and Africa |
|
Companies covered |
Oracle Health (US), Epic Systems Corporation (US), Infor, Inc. (US), InterSystems Corporation (US), Koninklijke Philips N.V. (Netherlands), Veradigm LLC (US), Cognizant (US), Change Healthcare (US), NextGen Healthcare, Inc. (US), Merative (US), Medical Information Technology, Inc. (US), Lyniate (US), OSP Labs (US), Orion Health Group of Companies (New Zealand), Onyx Technology LLC (US). Some other players in the market include ViSolve (US), Jitterbit (US), iNTERFACEWARE Inc. (Canada), Virtusa Corp. (US), Consensus Cloud Solutions Inc. (US), MphRx (US), Wipro (India), eMids (US), Nalashaa (US), Deevita LLC (US). |
The study categorizes the healthcare interoperability solutions market based on product, type, technology, application, animal type, end user at regional and global level.
By Type
- Introduction
- Software Solutions
- Services
By Software Solutions
- Introduction
- EHR interoperability solutions
- Lab system interoperability solutions
- Imaging system interoperability solutions
- Healthcare information exchange interoperability solutions
- Enterprise interoperability solutions
- Other healthcare interoperability solutions.
By level of Interoperability
- Introduction
- Foundational Interoperability
- Structural Interoperability
- Semantic Interoperability
By End User
- Introduction
- Healthcare Providers
- Healthcare Payers
- Pharmacies
By Healthcare Providers
- Introduction
- Hospitals & Clinics
- Long-term Care centers
- Diagnostics & Imaging centers
- Other Healthcare Providers
By Region
-
North America
- US
- Canada
-
Europe
- UK
- Germany
- France
- Italy
- Netherlands
- Rest Of Europe
-
Asia Pacific
- Japan
- Australia
- Rest of APAC
- Latin America
- Middle East & Africa
Recent Developments
- In November 2022, Nextge Healthcare (US) acquired TSI Healthcare (US) to expand its presence in key specialties, including rheumatology, pulmonology, and cardiology.
- In October 2022, Lyniate (US) partnered with CyncHealth (US) to help healthcare providers and health networks, payers, and public health departments power more meaningful data exchange.
- In September 2022, Lyniate (US) partnered with BrightInsight (US) to improve Information Exchange for Regulated Digital Health Solutions Built on the BrightInsight Platform.
- In July 2022, Intersystem Corporation (US) partnered with Bedfordshire Hospitals NHS Foundation Trust to develop a new shared health and care record, which is being rolled out across Bedfordshire and Luton.
Frequently Asked Questions (FAQ):
What is the projected market value of the global healthcare interoperability solutions market?
The global market of healthcare interoperability solutions is projected to reach USD 6.2 billion.
What is the estimated growth rate (CAGR) of the global healthcare interoperability solutions market for the next five years?
The global healthcare interoperability solutions market in terms of revenue was estimated to be worth $3.4 billion in 2022 and is poised to grow at a CAGR of 12.9% from 2022 to 2027.
What are the major revenue pockets in the healthcare interoperability solutions market currently?
The Asia Pacific market is projected to grow at the highest CAGR during the forecast period. Market growth in the APAC region is mainly driven by factors such as technological revolution in the region, growing penetration of smart gadgets, shift towards digitalization to ensure patient safety as well as streamline operationin healthcare enterprises, and various initiatives taken by developed countries in the region to unfold new policies and rework on the existing ones.
To speak to our analyst for a discussion on the above findings, click Speak to Analyst


- 5.1 INTRODUCTION
-
5.2 MARKET DYNAMICSDRIVERS- Increasing demand for efficient and cost-effective healthcare delivery- Government initiatives and regulations to enhance patient care and safety- Emergence of new medical technologies- Growing adoption of electronic health recordsRESTRAINTS- Lack of accurate interoperability solutions across healthcare supply chain- Lack of standards and protocols in IT businesses- Use of outdated legacy systems in hospitals and clinic chainsOPPORTUNITIES- Growing markets for healthcare interoperability solutions in developing countries- Advancements in software technology for real-time data exchangeCHALLENGES- Increasing complexity due to lack of consistent data- Shortage of skilled healthcare IT professionals- Patient data security and privacy concerns in healthcare industry
- 5.3 PRICING ANALYSIS
- 5.4 VALUE CHAIN ANALYSIS
-
5.5 ECOSYSTEM ANALYSIS
-
5.6 TECHNOLOGY ANALYSISAPPLICATION PROGRAMMING INTERFACESCLOUD-BASED SOLUTIONSBLOCKCHAIN TECHNOLOGYFAST HEALTHCARE INTEROPERABILITY RESOURCESARTIFICIAL INTELLIGENCEMACHINE LEARNING
- 5.7 KEY CONFERENCES AND EVENTS IN 2023
-
5.8 REGULATORY ANALYSISREGULATORY BODIES, GOVERNMENT AGENCIES, AND OTHER ORGANIZATIONSLAWS, REGULATIONS, AND STANDARDS
- 5.9 PORTER'S FIVE FORCES ANALYSIS
-
5.10 KEY STAKEHOLDERS AND BUYING CRITERIAKEY STAKEHOLDERS IN BUYING PROCESSBUYING CRITERIA
- 6.1 INTRODUCTION
-
6.2 SOFTWARE SOLUTIONSEHR INTEROPERABILITY SOLUTIONS- Large installation base of EHR systems to ensure single and continuous readable documents for physiciansLAB SYSTEM INTEROPERABILITY SOLUTIONS- Increasing cost of operations and decreasing reimbursements for laboratory services to boost marketIMAGING SYSTEM INTEROPERABILITY SOLUTIONS- Rising need for data interoperability and increasing usage of smart devices to drive marketHIE INTEROPERABILITY SOLUTIONS- Large investments by federal governments to propel marketENTERPRISE INTEROPERABILITY SOLUTIONS- Advancing software technology and rising demand for expanded care delivery to augment marketOTHER HEALTHCARE INTEROPERABILITY SOLUTIONS
-
6.3 SERVICESINCREASING ADOPTION OF HEALTHCARE IT INTEGRATION SERVICES BY PROVIDERS TO AUGMENT MARKET
- 7.1 INTRODUCTION
-
7.2 FOUNDATIONAL INTEROPERABILITYNEED FOR SAFE AND ACCURATE DATA EXCHANGE ACROSS DISPARATE SYSTEMS TO FUEL MARKET
-
7.3 STRUCTURAL INTEROPERABILITYSTRUCTURAL INTEROPERABILITY TO ENSURE INTERPRETATION OF DATA EXCHANGE BETWEEN SYSTEMS AT DATA FIELD LEVEL
-
7.4 SEMANTIC INTEROPERABILITYSEMANTIC INTEROPERABILITY TO REGISTER HIGHEST GROWTH DURING FORECAST PERIOD
- 8.1 INTRODUCTION
-
8.2 HEALTHCARE PROVIDERSHOSPITALS & CLINICS- Increasing patient volume and rising need to reduce errors in data management to augment marketLONG-TERM CARE CENTERS- Increasing number of care centers and need to maintain compliance with medical reforms to propel marketDIAGNOSTIC & IMAGING CENTERS- Increasing volume of clinical data and need to streamline imaging workflows to drive marketOTHER HEALTHCARE PROVIDERS
-
8.3 HEALTHCARE PAYERSADOPTION OF HEALTHCARE INTEROPERABILITY BY PAYERS TO DECREASE HOSPITAL STAYS AND REPEAT TESTS
-
8.4 PHARMACIESPHARMACIES TO USE HEALTHCARE INFORMATION EXCHANGE SOLUTIONS FOR INDIVIDUALIZED PATIENT CARE AND SUPPORT
- 9.1 INTRODUCTION
-
9.2 NORTH AMERICAUS- Growing need to curtail healthcare costs to drive marketCANADA- Increasing healthcare digitization to support market
-
9.3 EUROPEGERMANY- Modernized healthcare system and increased healthcare expenditure to augment marketUK- Government initiatives and NHS programs to drive demandFRANCE- Government measures to curtail healthcare expenditures to fuel marketITALY- Increasing government initiatives in HCIT technology implementation to aid marketNETHERLANDS- Robust healthcare infrastructure and eHealth initiatives to propel marketREST OF EUROPE
-
9.4 ASIA PACIFICJAPAN- Japan to be largest healthcare interoperability market in Asia Pacific during forecast periodAUSTRALIA- Increasing government initiatives for better clinical communication to drive marketREST OF ASIA PACIFIC
-
9.5 LATIN AMERICAIMPLEMENTATION OF FAVORABLE GOVERNMENT INITIATIVES TO DRIVE MARKET
-
9.6 MIDDLE EAST & AFRICAINCREASED ESTABLISHMENT OF NEW HOSPITALS TO DRIVE MARKET

- 10.1 INTRODUCTION
- 10.2 KEY STRATEGIES ADOPTED BY PLAYERS IN HEALTHCARE INTEROPERABILITY SOLUTIONS MARKET
- 10.3 MARKET RANKING OF KEY PLAYERS IN HEALTHCARE INTEROPERABILITY SOLUTIONS MARKET
-
10.4 MARKET SHARE ANALYSISHEALTHCARE INTEROPERABILITY SOLUTIONS MARKET
-
10.5 COMPETITIVE EVALUATION QUADRANT FOR KEY PLAYERSSTARSEMERGING LEADERSPERVASIVE PLAYERSPARTICIPANTS
-
10.6 COMPETITIVE EVALUATION QUADRANT FOR START-UPS/SMESPROGRESSIVE COMPANIESDYNAMIC COMPANIESSTARTING BLOCKSRESPONSIVE COMPANIES
-
10.7 COMPETITIVE BENCHMARKINGPRODUCT FOOTPRINT OF PLAYERS IN HEALTHCARE INTEROPERABILITY SOLUTIONS MARKETREGIONAL FOOTPRINT OF PLAYERS IN HEALTHCARE INTEROPERABILITY SOLUTIONS MARKETFOOTPRINT OF PLAYERS IN HEALTHCARE INTEROPERABILITY SOLUTIONS MARKET
-
10.8 COMPETITIVE SCENARIOKEY PRODUCT/SERVICE LAUNCHES AND APPROVALSKEY DEALS
-
11.1 KEY PLAYERSORACLE HEALTH- Business overview- Products/Services/Solutions offered- Recent developments- MnM viewEPIC SYSTEMS CORPORATION- Business overview- Products/Services/Solutions offered- Recent developments- MnM viewINFOR, INC.- Business overview- Products/Services/Solutions offered- Recent developmentsINTERSYSTEMS CORPORATION- Business overview- Products/Services/Solutions offered- Recent developments- MnM viewKONINKLIJKE PHILIPS N.V.- Business overview- Products/Services/Solutions offered- Recent developments- MnM viewVERADIGM LLC- Business overview- Products/Services/Solutions offered- Recent developments- MnM viewCOGNIZANT- Business overview- Products/Services/Solutions offered- Recent developmentsCHANGE HEALTHCARE- Business overview- Products/Services/Solutions offered- Recent developmentsNEXTGEN HEALTHCARE, INC.- Business overview- Products/Services/Solutions offered- Recent developmentsMERATIVE- Business overview- Products/Services/Solutions offered- Recent developmentsMEDICAL INFORMATION TECHNOLOGY, INC.- Business overview- Products/Services/Solutions offeredLYNIATE- Business overview- Products/Services/Solutions offered- Recent developmentsOSP LABS- Business overview- Products/Services/Solutions offeredORION HEALTH GROUP OF COMPANIES- Business overview- Products/Services/Solutions offeredONYX TECHNOLOGY LLC- Business overview- Products/Services/Solutions offered- Recent developments
-
11.2 OTHER PLAYERSVISOLVE- Business overview- Products/Services/Solutions offeredJITTERBIT- Business overview- Products/Services/Solutions offeredINTERFACEWARE INC.- Business overview- Products/Services/Solutions offeredVIRTUSA CORP.- Business overview- Products/Services/Solutions offered- Recent developmentsCONSENSUS CLOUD SOLUTIONS INC.- Business overview- Products/Services/Solutions offered- Recent developmentsMPHRXWIPROEMIDSNALASHAADEEVITA LLC
- 12.1 DISCUSSION GUIDE
- 12.2 KNOWLEDGESTORE: MARKETSANDMARKETS’ SUBSCRIPTION PORTAL
- 12.3 CUSTOMIZATION OPTIONS
- 12.4 RELATED REPORTS
- 12.5 AUTHOR DETAILS
- TABLE 1 RISK ASSESSMENT: HEALTHCARE INTEROPERABILITY SOLUTIONS MARKET
- TABLE 2 HEALTHCARE INTEROPERABILITY SOLUTIONS MARKET: DETAILED LIST OF CONFERENCES AND EVENTS IN 2023
- TABLE 3 NORTH AMERICA: LIST OF REGULATORY BODIES, GOVERNMENT AGENCIES, AND OTHER ORGANIZATIONS
- TABLE 4 EUROPE: LIST OF REGULATORY BODIES, GOVERNMENT AGENCIES, AND OTHER ORGANIZATIONS
- TABLE 5 ASIA PACIFIC: LIST OF REGULATORY BODIES, GOVERNMENT AGENCIES, AND OTHER ORGANIZATIONS
- TABLE 6 REST OF THE WORLD: LIST OF REGULATORY BODIES, GOVERNMENT AGENCIES, AND OTHER ORGANIZATIONS
- TABLE 7 KEY REGULATIONS AND STANDARDS GOVERNING HEALTHCARE INTEROPERABILITY TECHNOLOGIES GLOBALLY
- TABLE 8 HEALTHCARE INTEROPERABILITY SOLUTIONS MARKET: PORTER’S FIVE FORCES ANALYSIS
- TABLE 9 INFLUENCE OF STAKEHOLDERS ON BUYING PROCESS FOR TOP 3 APPLICATIONS (%)
- TABLE 10 KEY BUYING CRITERIA FOR TOP 3 APPLICATIONS
- TABLE 11 HEALTHCARE INTEROPERABILITY SOLUTIONS MARKET, BY TYPE, 2020–2027 (USD MILLION)
- TABLE 12 HEALTHCARE INTEROPERABILITY SOLUTIONS MARKET FOR SOFTWARE SOLUTIONS, BY TYPE, 2020–2027 (USD MILLION)
- TABLE 13 HEALTHCARE INTEROPERABILITY SOLUTIONS MARKET FOR SOFTWARE SOLUTIONS, BY COUNTRY, 2020–2027 (USD MILLION)
- TABLE 14 EHR INTEROPERABILITY SOLUTIONS OFFERED BY KEY PLAYERS
- TABLE 15 EHR INTEROPERABILITY SOLUTIONS MARKET, BY COUNTRY, 2020–2027 (USD MILLION)
- TABLE 16 LAB SYSTEM INTEROPERABILITY SOLUTIONS OFFERED BY KEY PLAYERS
- TABLE 17 LAB SYSTEM INTEROPERABILITY SOLUTIONS MARKET, BY COUNTRY, 2020–2027 (USD MILLION)
- TABLE 18 IMAGING SYSTEM INTEROPERABILITY SOLUTIONS OFFERED BY KEY PLAYERS
- TABLE 19 IMAGING SYSTEM INTEROPERABILITY SOLUTIONS MARKET, BY COUNTRY, 2020–2027 (USD MILLION)
- TABLE 20 HIE INTEROPERABILITY SOLUTIONS OFFERED BY KEY PLAYERS
- TABLE 21 HIE INTEROPERABILITY SOLUTIONS MARKET, BY COUNTRY, 2020–2027 (USD MILLION)
- TABLE 22 ENTERPRISE INTEROPERABILITY SOLUTIONS OFFERED BY KEY PLAYERS
- TABLE 23 ENTERPRISE INTEROPERABILITY SOLUTIONS MARKET, BY COUNTRY, 2020–2027 (USD MILLION)
- TABLE 24 OTHER HEALTHCARE INTEROPERABILITY SOLUTIONS OFFERED BY KEY PLAYERS
- TABLE 25 OTHER HEALTHCARE INTEROPERABILITY SOLUTIONS MARKET, BY COUNTRY, 2020–2027 (USD MILLION)
- TABLE 26 SERVICES OFFERED BY KEY PLAYERS
- TABLE 27 HEALTHCARE INTEROPERABILITY SOLUTIONS MARKET FOR SERVICES, BY COUNTRY, 2020–2027 (USD MILLION)
- TABLE 28 HEALTHCARE INTEROPERABILITY SOLUTIONS MARKET, BY INTEROPERABILITY LEVEL, 2020–2027 (USD MILLION)
- TABLE 29 HEALTHCARE INTEROPERABILITY SOLUTIONS MARKET FOR FOUNDATIONAL INTEROPERABILITY, BY COUNTRY, 2020–2027 (USD MILLION)
- TABLE 30 HEALTHCARE INTEROPERABILITY SOLUTIONS MARKET FOR STRUCTURAL INTEROPERABILITY, BY COUNTRY, 2020–2027 (USD MILLION)
- TABLE 31 HEALTHCARE INTEROPERABILITY SOLUTIONS MARKET FOR SEMANTIC INTEROPERABILITY, BY COUNTRY, 2020–2027 (USD MILLION)
- TABLE 32 HEALTHCARE INTEROPERABILITY SOLUTIONS MARKET, BY END USER, 2020–2027 (USD MILLION)
- TABLE 33 HEALTHCARE INTEROPERABILITY SOLUTIONS MARKET FOR HEALTHCARE PROVIDERS, BY TYPE, 2020–2027 (USD MILLION)
- TABLE 34 HEALTHCARE INTEROPERABILITY SOLUTIONS MARKET FOR HEALTHCARE PROVIDERS, BY COUNTRY, 2020–2027 (USD MILLION)
- TABLE 35 HOSPITALS & CLINICS MARKET, BY COUNTRY, 2020–2027 (USD MILLION)
- TABLE 36 LONG-TERM CARE CENTERS MARKET, BY COUNTRY, 2020–2027 (USD MILLION)
- TABLE 37 DIAGNOSTIC & IMAGING CENTERS MARKET, BY COUNTRY, 2020–2027 (USD MILLION)
- TABLE 38 OTHER HEALTHCARE PROVIDERS MARKET, BY COUNTRY, 2020–2027 (USD MILLION)
- TABLE 39 HEALTHCARE INTEROPERABILITY SOLUTIONS MARKET FOR HEALTHCARE PAYERS, BY COUNTRY, 2020–2027 (USD MILLION)
- TABLE 40 HEALTHCARE INTEROPERABILITY SOLUTIONS MARKET FOR PHARMACIES, BY COUNTRY, 2020–2027 (USD MILLION)
- TABLE 41 HEALTHCARE INTEROPERABILITY SOLUTIONS MARKET, BY REGION, 2020–2027 (USD MILLION)
- TABLE 42 NORTH AMERICA: HEALTHCARE INTEROPERABILITY SOLUTIONS MARKET, BY COUNTRY, 2020–2027 (USD MILLION)
- TABLE 43 NORTH AMERICA: HEALTHCARE INTEROPERABILITY SOLUTIONS MARKET, BY TYPE, 2020–2027 (USD MILLION)
- TABLE 44 NORTH AMERICA: HEALTHCARE INTEROPERABILITY SOLUTIONS MARKET FOR SOFTWARE SOLUTIONS, BY TYPE, 2020–2027 (USD MILLION)
- TABLE 45 NORTH AMERICA: HEALTHCARE INTEROPERABILITY SOLUTIONS MARKET, BY INTEROPERABILITY LEVEL, 2020–2027 (USD MILLION)
- TABLE 46 NORTH AMERICA: HEALTHCARE INTEROPERABILITY SOLUTIONS MARKET, BY END USER, 2020–2027 (USD MILLION)
- TABLE 47 NORTH AMERICA: HEALTHCARE INTEROPERABILITY SOLUTIONS MARKET FOR HEALTHCARE PROVIDERS, BY TYPE, 2020–2027 (USD MILLION)
- TABLE 48 US: KEY MACROINDICATORS
- TABLE 49 US: HEALTHCARE INTEROPERABILITY SOLUTIONS MARKET, BY TYPE, 2020–2027 (USD MILLION)
- TABLE 50 US: HEALTHCARE INTEROPERABILITY SOLUTIONS MARKET FOR SOFTWARE SOLUTIONS, BY TYPE, 2020–2027 (USD MILLION)
- TABLE 51 US: HEALTHCARE INTEROPERABILITY SOLUTIONS MARKET, BY INTEROPERABILITY LEVEL, 2020–2027 (USD MILLION)
- TABLE 52 US: HEALTHCARE INTEROPERABILITY SOLUTIONS MARKET, BY END USER, 2020–2027 (USD MILLION)
- TABLE 53 US: HEALTHCARE INTEROPERABILITY SOLUTIONS MARKET FOR HEALTHCARE PROVIDERS, BY TYPE, 2020–2027 (USD MILLION)
- TABLE 54 CANADA: KEY MACROINDICATORS
- TABLE 55 CANADA: HEALTHCARE INTEROPERABILITY SOLUTIONS MARKET, BY TYPE, 2020–2027 (USD MILLION)
- TABLE 56 CANADA: HEALTHCARE INTEROPERABILITY SOLUTIONS MARKET FOR SOFTWARE SOLUTIONS, BY TYPE, 2020–2027 (USD MILLION)
- TABLE 57 CANADA: HEALTHCARE INTEROPERABILITY SOLUTIONS MARKET, BY INTEROPERABILITY LEVEL, 2020–2027 (USD MILLION)
- TABLE 58 CANADA: HEALTHCARE INTEROPERABILITY SOLUTIONS MARKET, BY END USER, 2020–2027 (USD MILLION)
- TABLE 59 CANADA: HEALTHCARE INTEROPERABILITY SOLUTIONS MARKET FOR HEALTHCARE PROVIDERS, BY TYPE, 2020–2027 (USD MILLION)
- TABLE 60 EUROPE: HEALTHCARE INTEROPERABILITY SOLUTIONS MARKET, BY COUNTRY, 2020–2027 (USD MILLION)
- TABLE 61 EUROPE: HEALTHCARE INTEROPERABILITY SOLUTIONS MARKET, BY TYPE, 2020–2027 (USD MILLION)
- TABLE 62 EUROPE: HEALTHCARE INTEROPERABILITY SOLUTIONS MARKET FOR SOFTWARE SOLUTIONS, BY TYPE, 2020–2027 (USD MILLION)
- TABLE 63 EUROPE: HEALTHCARE INTEROPERABILITY SOLUTIONS MARKET, BY INTEROPERABILITY LEVEL, 2020–2027 (USD MILLION)
- TABLE 64 EUROPE: HEALTHCARE INTEROPERABILITY SOLUTIONS MARKET, BY END USER, 2020–2027 (USD MILLION)
- TABLE 65 EUROPE: HEALTHCARE INTEROPERABILITY SOLUTIONS MARKET FOR HEALTHCARE PROVIDERS, BY TYPE, 2020–2027 (USD MILLION)
- TABLE 66 GERMANY: KEY MACROINDICATORS
- TABLE 67 GERMANY: HEALTHCARE INTEROPERABILITY SOLUTIONS MARKET, BY TYPE, 2020–2027 (USD MILLION)
- TABLE 68 GERMANY: HEALTHCARE INTEROPERABILITY SOLUTIONS MARKET FOR SOFTWARE SOLUTIONS, BY TYPE, 2020–2027 (USD MILLION)
- TABLE 69 GERMANY: HEALTHCARE INTEROPERABILITY SOLUTIONS MARKET, BY INTEROPERABILITY LEVEL, 2020–2027 (USD MILLION)
- TABLE 70 GERMANY: HEALTHCARE INTEROPERABILITY SOLUTIONS MARKET, BY END USER, 2020–2027 (USD MILLION)
- TABLE 71 GERMANY: HEALTHCARE INTEROPERABILITY SOLUTIONS MARKET FOR HEALTHCARE PROVIDERS, BY TYPE, 2020–2027 (USD MILLION)
- TABLE 72 UK: KEY MACROINDICATORS
- TABLE 73 UK: HEALTHCARE INTEROPERABILITY SOLUTIONS MARKET, BY TYPE, 2020–2027 (USD MILLION)
- TABLE 74 UK: HEALTHCARE INTEROPERABILITY SOLUTIONS MARKET FOR SOFTWARE SOLUTIONS, BY TYPE, 2020–2027 (USD MILLION)
- TABLE 75 UK: HEALTHCARE INTEROPERABILITY SOLUTIONS MARKET, BY INTEROPERABILITY LEVEL, 2020–2027 (USD MILLION)
- TABLE 76 UK: HEALTHCARE INTEROPERABILITY SOLUTIONS MARKET, BY END USER, 2020–2027 (USD MILLION)
- TABLE 77 UK: HEALTHCARE INTEROPERABILITY SOLUTIONS MARKET FOR HEALTHCARE PROVIDERS, BY TYPE, 2020–2027 (USD MILLION)
- TABLE 78 FRANCE: KEY MACROINDICATORS
- TABLE 79 FRANCE: HEALTHCARE INTEROPERABILITY SOLUTIONS MARKET, BY TYPE, 2020–2027 (USD MILLION)
- TABLE 80 FRANCE: HEALTHCARE INTEROPERABILITY SOLUTIONS MARKET FOR SOFTWARE SOLUTIONS, BY TYPE, 2020–2027 (USD MILLION)
- TABLE 81 FRANCE: HEALTHCARE INTEROPERABILITY SOLUTIONS MARKET, BY INTEROPERABILITY LEVEL, 2020–2027 (USD MILLION)
- TABLE 82 FRANCE: HEALTHCARE INTEROPERABILITY SOLUTIONS MARKET, BY END USER, 2020–2027 (USD MILLION)
- TABLE 83 FRANCE: HEALTHCARE INTEROPERABILITY SOLUTIONS MARKET FOR HEALTHCARE PROVIDERS, BY TYPE, 2020–2027 (USD MILLION)
- TABLE 84 ITALY: KEY MACROINDICATORS
- TABLE 85 ITALY: HEALTHCARE INTEROPERABILITY SOLUTIONS MARKET, BY TYPE, 2020–2027 (USD MILLION)
- TABLE 86 ITALY: HEALTHCARE INTEROPERABILITY SOLUTIONS MARKET FOR SOFTWARE SOLUTIONS, BY TYPE, 2020–2027 (USD MILLION)
- TABLE 87 ITALY: HEALTHCARE INTEROPERABILITY SOLUTIONS MARKET, BY INTEROPERABILITY LEVEL, 2020–2027 (USD MILLION)
- TABLE 88 ITALY: HEALTHCARE INTEROPERABILITY SOLUTIONS MARKET, BY END USER, 2020–2027 (USD MILLION)
- TABLE 89 ITALY: HEALTHCARE INTEROPERABILITY SOLUTIONS MARKET FOR HEALTHCARE PROVIDERS, BY TYPE, 2020–2027 (USD MILLION)
- TABLE 90 NETHERLANDS: KEY MACROINDICATORS
- TABLE 91 NETHERLANDS: HEALTHCARE INTEROPERABILITY SOLUTIONS MARKET, BY TYPE, 2020–2027 (USD MILLION)
- TABLE 92 NETHERLANDS: HEALTHCARE INTEROPERABILITY SOLUTIONS MARKET FOR SOFTWARE SOLUTIONS, BY TYPE, 2020–2027 (USD MILLION)
- TABLE 93 NETHERLANDS: HEALTHCARE INTEROPERABILITY SOLUTIONS MARKET, BY INTEROPERABILITY LEVEL, 2020–2027 (USD MILLION)
- TABLE 94 NETHERLANDS: HEALTHCARE INTEROPERABILITY SOLUTIONS MARKET, BY END USER, 2020–2027 (USD MILLION)
- TABLE 95 NETHERLANDS: HEALTHCARE INTEROPERABILITY SOLUTIONS MARKET FOR HEALTHCARE PROVIDERS, BY TYPE, 2020–2027 (USD MILLION)
- TABLE 96 REST OF EUROPE: HEALTHCARE INTEROPERABILITY SOLUTIONS MARKET, BY TYPE, 2020–2027 (USD MILLION)
- TABLE 97 REST OF EUROPE: HEALTHCARE INTEROPERABILITY SOLUTIONS MARKET FOR SOFTWARE SOLUTIONS, BY TYPE, 2020–2027 (USD MILLION)
- TABLE 98 REST OF EUROPE: HEALTHCARE INTEROPERABILITY SOLUTIONS MARKET, BY INTEROPERABILITY LEVEL, 2020–2027 (USD MILLION)
- TABLE 99 REST OF EUROPE: HEALTHCARE INTEROPERABILITY SOLUTIONS MARKET, BY END USER, 2020–2027 (USD MILLION)
- TABLE 100 REST OF EUROPE: HEALTHCARE INTEROPERABILITY SOLUTIONS MARKET FOR HEALTHCARE PROVIDERS, BY TYPE, 2020–2027 (USD MILLION)
- TABLE 101 ASIA PACIFIC: HEALTHCARE INTEROPERABILITY SOLUTIONS MARKET, BY COUNTRY, 2020–2027 (USD MILLION)
- TABLE 102 ASIA PACIFIC: HEALTHCARE INTEROPERABILITY SOLUTIONS MARKET, BY TYPE, 2020–2027 (USD MILLION)
- TABLE 103 ASIA PACIFIC: HEALTHCARE INTEROPERABILITY SOLUTIONS MARKET FOR SOFTWARE SOLUTIONS, BY TYPE, 2020–2027 (USD MILLION)
- TABLE 104 ASIA PACIFIC: HEALTHCARE INTEROPERABILITY SOLUTIONS MARKET, BY INTEROPERABILITY LEVEL, 2020–2027 (USD MILLION)
- TABLE 105 ASIA PACIFIC: HEALTHCARE INTEROPERABILITY SOLUTIONS MARKET, BY END USER, 2020–2027 (USD MILLION)
- TABLE 106 ASIA PACIFIC: HEALTHCARE INTEROPERABILITY SOLUTIONS MARKET FOR HEALTHCARE PROVIDERS, BY TYPE, 2020–2027 (USD MILLION)
- TABLE 107 JAPAN: KEY MACROINDICATORS
- TABLE 108 JAPAN: HEALTHCARE INTEROPERABILITY SOLUTIONS MARKET, BY TYPE, 2020–2027 (USD MILLION)
- TABLE 109 JAPAN: HEALTHCARE INTEROPERABILITY SOLUTIONS MARKET FOR SOFTWARE SOLUTIONS, BY TYPE, 2020–2027 (USD MILLION)
- TABLE 110 JAPAN: HEALTHCARE INTEROPERABILITY SOLUTIONS MARKET, BY INTEROPERABILITY LEVEL, 2020–2027 (USD MILLION)
- TABLE 111 JAPAN: HEALTHCARE INTEROPERABILITY SOLUTIONS MARKET, BY END USER, 2020–2027 (USD MILLION)
- TABLE 112 JAPAN: HEALTHCARE INTEROPERABILITY SOLUTIONS MARKET FOR HEALTHCARE PROVIDERS, BY TYPE, 2020–2027 (USD MILLION)
- TABLE 113 AUSTRALIA: KEY MACROINDICATORS
- TABLE 114 AUSTRALIA: HEALTHCARE INTEROPERABILITY SOLUTIONS MARKET, BY TYPE, 2020–2027 (USD MILLION)
- TABLE 115 AUSTRALIA: HEALTHCARE INTEROPERABILITY SOLUTIONS MARKET FOR SOFTWARE SOLUTIONS, BY TYPE, 2020–2027 (USD MILLION)
- TABLE 116 AUSTRALIA: HEALTHCARE INTEROPERABILITY SOLUTIONS MARKET, BY INTEROPERABILITY LEVEL, 2020–2027 (USD MILLION)
- TABLE 117 AUSTRALIA: HEALTHCARE INTEROPERABILITY SOLUTIONS MARKET, BY END USER, 2020–2027 (USD MILLION)
- TABLE 118 AUSTRALIA: HEALTHCARE INTEROPERABILITY SOLUTIONS MARKET FOR HEALTHCARE PROVIDERS, BY TYPE, 2020–2027 (USD MILLION)
- TABLE 119 REST OF ASIA PACIFIC: HEALTHCARE INTEROPERABILITY SOLUTIONS MARKET, BY TYPE, 2020–2027 (USD MILLION)
- TABLE 120 REST OF ASIA PACIFIC: HEALTHCARE INTEROPERABILITY SOLUTIONS MARKET FOR SOFTWARE SOLUTIONS, BY TYPE, 2020–2027 (USD MILLION)
- TABLE 121 REST OF ASIA PACIFIC: HEALTHCARE INTEROPERABILITY SOLUTIONS MARKET, BY INTEROPERABILITY LEVEL, 2020–2027 (USD MILLION)
- TABLE 122 REST OF ASIA PACIFIC: HEALTHCARE INTEROPERABILITY SOLUTIONS MARKET, BY END USER, 2020–2027 (USD MILLION)
- TABLE 123 REST OF ASIA PACIFIC: HEALTHCARE INTEROPERABILITY SOLUTIONS MARKET FOR HEALTHCARE PROVIDERS, BY TYPE, 2020–2027 (USD MILLION)
- TABLE 124 LATIN AMERICA: HEALTHCARE INTEROPERABILITY SOLUTIONS MARKET, BY TYPE, 2020–2027 (USD MILLION)
- TABLE 125 LATIN AMERICA: HEALTHCARE INTEROPERABILITY SOLUTIONS MARKET FOR SOFTWARE SOLUTIONS, BY TYPE, 2020–2027 (USD MILLION)
- TABLE 126 LATIN AMERICA: HEALTHCARE INTEROPERABILITY SOLUTIONS MARKET, BY INTEROPERABILITY LEVEL, 2020–2027 (USD MILLION)
- TABLE 127 LATIN AMERICA: HEALTHCARE INTEROPERABILITY SOLUTIONS MARKET, BY END USER, 2020–2027 (USD MILLION)
- TABLE 128 LATIN AMERICA: HEALTHCARE INTEROPERABILITY SOLUTIONS MARKET FOR HEALTHCARE PROVIDERS, BY TYPE, 2020–2027 (USD MILLION)
- TABLE 129 MIDDLE EAST & AFRICA: HEALTHCARE INTEROPERABILITY SOLUTIONS MARKET, BY TYPE, 2020–2027 (USD MILLION)
- TABLE 130 MIDDLE EAST & AFRICA: HEALTHCARE INTEROPERABILITY SOLUTIONS MARKET FOR SOFTWARE SOLUTIONS, BY TYPE, 2020–2027 (USD MILLION)
- TABLE 131 MIDDLE EAST & AFRICA: HEALTHCARE INTEROPERABILITY SOLUTIONS MARKET, BY INTEROPERABILITY LEVEL, 2020–2027 (USD MILLION)
- TABLE 132 MIDDLE EAST & AFRICA: HEALTHCARE INTEROPERABILITY SOLUTIONS MARKET, BY END USER, 2020–2027 (USD MILLION)
- TABLE 133 MIDDLE EAST & AFRICA: HEALTHCARE INTEROPERABILITY SOLUTIONS MARKET FOR HEALTHCARE PROVIDERS, BY TYPE, 2020–2027 (USD MILLION)
- TABLE 134 HEALTHCARE INTEROPERABILITY SOLUTIONS MARKET: KEY DEVELOPMENTS (JANUARY 2019–MARCH 2023)
- TABLE 135 HEALTHCARE INTEROPERABILITY SOLUTIONS MARKET SHARE, BY KEY PLAYER, 2021
- TABLE 136 COMPANY PRODUCT FOOTPRINT
- TABLE 137 COMPANY REGION FOOTPRINT
- TABLE 138 COMPANY FOOTPRINT
- TABLE 139 KEY PRODUCT/SERVICE LAUNCHES AND APPROVALS, 2019–2022
- TABLE 140 KEY DEALS, 2019–2022
- TABLE 141 ORACLE HEALTH: COMPANY OVERVIEW
- TABLE 142 EPIC SYSTEMS CORPORATION: COMPANY OVERVIEW
- TABLE 143 INFOR, INC.: COMPANY OVERVIEW
- TABLE 144 INTERSYSTEMS CORPORATION: COMPANY OVERVIEW
- TABLE 145 KONINKLIJKE PHILIPS N.V.: COMPANY OVERVIEW
- TABLE 146 VERADIGM LLC: COMPANY OVERVIEW
- TABLE 147 COGNIZANT: COMPANY OVERVIEW
- TABLE 148 CHANGE HEALTHCARE: COMPANY OVERVIEW
- TABLE 149 NEXTGEN HEALTHCARE, INC.: COMPANY OVERVIEW
- TABLE 150 MERATIVE: COMPANY OVERVIEW
- TABLE 151 MEDICAL INFORMATION TECHNOLOGY, INC.: COMPANY OVERVIEW
- TABLE 152 LYNIATE: COMPANY OVERVIEW
- TABLE 153 OSP LABS: COMPANY OVERVIEW
- TABLE 154 ORION HEALTH GROUP OF COMPANIES: COMPANY OVERVIEW
- TABLE 155 ONYX TECHNOLOGY LLC: COMPANY OVERVIEW
- TABLE 156 VISOLVE: COMPANY OVERVIEW
- TABLE 157 JITTERBIT: COMPANY OVERVIEW
- TABLE 158 INTERFACEWARE INC.: COMPANY OVERVIEW
- TABLE 159 VIRTUSA CORP.: COMPANY OVERVIEW
- TABLE 160 CONSENSUS CLOUD SOLUTIONS INC.: COMPANY OVERVIEW
- FIGURE 1 HEALTHCARE INTEROPERABILITY SOLUTIONS MARKET, BY REGION
- FIGURE 2 RESEARCH DESIGN
- FIGURE 3 BREAKDOWN OF PRIMARY INTERVIEWS: BY COMPANY TYPE, DESIGNATION, AND REGION
- FIGURE 4 SUPPLY-SIDE MARKET SIZE ESTIMATION: REVENUE SHARE ANALYSIS
- FIGURE 5 CAGR PROJECTIONS: HEALTHCARE INTEROPERABILITY SOLUTIONS MARKET
- FIGURE 6 DATA TRIANGULATION METHODOLOGY
- FIGURE 7 HEALTHCARE INTEROPERABILITY SOLUTIONS MARKET, BY TYPE, 2022 VS. 2027 (USD MILLION)
- FIGURE 8 HEALTHCARE INTEROPERABILITY SOLUTIONS MARKET FOR SOFTWARE SOLUTIONS, BY TYPE, 2022 VS. 2027 (USD MILLION)
- FIGURE 9 HEALTHCARE INTEROPERABILITY SOLUTIONS MARKET, BY INTEROPERABILITY LEVEL, 2022 VS. 2027 (USD MILLION)
- FIGURE 10 HEALTHCARE INTEROPERABILITY SOLUTIONS MARKET, BY END USER, 2022 VS. 2027 (USD MILLION)
- FIGURE 11 GEOGRAPHICAL SNAPSHOT OF HEALTHCARE INTEROPERABILITY SOLUTIONS MARKET
- FIGURE 12 GOVERNMENT INITIATIVES FOR ENHANCED PATIENT CARE AND SAFETY TO DRIVE MARKET
- FIGURE 13 SERVICES SEGMENT ACCOUNTED FOR LARGEST SHARE OF ASIA PACIFIC HEALTHCARE INTEROPERABILITY SOLUTIONS MARKET IN 2021
- FIGURE 14 ASIA PACIFIC TO GROW AT HIGHEST CAGR DURING FORECAST PERIOD
- FIGURE 15 NORTH AMERICA TO DOMINATE HEALTHCARE INTEROPERABILITY SOLUTIONS MARKET DURING FORECAST PERIOD
- FIGURE 16 DEVELOPING MARKETS TO REGISTER HIGHER GROWTH RATES DURING FORECAST PERIOD
- FIGURE 17 HEALTHCARE INTEROPERABILITY SOLUTIONS MARKET: DRIVERS, RESTRAINTS, OPPORTUNITIES, AND CHALLENGES
- FIGURE 18 VALUE CHAIN ANALYSIS OF HEALTHCARE INTEROPERABILITY SOLUTIONS MARKET
- FIGURE 19 ECOSYSTEM ANALYSIS OF HEALTHCARE INTEROPERABILITY SOLUTIONS MARKET
- FIGURE 20 PORTER’S FIVE FORCES ANALYSIS IN HEALTHCARE INTEROPERABILITY SOLUTIONS MARKET
- FIGURE 21 INFLUENCE OF STAKEHOLDERS ON BUYING PROCESS FOR TOP 3 APPLICATIONS
- FIGURE 22 KEY BUYING CRITERIA FOR TOP 3 APPLICATIONS
- FIGURE 23 NORTH AMERICA: HEALTHCARE INTEROPERABILITY SOLUTIONS MARKET SNAPSHOT
- FIGURE 24 ASIA PACIFIC: HEALTHCARE INTEROPERABILITY SOLUTIONS MARKET SNAPSHOT
- FIGURE 25 HEALTHCARE INTEROPERABILITY SOLUTIONS MARKET: MARKET RANKING OF KEY PLAYERS (2022)
- FIGURE 26 HEALTHCARE INTEROPERABILITY SOLUTIONS MARKET: COMPETITIVE LEADERSHIP MAPPING (2022)
- FIGURE 27 HEALTHCARE INTEROPERABILITY SOLUTIONS MARKET: COMPETITIVE LEADERSHIP MAPPING FOR START-UPS/SMES (2022)
- FIGURE 28 ORACLE HEALTH: COMPANY SNAPSHOT (2021)
- FIGURE 29 INFOR, INC.: COMPANY SNAPSHOT (2019)
- FIGURE 30 KONINKLIJKE PHILIPS N.V.: COMPANY SNAPSHOT (2021)
- FIGURE 31 VERADIGM LLC: COMPANY SNAPSHOT (2021)
- FIGURE 32 COGNIZANT: COMPANY SNAPSHOT (2021)
- FIGURE 33 CHANGE HEALTHCARE: COMPANY SNAPSHOT (2021)
- FIGURE 34 NEXTGEN HEALTHCARE, INC.: COMPANY SNAPSHOT (2020)
- FIGURE 35 MEDICAL INFORMATION TECHNOLOGY, INC.: COMPANY SNAPSHOT (2019)
- FIGURE 36 ORION HEALTH GROUP OF COMPANIES: COMPANY SNAPSHOT (2021)
- FIGURE 37 VIRTUSA CORP.: COMPANY SNAPSHOT (2020)
This study involved the extensive use of both primary and secondary sources. The research process involved the study of various factors affecting the industry to identify the segmentation types, industry trends, key players, competitive landscape, key market dynamics, and key player strategies.
Secondary Research
This research study involved the use of comprehensive secondary sources; directories and databases such as D&B, Bloomberg Business, and Factiva; and white papers, annual reports, and company house documents. Secondary research was used to identify and collect information for this extensive, technical, market-oriented, and commercial study of the global Healthcare interoperability solutions Market. It was also used to obtain important information about the top players, market classification, and segmentation according to industry trends to the bottom-most level, geographic markets, technology perspectives, and key developments related to the market. A database of the key industry leaders was also prepared using secondary research.
Primary Research
In the primary research process, various sources from both the supply and demand sides were interviewed to obtain qualitative and quantitative information for this report. The primary sources from the supply side include industry experts such as CEOs, vice presidents, marketing and sales directors, technology and innovation directors, and related key executives from various key companies and organizations operating in the Healthcare interoperability solutions Market. The primary sources from the demand side include key personnel from hospitals, clinics, physicians’ offices, and healthcare providers and payers.
A breakdown of the primary respondents is provided below:
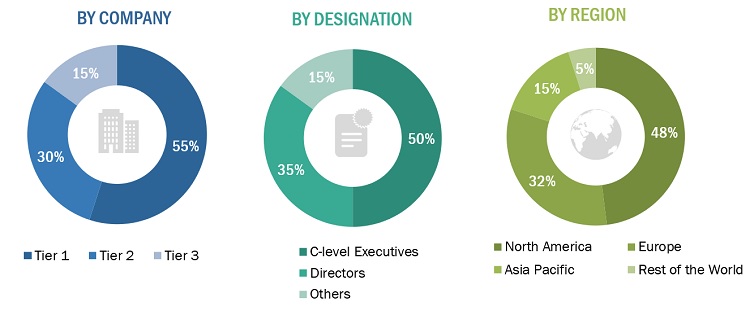
*Others include sales managers, marketing managers, and product managers.
Note: Tiers are defined based on a company’s total revenue, as of 2020: Tier 1 = >USD 1 billion, Tier 2 = USD 500 million to USD 1 billion, and Tier 3 = <USD 500 million.
To know about the assumptions considered for the study, download the pdf brochure
Market Size Estimation
The market size estimates and forecasts provided in this study are derived through a mix of the bottom-up approach (segmental analysis of major segments) and top-down approach (assessment of utilization/adoption/penetration trends, by type, level of Interoperability, end user, and region).
Data Triangulation
After arriving at the market size, the total Healthcare interoperability solutions Market was divided into several segments and subsegments. To complete the overall market engineering process and arrive at the exact statistics for all segments & subsegments, data triangulation, and market breakdown procedures were employed, wherever applicable.
Global HealthcareInteroperability Solutions Market Size: Top-Down Approach

To know about the assumptions considered for the study, Request for Free Sample Report
Market Definition
Healthcare interoperability solutions allow the seamless exchange and interpretation of health-related data amongst healthcare companies and patients for clinical decision-making to offer proprietary control over health information. The market scope includes only interoperable solutions, whereas standalone solutions, such as EHR and HIE, are not included.
Key Stakeholders
- Healthcare IT Service Providers
- Healthcare Institutions/Providers (Hospitals, Medical Groups, Physician Practices, Diagnostic Centers, and Outpatient Clinics)
- Venture Capitalists
- Government Bodies
- Corporate Entities
- Accountable Care Organizations
- Academic Research Institutes
- Healthcare Payers
- Market Research and Consulting Firms
- Healthcare IT Vendors
Objectives of the Study
- To To define, describe, and forecast the healthcare interoperability solutions market by type, interoperability level, end user, and region
- To provide detailed information about the major factors influencing the market growth (drivers, restraints, opportunities, and challenges)
- To strategically analyze micromarkets with respect to individual growth trends, prospects, and contributions to the overall market
- To analyze market opportunities for stakeholders and provide details of the competitive landscape for key players
- To forecast the size of the market segments in North America, Europe, the Asia Pacific, Latin America, and the Middle East & Africa
- To profile key players and comprehensively analyze their market shares and core competencies in the market
- To track and analyze competitive developments such as partnerships, agreements, and collaborations; mergers & acquisitions; product developments; and geographical expansions in the market
Available Customizations
With the given market data, MarketsandMarkets offers customizations as per your company’s specific needs. The following customization options are available for the report:
Company Information
- Detailed analysis and profiling of additional market players (up to 5)
Geographic Analysis
- Further breakdown of the Rest of Asia Pacific Healthcare interoperability solutions Market into India, China, New Zealand and others
- Further breakdown of the Rest of Europe Healthcare interoperability solutions Market into the Spain, Belgium, Switzerland and others
- Further breakdown of the Latin America Healthcare interoperability solutions Market into Argentina, Colombia, Chile, and others


 Generating Response ...


Growth opportunities and latent adjacency in Healthcare Interoperability Solutions Market