
Healthcare Data Monetization Market Size, Share & Trends

Healthcare Data Monetization Market by Type (Direct, Indirect), Deployment (On-premise, Cloud), End User (Pharmaceutical & Biotechnology Companies, Healthcare Payers, Healthcare Providers, Medical Technology Companies) & Region- Global Forecast to 2030


OVERVIEW
Source: Secondary Research, Interviews with Experts, MarketsandMarkets Analysis
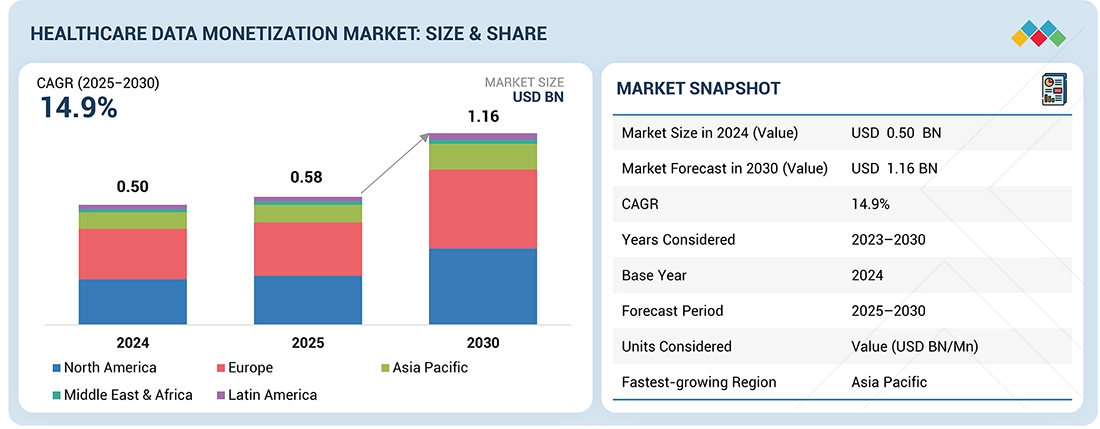
The global healthcare data monetization market is projected to reach USD 1.16 billion by 2030 from USD 0.58 billion in 2025, at a CAGR of 14.9% during the forecast period. This growth is driven by the increasing commercial value of real-time patient data, growing emphasis on data-driven decision-making in life sciences, and the emergence of data-as-a-service (DaaS) business models across healthcare. Rising participation of consumer health tech companies, such as digital therapeutics and remote monitoring solution providers, is accelerating demand for secure and scalable data monetization frameworks. Additionally, the expanding use of cloud-native interoperability platforms, alongside the rising need for risk stratification and outcome benchmarking in payer-provider models, is positively impacting the market.
KEY TAKEAWAYS
- The North America healthcare data monetization market accounted for a 44.7% revenue share in 2024.
- By type, the direct data monetization segment is expected to register the highest CAGR of 16.3%.
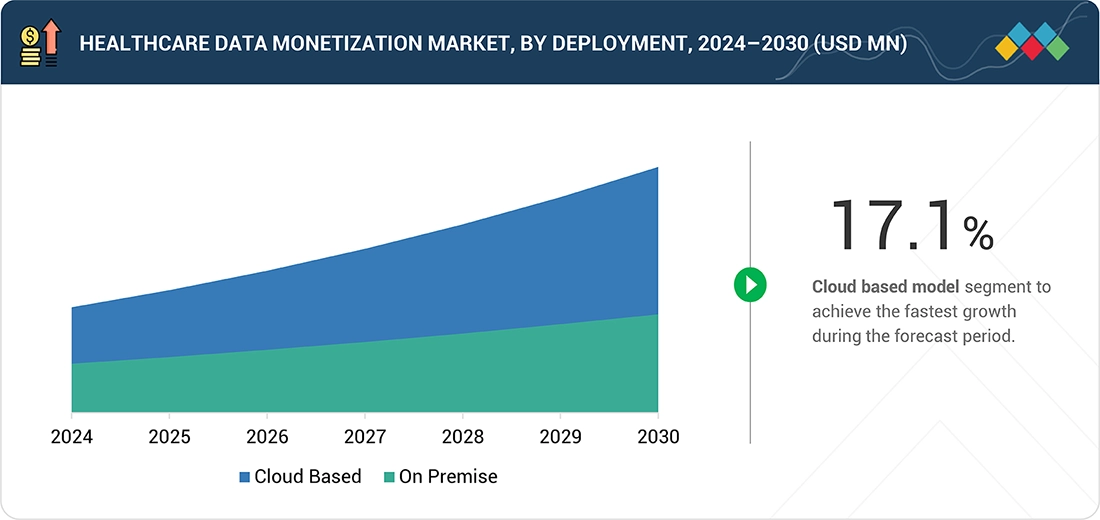
- By deployment, the cloud-based is anticipated to register the highest growth rate.
- By data type, the clinical data segment is expected to dominate the market with 36.3% market share in 2024.
- By end user, the pharma and biotech companies segment is projected to grow at the fastest rate from 2025 to 2030.
- Oracle (US), Microsoft (US), Google (US), Salesforce, Inc. (US), SAS Institute Inc. (US), SAP SE (Germany), TIBCO Software Inc. were identified as some of the star players in the healthcare data monetization market, given their strong market share and product footprint.
- Prognos Health (US), Owkin (US), MedeAnalytics (US), ClosedLoop (US), Seqster (US), Human API (US),among others, have distinguished themselves among startups and SMEs by securing strong footholds in specialized niche areas, underscoring their potential as emerging market leaders
The healthcare data monetization market is witnessing steady growth, driven by the the surge in EHR adoption, proliferation of connected devices and wearables, and rising healthcare costs. Large, complex datasets are increasingly being leveraged by life sciences, payers, and tech firms to improve clinical trials, risk stratification, and personalized care. Strategic collaborations—such as Validic with Oracle Health, Clario with ActiGraph, and Clarify Health with Datavant—are expanding access to real-world and external data sources, enhancing the value of healthcare data assets. Advances in AI, privacy-preserving technologies, and interoperability are further enabling secure data exchange and analytics, transforming fragmented health information into valuable, monetizable insights while driving efficiency and innovation across the healthcare ecosystem.
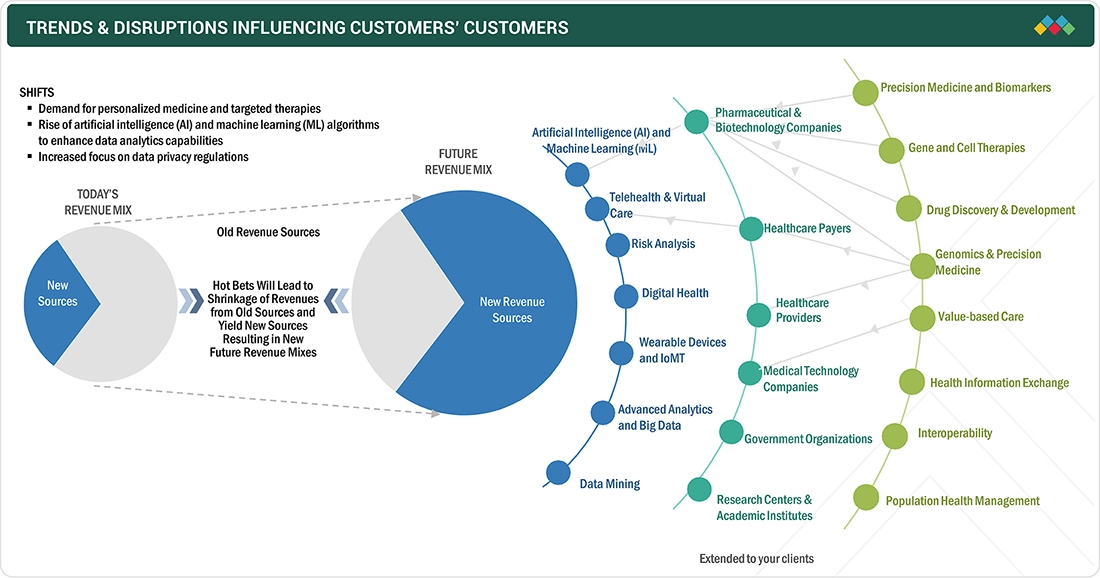
TRENDS & DISRUPTIONS IMPACTING CUSTOMERS' CUSTOMERS
The impact on consumers' business emerges from customer trends or disruptions. Hotbets are clients of healthcare data monetization platform providers, and target applications are clients of healthcare data monetization platform providers. Shifts, which are changing trends or disruptions, will impact the revenues of end users. The revenue impact on end users will affect the revenue of hotbets, which will further affect the revenues of aerospace materials manufacturers.
Source: Secondary Research, Interviews with Experts, MarketsandMarkets Analysis
MARKET DYNAMICS
Level
-
Rising demand for real-world evidence (RWE) and value-based care models

-
Rising demand for personalized medicine and research

Level
-
Data privacy and compliance concerns

-
Lack of standardization and interoperability

Level
-
AI/ML-Driven Analytics And Secure Data Exchange Platforms

-
Emergence of personalized medicine and genomics

Level
-
Fragmented and Siloed Healthcare Data Systems

-
Security concerns

Source: Secondary Research, Interviews with Experts, MarketsandMarkets Analysis
Driver: Rising Demand For Real-World Evidence (RWE) and Value-Based Care Models
The growing global shift from volume-based to value-based healthcare is a major driver of healthcare data monetization. Payers and providers increasingly need real-world evidence (RWE) to support outcome-based contracts, optimize clinical pathways, and demonstrate cost-effectiveness of therapies. Pharmaceutical and biotech companies are similarly relying on real-world data (RWD) to complement clinical trials, assess long-term safety and effectiveness, and support regulatory submissions. This need is fueling monetization of various datasets including clinical, claims, genomic, and behaviora by data aggregators and analytics firms. For instance, IQVIA has scaled its global real-world evidence solutions, integrating EHR and claims data from over 100 million patients to deliver insights into treatment patterns and comparative effectiveness. Tempus, a US-based precision medicine company, monetizes its large repository of de-identified clinical-genomic data by offering AI-driven solutions to biopharma clients for drug discovery and clinical trial optimization. Similarly, TriNetX provides access to a real-time clinical data network sourced from over 200 healthcare organizations, allowing pharma companies to conduct feasibility analysis, patient stratification, and protocol simulation for studies. These platforms represent a growing ecosystem where health data is increasingly seen as a strategic asset and revenue source.
Restraint: Data Privacy and Compliance Concerns
Despite the rising value of health data, privacy and regulatory compliance remain major barriers to monetization. Laws such as HIPAA (US), GDPR (EU), and emerging data sovereignty regulations (e.g., India’s Digital Personal Data Protection Act, 2023) strictly govern how personal health information can be used, shared, and monetized. These rules not only limit cross-border data flows but also demand explicit patient consent and impose heavy fines for non-compliance, discouraging aggressive monetization models. In 2024, the European Data Protection Board (EDPB) issued additional restrictions on the secondary use of patient data for commercial purposes, affecting many RWE vendors operating in the EU. As a result, tech giants like Apple and Microsoft have pivoted to on-device AI and federated learning to minimize centralized data storage and better align with evolving privacy standards. In India, under the Ayushman Bharat Digital Mission (ABDM), the National Health Authority (NHA) requires that health data be stored within national borders, limiting how global companies access and monetize this data. These growing regulatory hurdles are compelling organizations to develop more privacy-preserving technologies to enable ethical and compliant monetization.
Opportunity: AI/ML-Driven Analytics And Secure Data Exchange Platforms
AI-powered analytics combined with advanced technologies such as federated learning, blockchain, and multimodal data integration are unlocking new ways to monetize real-world data (RWD) without breaching patient privacy. These secure platforms are enabling pharmaceutical companies, research institutions, and health tech firms to generate novel insights across clinical development, diagnostics, and personalized medicine.
Challenge: Fragmented and Siloed Healthcare Data Systems
A core operational barrier to effective healthcare data monetization lies in the fragmentation and lack of interoperability across the healthcare ecosystem. Patient data is often dispersed across disparate systems—including electronic health records (EHRs), payer claims databases, diagnostic labs, pharmacy records, and research registries—many of which rely on incompatible formats or outdated technologies. This fragmentation impedes the construction of a comprehensive, longitudinal view of patient journeys, which is critical for extracting meaningful insights and generating value from data. Major EHR vendors such as Epic and Oracle Health (formerly Cerner) continue to face industry criticism for their closed architectures and limited support for seamless data exchange. In an effort to address these issues, the U.S. government launched the Trusted Exchange Framework and Common Agreement (TEFCA) in December 2024, aiming to enable secure, standardized health information exchange. However, the rollout has been inconsistent and slow, hindering widespread adoption.
Healthcare Data Monetization Market: COMMERCIAL USE CASES ACROSS INDUSTRIES
| COMPANY | USE CASE DESCRIPTION | BENEFITS |
|---|---|---|
 |
Cloud-based healthcare data management and analytics. | Scalable infrastructure, reduced costs, and real-time insights. |
 |
AI-powered data sharing and predictive analytics via Azure. | Enhanced compliance, faster innovation, and improved care delivery. |
 |
Federated learning and de-identified data analysis. | Privacy-preserving insights and efficient clinical research. |
 |
Patient engagement and consent-driven data sharing. | Personalized care and streamlined data monetization. |
 |
Advanced analytics for clinical and operational data. | Actionable insights, fraud detection, and research acceleration. |
Logos and trademarks shown above are the property of their respective owners. Their use here is for informational and illustrative purposes only.
MARKET ECOSYSTEM
The healthcare data monetization market ecosystem consists of data solution providers (Oracle Corporation, Microsoft Corporation, Google, Salesforce, Inc., SAS Institute Inc., SAP SE, TIBCO Software Inc., Snowflake Inc., Qlik, Infosys, Sisense Inc., Accenture, Availity, LLC, Domo, Inc., Komodo Health, Inc., Virtusa, Datavant, Infor, Inc., HealthVerity, Inc., ThoughtSpot Inc.), healthcare providers, payors, and research organizations. These stakeholders collect, integrate, and analyze patient records, claims data, and real-world evidence to generate actionable insights. Solution providers enable secure analytics, reporting, and interoperability, allowing hospitals, insurers, and pharma/biotech firms to optimize patient care, reduce costs, and identify new revenue streams. Collaboration across the ecosystem drives innovation, regulatory compliance, and growth.
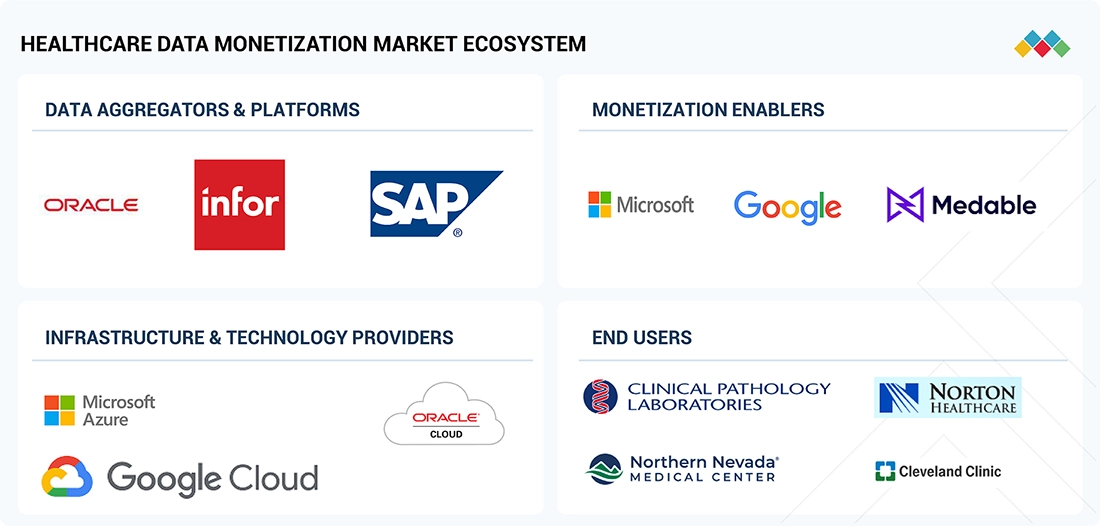
Logos and trademarks shown above are the property of their respective owners. Their use here is for informational and illustrative purposes only.
MARKET SEGMENTS
Source: Secondary Research, Interviews with Experts, MarketsandMarkets Analysis
HEALTHCARE DATA MONETIZATION MARKET BY PRODUCT TYPE
By type, the healthcare data monetization market has been segmented into direct and indirect data monetization. In 2024, direct segment accounted for the largest market share driven by the growing demand among healthcare organizations to generate immediate revenue through the sale or licensing of data assets. The direct data monetization segment is further bifurcated into software and services. Among these, the software segment accounted for the largest share due to the increasing adoption of data analytics platforms, data integration tools, and secure data exchange solutions that enable real-time data monetization. These software solutions offer scalability, automation, and compliance features, making them essential for organizations looking to efficiently manage and commercialize large volumes of health data.
HEALTHCARE DATA MONETIZATION MARKET BY DEPLOYMENT
By deployment, healthcare data monetization market has been segmented into on-premise and cloud segment, the cloud segment held the largest during the forecast period. This growth is driven by the cloud’s ability to offer unmatched scalability, flexibility, and cost-effectiveness, making it ideal for managing the vast and growing volumes of healthcare data.
HEALTHCARE DATA MONETIZATION MARKET BY DATA TYPE
Based on data type, the healthcare data monetization market is segmented into clinical data, clinical trial data, claims and billing data, consumer and digital health data, genomic and molecular data, and Others. In 2024, the clinical data segment accounted for larger share of the healthcare data monetization market. The increasing adoption of electronic health records (EHRs), along with the growing use of AI and analytics to extract actionable insights, is driving the segment's growth. The push for interoperable health systems and value-based care models is accelerating data sharing and monetization. Additionally, advancements in diagnostic imaging and real-time data integration are enhancing the commercial value of clinical datasets.
HEALTHCARE DATA MONETIZATION MARKET BY END USER
In 2024, the pharmaceutical and biotechnology companies segment held the largest share of the healthcare data monetization market, driven by their growing demand for real-world data (RWD) and advanced analytics to accelerate drug discovery, optimize clinical trials, and support regulatory approvals. These organizations increasingly depend on patient-level data to identify unmet medical needs, refine trial design, and generate real-world evidence (RWE) for market access and post-marketing surveillance.
REGION
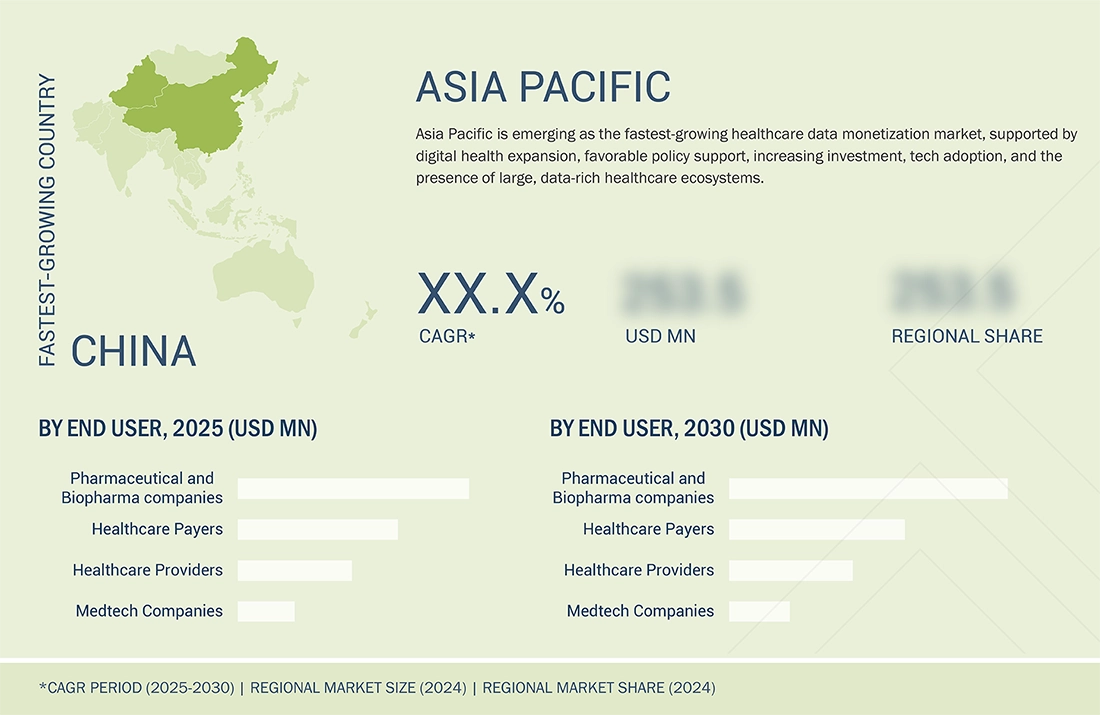
Asia Pacific to be fastest-growing region in global healthcare data monetization market during forecast period
The Asia Pacific Healthcare data monetization market is expected to register the highest CAGR during the forecast period, driven by rapid digital transformation, rising healthcare expenditure, and supportive government initiatives. A large patient population, growing healthtech startups, and adoption of AI, big data, and cloud platforms enable efficient data utilization and monetization at scale.
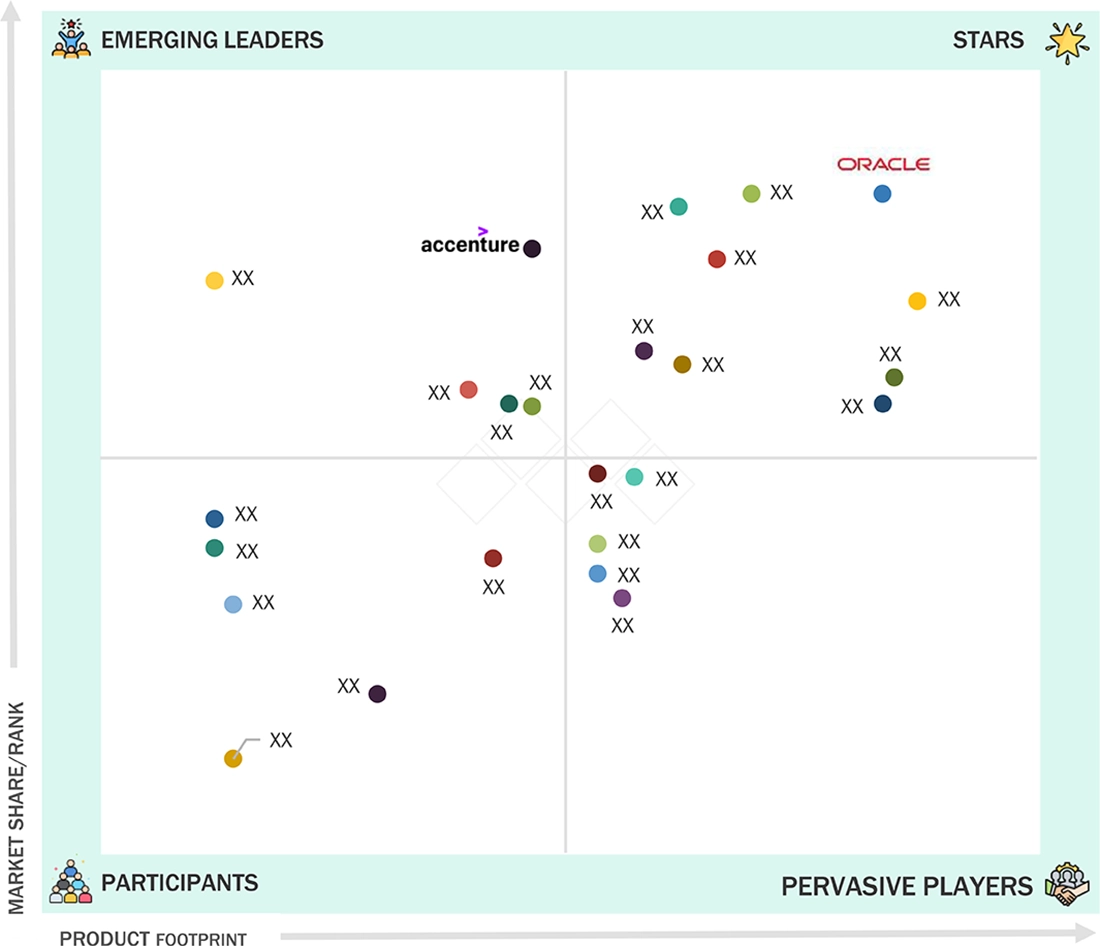
Healthcare Data Monetization Market: COMPANY EVALUATION MATRIX
In the healthcare data monetization market matrix, Oracle (Star) leads with a strong market share and a comprehensive product footprint, driven by its robust cloud infrastructure, advanced analytics platforms, and seamless integration capabilities that enable healthcare organizations to unlock value from large-scale health data. Accenture (Emerging Leader) is rapidly gaining visibility through its strategic consulting expertise, tailored data monetization frameworks, and strong collaborations with payers, providers, and life sciences companies. While Oracle dominates through scale, technological depth, and a broad solution portfolio, Accenture shows strong potential to advance toward the leaders’ quadrant as demand for data-driven healthcare strategies, interoperability, and value-based care models continues to accelerate.
Source: Secondary Research, Interviews with Experts, MarketsandMarkets Analysis
KEY MARKET PLAYERS
- Oracle Corporation (US)
- Microsoft Corporation (US)
- Google (US)
- Salesforce, Inc. (US)
- SAS Institute Inc. (US)
- SAP SE (Germany)
- TIBCO Software Inc. (US)
- Sisense Inc. (US)
- Snowflake Inc. (US)
- QlikTech International AB (US)
- HealthVerity, Inc. (US)
- Accenture (Ireland)
- Availity, LLC (US)
- Domo, Inc. (US)
- Komodo Health, Inc. (US)
- ThoughtSpot Inc. (US)
- Datavant (US)
- Verato (US)
- Infor, Inc. (US)
- Virtusa (US)
- Infosys (India)
- Particle Health, Inc. (US)
- Innovaccer, Inc. (US)
- H1 (US)
- Medable Inc. (US)
MARKET SCOPE
| REPORT METRIC | DETAILS |
|---|---|
| Market Size in 2024 (Value) | USD 0.50 BN |
| Market Forecast in 2030 (Value) | USD 1.16 BN |
| Growth Rate | CAGR of 14.9% from 2025-2030 |
| Years Considered | 2023–2030 |
| Base Year | 2024 |
| Forecast Period | 2025-2030 |
| Units Considered | Value (USD Million/Billion) |
| Report Coverage | Revenue forecast, company ranking, competitive landscape, growth factors, and trends |
| Segments Covered |
|
| Regions Covered | North America, Europe, Asia Pacific, Latin America, Middle East & Africa |
WHAT IS IN IT FOR YOU: Healthcare Data Monetization Market REPORT CONTENT GUIDE
DELIVERED CUSTOMIZATIONS
We have successfully delivered the following deep-dive customizations:
| CLIENT REQUEST | CUSTOMIZATION DELIVERED | VALUE ADDS |
|---|---|---|
| US EHR/EMR Market |
|
|
RECENT DEVELOPMENTS
- January 2025 : Selfii announced the launch of TripleBlind Exchange, a groundbreaking marketplace that enables secure, HIPAA-compliant access to protected health information (PHI) without the need for traditional de-identification.
- December 2024 : Atropos Health launched AI model training on its Evidence Network, the largest federated healthcare data network with 200M+ de-identified patient records. This enables AI-driven insights for pharmaceutical companies and health systems, including Stanford.
- October 2024 : Datma introduced datma.FED, a two-sided marketplace platform enhancing healthcare data sharing, accessibility, and monetization by connecting health systems, labs, pharma, and research organizations.
- April 2023 : Salesforce launched new Customer 360 for Health features that use AI, real-time data, and automation to streamline healthcare processes, improve patient experiences, and reduce costs.
- April 2023 : Microsoft and Epic Systems deepened collaboration by integrating Azure OpenAI Service with Epic’s EHR, aiming to boost patient care, operational productivity, and financial management in health systems worldwide.
- February 2023 : Redox partnered with Google Cloud to simplify healthcare data exchange by replicating Redox’s platform on Google Cloud, improving data interoperability and decision-making.
Table of Contents
 Exclusive indicates content/data unique to MarketsandMarkets and not available with any competitors.
Methodology
The study consisted of five major activities to estimate the current size of the healthcare data monetization market. First, comprehensive secondary research was conducted to gather information about the market and its various subsegments. Next, these findings, assumptions, and estimates were validated through primary research with industry experts across the value chain. Both top-down and bottom-up approaches were utilized to determine the overall market size. Following this, market breakdown and data triangulation procedures were employed to estimate the sizes of specific segments and subsegments.
Secondary Research
This research study extensively utilized secondary sources, including directories and databases such as Dun & Bradstreet, Bloomberg Business, and Factiva. It also incorporated white papers, annual reports, company documents, investor presentations, and SEC filings. The assessment of healthcare data monetization market solutions was conducted using both paid and free secondary data sources. This involved analyzing the product portfolios of major industry players and evaluating these companies based on their performance and quality.
The secondary research process involved reviewing various sources to gather relevant information for the study. These included annual reports, press releases, investor presentations from healthcare data monetization vendors, forums, certified publications, and white papers. The insights gained from this secondary research were crucial in understanding the industry’s value chain, identifying key players, and examining market classification and segmentation from both market and technology perspectives.
Primary Research
In the primary research process, various supply and demand sources were interviewed to gather qualitative and quantitative information for this report. The primary sources included industry experts from core and related sectors, as well as preferred suppliers, manufacturers, distributors, technology developers, researchers, and organizations connected to all segments of the industry’s value chain. In-depth interviews were conducted with multiple primary respondents, including key industry participants, subject-matter experts (SMEs), C-level executives of prominent market players, and industry consultants. These interviews aimed to obtain and verify critical qualitative and quantitative information and to assess future prospects. Primary research was carried out to identify segmentation types, industry trends, key players, and important market dynamics, such as drivers, restraints, opportunities, challenges, and strategies adopted by key players in the industry.
After completing the market engineering process, which involves calculations for market statistics, estimating market size, forecasting, and data triangulation, we conducted extensive primary research. This research aimed to gather information and validate the critical figures obtained during the market analysis. Additionally, we carried out primary research to identify various types of market segmentation, analyze industry trends, evaluate the competitive landscape of healthcare data monetization solutions provided by different players, and understand key market dynamics such as drivers, restraints, opportunities, challenges, and strategies employed by significant market participants.
Throughout the market engineering process, we utilized both top-down and bottom-up approaches, along with various data triangulation methods, to estimate the market and forecast trends for the overall market segments and subsegments included in this report. We also performed comprehensive qualitative and quantitative analyses to provide key insights.
Breakdown of Primary Respondents:

Note 1: Others include sales, marketing, and product managers.
Note 2: Tiers are defined based on a company’s total revenue: Tier 1 = >USD 1 billion, Tier 2 = USD 500 million to USD 1 billion, and Tier 3 = < USD 500 million
To know about the assumptions considered for the study, download the pdf brochure
Market Size Estimation
The market size estimates and forecasts provided in this study are derived through a mix of the bottom-up approach (revenue share analysis of leading players) and the top-down approach (assessment of utilization/adoption/penetration trends, type, deployment, end user, and region).

Data Triangulation
After arriving at the overall market size using the market size estimation process, the market was split into several segments and subsegments. Data triangulation and market breakdown procedures were employed to complete the overall market engineering process and arrive at the exact statistics of each market segment and subsegment. The data was triangulated by studying various factors and trends from both the demand and supply sides in the healthcare data monetization market.
Market Definition
Healthcare data monetization refers to generating economic value from healthcare data by leveraging it for strategic, clinical, or commercial purposes. This can include directly selling or licensing data or indirectly using data insights to improve operations, enhance patient outcomes, support research, or develop new products and services. It enables healthcare stakeholders to generate the full potential of data as a revenue-generating and decision-enhancing asset.
Stakeholders
- Healthcare Data Monetization Vendors
- Government Bodies
- Healthcare Service Providers
- Clinical/Physician Centers
- Healthcare Professionals
- Health IT Service Providers
- Healthcare Associations/Institutes
- Ambulatory Care Centers
- Medical Technology Companies
- Pharmaceutical & Biotechnology Companies
- Venture Capitalists
- Distributors and Resellers
- Maintenance and Support Service Providers
- Integration Service Providers
- Healthcare Payers
- Advocacy Groups
- Data Security and Privacy Experts
- Investors and Financial Institutions
- Industry Associations and Trade Groups
Report Objectives
- To define, describe, and forecast the global healthcare data monetization market by type, deployment, end user, and region
- To provide detailed information regarding the major factors influencing the growth of the market (such as drivers, restraints, opportunities, and challenges)
- To analyze micromarkets with respect to individual growth trends, prospects, and contributions to the overall healthcare data monetization market
- To assess the healthcare data monetization market with regard to Porter’s Five Forces, regulatory landscape, value chain, ecosystem map, patent protection, and key stakeholders and buying criteria
- To analyze opportunities in the market for stakeholders and provide details of the competitive landscape for market leaders
- To forecast the size of the healthcare data monetization market with respect to five regions: North America, Europe, the Asia Pacific, Latin America, and the Middle East & Africa
- To profile the key players in the healthcare data monetization market and comprehensively analyze their core competencies and market shares
- To track and analyze competitive developments such as agreements, partnerships, acquisitions, expansions, product launches & enhancements, and R&D activities in the healthcare data monetization market
Frequently Asked Questions (FAQ)
Which are the top industry players in the global healthcare data monetization market?
Prominent players include Oracle Corporation (US), Microsoft Corporation (US), Google (US), Salesforce, Inc. (US), SAS Institute Inc. (US), SAP SE (Germany), TIBCO Software Inc. (US), Sisense Inc. (US), Snowflake Inc. (US), QlikTech International AB (US), HealthVerity, Inc. (US), Accenture (Ireland), Availity, LLC (US), Domo, Inc. (US), Komodo Health, Inc. (US), ThoughtSpot Inc. (US), Datavant (US), Verato (US), Infor, Inc. (US), Virtusa (US), Infosys (India), Particle Health, Inc. (US), Innovaccer, Inc. (US), H1 (US), and Medable Inc. (US).
Which types have been included in the healthcare data monetization market report?
This report contains the following healthcare data monetization types:
-
Direct Data Monetization
- Software
- Services
-
Indirect Data Monetization
- Software
- Services
Which geographical region dominates the global healthcare data monetization market?
North America currently dominates the market. However, the Asia Pacific region is expected to register the highest growth during the forecast period.
Which end-user segments have been included in the healthcare data monetization market report?
The report contains the following end-user segments:
- Pharmaceutical & Biotechnology Companies
- Healthcare Payers
- Healthcare Providers
- Medical Technology Companies
- Other End-Users
What is the total CAGR for the healthcare data monetization market from 2025 to 2030?
The market is expected to grow at a CAGR of 14.9% during the forecast period from 2025 to 2030.
Need a Tailored Report?
Customize this report to your needs
Get 10% FREE Customization
Customize This ReportPersonalize This Research
- Triangulate with your Own Data
- Get Data as per your Format and Definition
- Gain a Deeper Dive on a Specific Application, Geography, Customer or Competitor
- Any level of Personalization
Let Us Help You
- What are the Known and Unknown Adjacencies Impacting the Healthcare Data Monetization Market
- What will your New Revenue Sources be?
- Who will be your Top Customer; what will make them switch?
- Defend your Market Share or Win Competitors
- Get a Scorecard for Target Partners

Custom Market Research Services
We Will Customise The Research For You, In Case The Report Listed Above Does Not Meet With Your Requirements
Get 10% Free Customisation


Growth opportunities and latent adjacency in Healthcare Data Monetization Market