Formulation Additives Market by Type (Defoamers, Rheology Modifiers, Dispersing Agents), End Use Industry (Construction, Transportation, Industrial and Oil & Gas, Food & Beverage, Furniture & Flooring), and Region - Global Forecast to 2023


[126 Pages Report] Formulation Additives Market was valued at USD 19.48 billion in 2017 and is projected to reach USD 27.86 billion by 2023, at a CAGR of 6.2% during the forecast period. In this report, 2017 is considered the base year and the forecast period is 2018-2023.
Objectives of the Study:
- To analyze and forecast the size of the formulation additives market, in terms of value.
- To provide detailed information regarding key factors, such as drivers, restraints, opportunities, and challenges, influencing the growth of the formulation additives market
- To strategically analyze micromarkets1 with respect to individual growth trends, prospects, and their contribution to the market
- To define, describe, and forecast the formulation additives market on the basis of type and end-use industry
- To forecast the size of market segments with respect to five main regions, namely, North America, Europe, Asia Pacific, the Middle East & Africa, and South America
- To analyze opportunities in the formulation additives market for stakeholders and provide a competitive landscape of the market
- To strategically profile key players and comprehensively analyze their market shares and core competencies2
Note 1: Micromarkets are the subsegments of the formulation additives market included in the report.
Note 2: Core competencies of companies are determined in terms of their key developments and key strategies adopted by them to sustain in the market.
Top-down and bottom-up approaches were used to estimate and validate the size of the formulation additives market and to estimate the sizes of various other dependent submarkets. The research study involved the use of secondary sources that include directories and databases, such as Hoovers, Chemical Weekly, Factiva, Bloomberg Businessweek, and articles from recognized authors to identify and collect information useful for a technical, market-oriented, and commercial study of the formulation additives market.
To know about the assumptions considered for the study, download the pdf brochure
Key Players:
- BASF (Germany)
- Eastman (US)
- Evonik (Germany)
- BYK Additives (Germany)
- Dow (US)
- Cabot (US)
- Allnex (Germany)
- Arkema (France)
- Momentive (US)
- M�nzing (Germany)
- Honeywell (US)
Key Target Audience:
- Formulation Additives Manufacturers
- Formulation Additives Suppliers
- Raw Material Suppliers
- Formulation Additives Distributors
- Research Organizations
- Government Bodies
- End-use Companies
- Consulting Companies/Consultants in the Chemical and Material Sectors
�This study answers several questions for stakeholders, primarily which market segments they should focus upon during the next 2 to 5 years to prioritize their efforts and investments�.
Scope of the Report:
This research report categorizes the formulation additives market based on type, end-use industry, and region.
Based on Type:
- Dispersing Agents
- Defoamers
- Rheology Modifiers
- Others
Based on End-use Industry:
- Construction
- Industrial and Oil & Gas
- Transpiration
- Furniture & Flooring
- Food & Beverage
- Others (pharmaceuticals, printing, cosmetics)
Based on Region:
- North America
- Europe
- Asia Pacific
- Middle East & Africa
- South America
- The market is further analyzed for key countries in each of these regions.
Available Customizations:
With the given market data, MarketsandMarkets offers customizations according to a company�s specific needs. The following customization options are available for the report:
Regional Analysis:
- Country-level analysis of the formulation additives market.
Company Information:
- Detailed analysis and profiles of additional market players.
The formulation additives market is estimated at USD 20.62 billion in 2018 and is projected to reach USD 27.86 billion by 2023, at a CAGR of 6.2% during the forecast period. This growth can be attributed to the increasing demand for formulation additives in the construction and transportation industries. In addition, the rising demand for formulation additives due to increasing furniture & flooring and oil & gas manufacturing in emerging economies is another significant factor contributing to the growth of the formulation additives market.
The objective of using these additives is to enhance performance and improve the processing characteristics and properties of materials. The major types of formulation additives are dispersing agents, rheology modifiers, defoamers, and others. Formulation additives are widely used in several industries such as construction, transportation, industrial and oil & gas, food & beverage, furniture & flooring, and others.
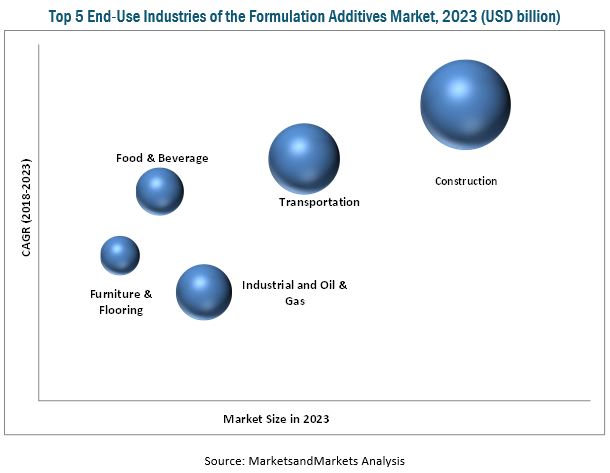
The rising use of formulation additives in the construction and transportation industries and high growth in emerging countries are driving the formulation additives market. The markets in Asia Pacific, Middle East & Africa, and South America are witnessing high growth, and the trend is projected to continue in the coming years. This growth is mainly driven by the developments in the construction, transportation, and oil & gas industries in these regions. The construction industry leads the overall formulation additives market due to the rapid increase in construction projects and infrastructural activities.
The formulation additives market in the Asia Pacific region is projected to grow at the highest CAGR from 2018 to 2023. This growth can be attributed to the easy availability of raw materials used for the manufacture of formulation additives. The Asia Pacific region provides expansion opportunities for formulation additives manufacturers, owing to the low cost of manufacture in China, South Korea, and India. Less number of regulations related to the use and manufacture of formulation additives in the Asia Pacific is further influencing the growth of the formulation additives market in this region.
The global demand for formulation additives in the construction industry is increasing rapidly with the increasing construction and architectural activities in emerging countries such as Brazil, China, and India. In addition, growing population and rapid urbanization in emerging economies are also leading to a surge in the demand for formulation additives.
BASF (Germany), Eastman (US), Evonik (Germany), BYK Additives (Germany), Dow (US), Cabot (US), Allnex (Germany), M�nzing (Germany), Arkema (France), Honeywell (US), and Momentive (US) are the leading players in the formulation additives market. These companies have strengthened their market positions through diverse product portfolios, strategically positioned R&D centers, consistent development activities, and technological advancements. They are focused on the adoption of various organic and inorganic growth strategies, such as expansions, agreements, and acquisitions to increase their market shares.
To speak to our analyst for a discussion on the above findings, click Speak to Analyst
 Exclusive indicates content/data unique to MarketsandMarkets and not available with any competitors.
Table of Contents
1 Introduction (Page No. - 12)
1.1 Objectives of the Study
1.2 Market Definition
1.3 Market Scope
1.3.1 Years Considered for the Study
1.4 Currency
1.5 Limitations
1.6 Stakeholders
2 Research Methodology (Page No. - 16)
2.1 Research Data
2.1.1 Secondary Data
2.1.1.1 Key Data From Secondary Sources
2.1.2 Primary Data
2.1.2.1 Key Data From Primary Sources
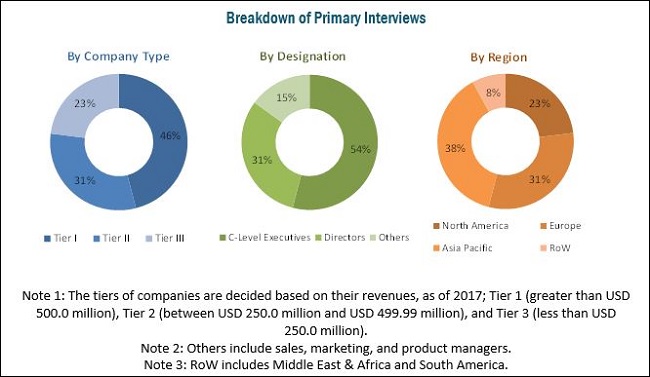
2.1.2.2 Breakdown of Primary Interviews
2.2 Market Size Estimation
2.2.1 Bottom-Up Approach
2.2.2 Top-Down Approach
2.3 Data Triangulation
2.4 Assumptions
3 Executive Summary (Page No. - 24)
4 Premium Insights (Page No. - 28)
4.1 Attractive Opportunities in Formulation Additives Market
4.2 Formulation Additives Market, By Type
4.3 APAC Formulation Additives Market, By Country and End-Use Industry
4.4 Formulation Additives Market, By End-Use Industry
4.5 Formulation Additives Market, By Region
5 Market Overview (Page No. - 32)
5.1 Introduction
5.2 Market Dynamics
5.2.1 Drivers
5.2.1.1 Growing Population and Rapid Urbanization in Emerging Economies
5.2.1.2 Increase in Demand From End-Use Industries
5.2.2 Restraints
5.2.2.1 Increasing Raw Material Prices
5.2.3 Opportunities
5.2.3.1 High Growth Opportunities in Emerging Economies of APAC
5.2.4 Challenges
5.2.4.1 Need for Providing Cost-Effective and High-Performance Products
5.2.4.2 Stringent Environmental Regulations
5.3 Porter�s Five Forces Analysis
5.3.1 Bargaining Power of Suppliers
5.3.2 Bargaining Power of Buyers
5.3.3 Threat of New Entrants
5.3.4 Threat of Substitutes
5.3.5 Intensity of Competitive Rivalry
5.4 Macroeconomic Overview and Key Trends
5.4.1 Trends and Forecast of GDP
5.4.2 Trends and Forecast of Automotive Industry
5.4.3 Trends and Forecast of Construction Industry
6 Formulation Additives Market, By Type (Page No. - 41)
6.1 Introduction
6.2 Rheology Modifiers
6.3 Defoamers
6.4 Dispersing Agents
6.5 Others
7 Formulation Additives Market, By End-Use Industry (Page No. - 47)
7.1 Introduction
7.2 Construction
7.3 Transportation
7.4 Furniture & Flooring
7.5 Food & Beverage
7.6 Industrial and Oil & Gas
7.7 Others
7.7.1 Pharmaceuticals
7.7.2 Cosmetics
7.7.3 Printing
8 Formulation Additives Market, By Region (Page No. - 55)
8.1 Introduction
8.2 North America
8.2.1 US
8.2.2 Canada
8.2.3 Mexico
8.3 Europe
8.3.1 Germany
8.3.2 France
8.3.3 UK
8.3.4 Italy
8.3.5 Spain
8.3.6 Rest of Europe
8.4 APAC
8.4.1 China
8.4.2 Japan
8.4.3 India
8.4.4 South Korea
8.4.5 Rest of APAC
8.5 Middle East & Africa
8.5.1 Saudi Arabia
8.5.2 South Africa
8.5.3 Rest of Middle East & Africa
8.6 South America
8.6.1 Brazil
8.6.2 Argentina
8.6.3 Rest of South America
9 Competitive Landscape (Page No. - 89)
9.1 Overview
9.2 Market Ranking of Key Players
9.3 Competitive Scenario
9.3.1 New Product Launches
9.3.2 Expansions
9.3.3 Acquisitions & Partnerships
10 Company Profiles (Page No. - 95)
(Business Overview, Products Offered, Recent Developments, SWOT Analysis, MnM View)*
10.1 BASF
10.2 Eastman
10.3 Cabot
10.4 Allnex
10.5 M�nzing Corporation
10.6 Arkema
10.7 BYK Additives
10.8 Evonik
10.9 DOW
10.10 Honeywell
10.11 Momentive Performance Materials
*Details on Business Overview, Products Offered, Recent Developments, SWOT Analysis, MnM View Might Not Be Captured in Case of Unlisted Companies.
10.12 Other Market Players
10.12.1 Lanxess
10.12.2 Cytec (Solvay)
10.12.3 Akzonobel N.V.
10.12.4 Lehmann&Voss&Co.
10.12.5 Huntsman
10.12.6 Michelman
10.12.7 Elementis
10.12.8 Afcona Additives
10.12.9 King Industries
10.12.10 Borchers
10.12.11 ISCA UK
10.12.12 San Nopco
10.12.13 Harmony Additive
10.12.14 Trio
10.12.15 Patcham FZC
11 Appendix (Page No. - 119)
11.1 Insights From Industry Experts
11.2 Discussion Guide
11.3 Knowledge Store: Marketsandmarkets Subscription Portal
11.4 Introducing RT: Real-Time Market Intelligence
11.5 Available Customizations
11.6 Related Reports
11.7 Author Details
List of Tables (66 Tables)
Table 1 Trends and Forecast of GDP, 2016�2022 (USD Billion)
Table 2 Automotive Production, Million Unit (2011�2016)
Table 3 Contribution of Construction Industry to the GDP, 2014�2016 (USD Billion)
Table 4 Formulation Additives Market Size, By Type, 2016�2023 (USD Million)
Table 5 Rheology Modifiers Market Size, By Region, 2016�2023, (USD Million)
Table 6 Defoamers Market Size, By Region, 2016�2023, (USD Million)
Table 7 Dispersing Agents Market Size, By Region, 2016�2023, (USD Million)
Table 8 Other Formulation Additives Market Size, By Region, 2016�2023, (USD Million)
Table 9 Formulation Additives Market Size, By End-Use Industry, 2016�2023 (USD Million)
Table 10 Formulation Additives Market Size in Construction Industry, By Region, 2016�2023 (USD Million)
Table 11 Formulation Additives Market Size in Transportation Industry, By Region, 2016�2023 (USD Million)
Table 12 Formulation Additives Market Size in Furniture & Flooring Industry, By Region, 2016�2023 (USD Million)
Table 13 Formulation Additives Market Size in Food & Beverage Industry, By Region, 2016�2023 (USD Million)
Table 14 Formulation Additives Market Size in Industrial and Oil & Gas Industry, By Region, 2016�2023 (USD Million)
Table 15 Formulation Additives Market Size in Other End-Use Industries, By Region, 2016�2023 (USD Million)
Table 16 Formulation Additives Market, By Region, 2016�2023 (USD Million)
Table 17 North America: Formulation Additives Market Size, By Country, 2016�2023 (USD Million)
Table 18 North America: Formulation Additives Market Size, By Type, 2016�2023 (USD Million)
Table 19 North America: Formulation Additives Market Size, By End-Use Industry, 2016�2023 (USD Million)
Table 20 North America: Formulation Additives Market Size in Construction Industry, By Country, 2016�2023 (USD Million)
Table 21 North America: Formulation Additives Market Size in Industrial and Oil & Gas Industry, By Country, 2016�2023 (USD Million)
Table 22 North America: Formulation Additives Market Size in Transportation Industry, By Country, 2016�2023 (USD Million)
Table 23 North America: Formulation Additives Market Size in Furniture & Flooring Industry, By Country, 2016�2023 (USD Million)
Table 24 North America: Formulation Additives Market Size in Food & Beverage Industry, By Country, 2016�2023 (USD Million)
Table 25 North America: Formulation Additives Market Size in Other End-Use Industries, By Country, 2016�2023 (USD Million)
Table 26 US: Formulation Additives Market Size, By End-Use Industry, 2016�2023 (USD Million)
Table 27 Canada: Formulation Additives Market Size, By End-Use Industry, 2016�2023 (USD Million)
Table 28 Mexico: Formulation Additives Market Size, By End-Use Industry, 2016�2023 (USD Million)
Table 29 Europe: Formulation Additives Market Size, By Country, 2016�2023 (USD Million)
Table 30 Europe: Formulation Additives Market Size, By Type, 2016�2023 (USD Million)
Table 31 Europe: Formulation Additives Market Size, By End-Use Industry, 2016�2023 (USD Million)
Table 32 Germany: Formulation Additives Market Size, By End-Use Industry, 2016�2023 (USD Million)
Table 33 France: Formulation Additives Market Size, By End-Use Industry, 2016�2023 (USD Million)
Table 34 UK: Formulation Additives Market Size, By End-Use Industry, 2016�2023 (USD Million)
Table 35 Italy: Formulation Additives Market Size, By End-Use Industry, 2016�2023 (USD Million)
Table 36 Spain: Formulation Additives Market Size, By End-Use Industry, 2016�2023 (USD Million)
Table 37 Rest of Europe: Formulation Additives Market Size, By End-Use Industry, 2016�2023 (USD Million)
Table 38 APAC: Formulation Additives Market Size, By Country, 2016�2023 (USD Million)
Table 39 APAC: Formulation Additives Market Size, By Type, 2016�2023 (USD Million)
Table 40 APAC: Formulation Additives Market Size, By End-Use Industry, 2016�2023 (USD Million)
Table 41 APAC: Formulation Additives Market Size in Construction End-Use Industry, By Country, 2016�2023 (USD Million)
Table 42 APAC: Formulation Additives Market Size in Industrial and Oil & Gas Industry, By Country, 2016�2023 (USD Million)
Table 43 APAC: Formulation Additives Market Size in Transportation Industry, By Country, 2016�2023 (USD Million)
Table 44 APAC: Formulation Additives Market Size in Furniture & Flooring Industry, By Country, 2016�2023 (USD Million)
Table 45 APAC: Formulation Additives Market Size in Food & Beverage Industry, By Country, 2016�2023 (USD Million)
Table 46 APAC: Formulation Additives Market Size in Other End-Use Industries, By Country, 2016�2023 (USD Million)
Table 47 China: Formulation Additives Market Size, By End-Use Industry, 2016�2023 (USD Million)
Table 48 Japan: Formulation Additives Market Size, By End-Use Industry, 2016�2023 (USD Million)
Table 49 India: Formulation Additives Market Size, By End-Use Industry, 2016�2023 (USD Million)
Table 50 South Korea: Formulation Additives Market Size, By End-Use Industry, 2016�2023 (USD Million)
Table 51 Rest of APAC: Formulation Additives Market Size, By End-Use Industry, 2016�2023 (USD Million)
Table 52 Middle East & Africa: Formulation Additives Market Size, By Country, 2016�2023 (USD Million)
Table 53 Middle East & Africa: Formulation Additives Market Size, By Type, 2016�2023 (USD Million)
Table 54 Middle East & Africa: Formulation Additives Market Size, By End-Use Industry, 2016�2023 (USD Million)
Table 55 Saudi Arabia: Formulation Additives Market Size, By End-Use Industry, 2016�2023 (USD Million)
Table 56 South Africa: Formulation Additives Market Size, By End-Use Industry, 2016�2023 (USD Million)
Table 57 Rest of Middle East & Africa: Formulation Additives Market Size, By End-Use Industry, 2016�2023 (USD Million)
Table 58 South America: Formulation Additives Market Size, By Country, 2016�2023 (USD Million)
Table 59 South America: Formulation Additives Market Size, By Type, 2016�2023 (USD Million)
Table 60 South America: Formulation Additives Market Size, By End-Use Industry, 2016�2023 (USD Million)
Table 61 Brazil: Formulation Additives Market Size, By End-Use Industry, 2016�2023 (USD Million)
Table 62 Argentina: Formulation Additives Market Size, By End-Use Industry, 2016�2023 (USD Million)
Table 63 Rest of South America: Formulation Additives Market Size, By End-Use Industry, 2016�2023 (USD Million)
Table 64 New Product Launches (2013�2018)
Table 65 Expansions (2013�2018)
Table 66 Acquisitions & Partnerships (2013�2018)
List of Figures (32 Figures)
Figure 1 Formulation Additives Market Segmentation
Figure 2 Formulation Additives Market: Research Design
Figure 3 Market Size Estimation: Bottom-Up Approach
Figure 4 Market Size Estimation: Top-Down Approach
Figure 5 Formulation Additives Market: Data Triangulation
Figure 6 Rheology Modifiers to Be the Largest Type
Figure 7 Construction Industry to Register the Highest CAGR
Figure 8 India to Register the Highest CAGR in the Formulation Additives Market
Figure 9 APAC Dominated the Formulation Additives Market in 2017
Figure 10 Increasing Use of Formulation Additives in Construction and Transportation Industries to Drive the Market
Figure 11 Dispersing Agents to Be the Fastest-Growing Type of Formulation Additives Between 2018 and 2023
Figure 12 Construction is the Largest End-Use Industry
Figure 13 Construction Accounted for the Largest Market Share in 2017
Figure 14 APAC to Be the Fastest-Growing Formulation Additives Market
Figure 15 Overview of Factors Governing the Growth of the Formulation Additives Market
Figure 16 Formulation Additives Market: Porter�s Five Forces Analysis
Figure 17 Regional Snapshot: Formulation Additives Market
Figure 18 North America: Formulation Additives Market Snapshot
Figure 19 Europe: Formulation Additives Market Snapshot
Figure 20 APAC: Formulation Additives Market Snapshot
Figure 21 Brazil to Be the Largest Formulation Additives Market in South America
Figure 22 Companies Adopted New Product Launch as the Key Growth Strategy Between 2013 and 2018
Figure 23 BASF Accounted for the Largest Market Share in 2017
Figure 24 BASF: Company Snapshot
Figure 25 Eastman: Company Snapshot
Figure 26 Cabot: Company Snapshot
Figure 27 Arkema: Company Snapshot
Figure 28 BYK Additives: Company Snapshot
Figure 29 Evonik: Company Snapshot
Figure 30 DOW: Company Snapshot
Figure 31 Honeywell: Company Snapshot
Figure 32 Momentive: Company Snapshot


Growth opportunities and latent adjacency in Formulation Additives Market