Fiberglass Pipes Market by Type (GRP, GRE), Fiber (E-Glass, T-glass), Application (Oil & Gas, Chemicals, Sewage, Irrigation), and Region - Global Forecast to 2021


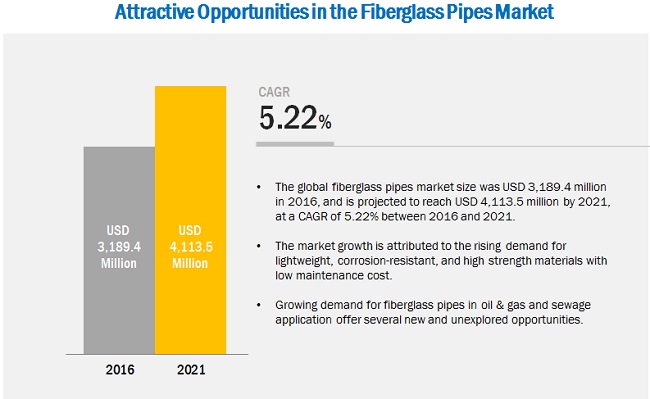
[139 Pages Report] In terms of value, the Fiberglass Pipes Market was valued at USD 3.04 Billion in 2015, and is projected to reach USD 4.11 Billion by 2021, at a CAGR of 5.22% from 2016 to 2021. Fiberglass pipes are becoming crucial in chemicals, oil & gas, and sewage applications due to the superior properties, low maintenance, and long product life. In this study, the years considered to estimate the market size of fiberglass pipes are:
- Base Year � 2015
- Estimated Year � 2016
- Projected Year � 2021
- Forecast Period � 2016 to 2021
2015 has been considered as the base year for company profiles. Whenever information was unavailable for the base year, the prior year has been considered.
Objectives of the Study
- To define, describe, and forecast the fiberglass pipes market size, in terms of value
- To identify and measure the fiberglass pipes market by type, fiber, application, and region
- To analyze significant region-specific market trends in North America, Europe, Asia-Pacific, and RoW and country-specific trends in the U.S., Canada, Mexico, Germany, France, the U.K., Russia, China, India, Japan, South Korea, and others
- To provide detailed information regarding the major factors influencing the growth of the fiberglass pipes market (drivers, restraints, opportunities, and challenges)
- To strategically profile the key market players and analyze their core competencies
- To analyze recent market developments such as agreements, acquisitions, new product launches, and expansions in the fiberglass pipes market
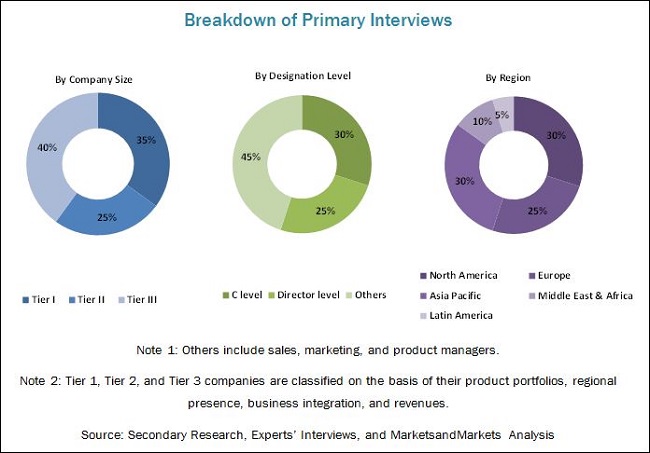
Various secondary sources such as company websites, encyclopedias, directories, and databases such as Composite World, Factiva, American Composites Manufacturers Association, and others have been used to understand and gain insights into the fiberglass pipes market. Experts from top fiberglass pipes companies have been interviewed to verify and collect critical information and to assess the trends in the fiberglass pipes market for the forecast period. The top-down, bottom-up, and data triangulation approaches have been implemented to calculate the exact values of the overall parent and individual market sizes.
To know about the assumptions considered for the study, download the pdf brochure
The fiberglass pipes market has a diversified ecosystem, including downstream stakeholders such as manufacturers, vendors, end users, and government organizations. Some of the major raw material suppliers are Arkema (France), Mitsubishi Plastics, Inc. (Japan), Formosa Plastics Corporation (Taiwan), SGL Group (Germany), SABIC (Saudi Arabia), Huntsman Corporation (U.S), and others.
The fiberglass pipes market value chain includes resin manufacturers such as Arkema (France), Mitsubishi Plastics, Inc. (Japan), Huntsman Corporation (U.S), and others. Glass fiber manufacturers include PPG Industries, Inc. (U.S.), Taishan Fiberglass Inc. (China), and others. Further, the manufacturers of fiberglass pipes supply their products to various entities in the oil & gas, chemicals, sewage, irrigation, and other applications.
This study focuses on the top investment pockets, which would help stakeholders understand and analyze the emerging trends in the fiberglass pipes market. These stakeholders include:
- Fiberglass Pipes Manufacturers
- Raw Material Suppliers
- Distributors and Suppliers
- End-use Industries
- Industry Associations
- R&D Institutions
- Environment Support Agencies
Scope of the Report:
This research report categorizes the fiberglass pipes market based on product type, application, and region. It forecasts revenue growth and analyzes trends in each of the submarkets till 2021.
Based on Type
- GRP
- GRE
- Others
Based on Fiber
- E-Glass
- T-Glass
- Others
Based on Application
- Oil & Gas
- Chemicals
- Sewage
- Irrigation
- Others
Based on Region
- North America
- Europe
- Asia-Pacific
- RoW
Available Customizations
With the given market data, MarketsandMarkets offers customizations according to the specific needs of the companies. The following customization options are available for the report:
Product Analysis
- Product matrix, which gives a detailed comparison of the product portfolio of each company
Regional Analysis
- Further breakdown of the North American fiberglass pipes market
- Further breakdown of the European fiberglass pipes market
- Further breakdown of the Asia-Pacific region fiberglass pipes market
- Further breakdown of the RoW fiberglass pipes market
Company Information
- Detailed analysis and profiles of additional market players
The global fiberglass pipes market is projected to reach USD 4.11 Billion by 2021, at a CAGR of 5.22% from 2016 to 2021. Superior mechanical properties leading to a long product life with low maintenance costs and the increasing demand for fiberglass pipes in sewage and water management applications are the key factors responsible for the growth of the fiberglass pipes market.
The fiberglass pipes market, by type, is further segmented into GRP and GRE. The GRE pipes segment accounts for the major market share owing to their high strength, high resistance to corrosion, and ease of installation. Due to these properties, GRE pipes are used in applications including oil & gas, chemicals, and sewage.
The major applications of the fiberglass pipes market include oil & gas, chemicals, sewage, and irrigation. The chemicals application is the fastest-growing application segment in the fiberglass pipes market. Fiberglass pipes offer various features including light weight, dimensional stability, resistance to corrosion, and ease of installation in comparison to traditional materials such as concrete and metallic pipes, due to which the usage of fiberglass pipes in the chemicals, oil & gas, and sewage applications is growing at a high rate.
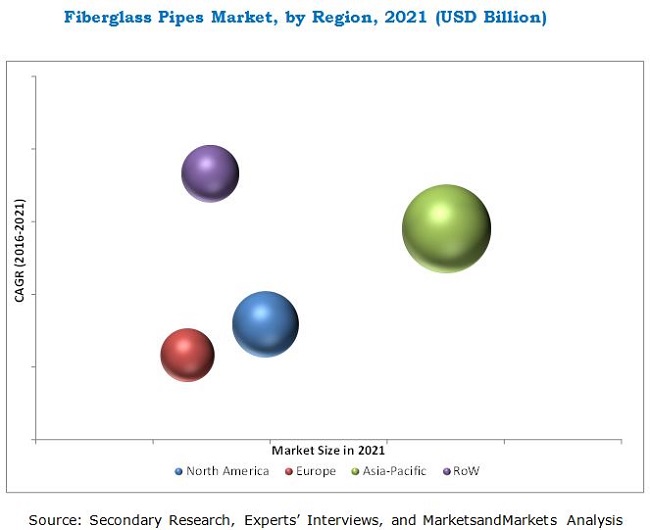
Asia-Pacific holds the largest share of the fiberglass pipes market owing to the presence of large chemical industry and government spending on water & waste management in countries such as China, India, and Indonesia. The RoW region is expected to be the fastest-growing regional market for fiberglass pipes during the next five years. The main factors that are leading to its growth are the increasing demand from the oil & gas and chemicals industries. The properties exhibited by fiberglass pipes enhance the flow characteristics, thus leading to low maintenance and long product span.
The global fiberglass pipes market is growing rapidly, in terms of value. However, the high raw material cost is a major restraint for the growth of the global fiberglass pipes market.
Companies such as Future Pipe Industries (UAE), Balaji Fiber Reinforced Plastics Ltd. (India), Chemical Process Piping Pvt. Ltd. (India), Graphite India Limited (India), Hobas (Austria), Saudi Arabian Amiantit Co. (Saudi Arabia), National Oilwell Varco (U.S.), ZCL Composites Inc. (Canada), Abu Dhabi Pipe Factory (UAE), Enduro Composites Inc. (U.S.), and others are the leading players in the global fiberglass pipes market. They have been adopting various organic and inorganic growth strategies such as agreements, new product launches, acquisitions, and expansions to enhance their shares in the global fiberglass pipes market.
To speak to our analyst for a discussion on the above findings, click Speak to Analyst
 Exclusive indicates content/data unique to MarketsandMarkets and not available with any competitors.
Table of Contents
1 Introduction (Page No. - 15)
1.1 Objectives of the Study
1.2 Market Definition
1.3 Scope of the Study
1.3.1 Years Considered for the Study
1.4 Currency
1.5 Limitations
1.6 Stakeholders
2 Research Methodology (Page No. - 18)
2.1 Research Data
2.1.1 Secondary Data
2.1.1.1 Key Data From Secondary Sources
2.1.2 Primary Data
2.1.2.1 Key Data From Primary Sources
2.1.2.2 Key Industry Insights
2.1.2.1 Breakdown of Primary Interviews
2.2 Market Size Estimation
2.2.1 Bottom-Up Approach
2.2.2 Top-Down Approach
2.2.3 Data Triangulation
2.3 Research Assumptions
3 Executive Summary (Page No. - 26)
4 Premium Insights (Page No. - 30)
4.1 Significant Opportunities in Fiberglass Pipes Market
4.2 Fiberglass Pipes Market, By Type
4.3 Fiberglass Pipes Market, By Application, and Region
4.4 Fiberglass Pipes Market Share, By Country
5 Market Overview (Page No. - 33)
5.1 Introduction
5.2 Market Dynamics
5.2.1 Drivers
5.2.1.1 Increased Production and Exploration of Oil & Gas
5.2.1.2 Increasing Demand for Fiberglass Pipes in Sewage and Water Management
5.2.2 Restraints
5.2.2.1 High Raw Material Cost
5.2.3 Opportunities
5.2.3.1 High Demand for Fiberglass Pipes in Emerging Economies
5.2.4 Challenges
5.2.4.1 Need for Low-Cost Technologies
5.3 Porter�s Five Forces Analysis
5.3.1 Threat of New Entrants
5.3.2 Threat of Substitutes
5.3.3 Bargaining Power of Buyers
5.3.4 Bargaining Power of Suppliers
5.3.5 Intensity of Competitive Rivalry
6 Macroeconomic Overview and Key Trends (Page No. - 39)
6.1 Introduction
6.2 Trends and Forecast of GDP
6.3 Per Capita GDP vs Per Capita Fiberglass Pipes Demand
6.4 Trends of Oil & Gas Production
7 Fiberglass Pipes Market, By Type (Page No. - 45)
7.1 Introduction
7.2 GRE Pipes
7.3 GRP Pipes
7.4 Other Pipes
8 Fiberglass Pipes Market, By Fiber Type (Page No. - 51)
8.1 Introduction
8.2 E-Glass
8.3 T-Glass/S-Glass/R-Glass
8.4 Others
9 Fiberglass Pipes Market, By Application (Page No. - 54)
9.1 Introduction
9.2 Oil & Gas
9.2.1 Pipelines for Oil & Gas Production
9.2.2 Downhole Tubing
9.2.3 Refinery Piping
9.2.4 Marine Piping on Vessels
9.2.5 Pipe System for Fuel Handling and Storage
9.2.6 Offshore Platform Piping
9.2.7 Floats and Dredging
9.3 Chemicals
9.4 Sewage Pipes
9.5 Irrigation
9.6 Other Applications
9.6.1 Fire & Safety
9.6.2 Paper & Pulp
9.7 GRP Pipe Market, By Application
9.7.1 Oil & Gas
9.7.2 Chemicals
9.7.3 Sewage
9.7.4 Irrigation
9.7.5 Other Applications
9.8 GRE Pipes Market, By Application
9.8.1 Oil & Gas
9.8.2 Chemicals
9.8.3 Sewage Pipes
9.8.4 Irrigation
9.8.5 Other Applications
10 Regional Analysis (Page No. - 71)
10.1 Introduction
10.2 North America
10.2.1 Fiberglass Pipes Market Size in North America, By Application
10.2.2 Fiberglass Pipes Market Size in North America, By Country
10.2.2.1 U.S.
10.2.2.1.1 By Market Size in the U.S, By Application
10.2.2.2 Canada
10.2.2.2.1 By Market Size in Canada, By Application
10.2.2.3 Mexico
10.2.2.3.1 By Market Size in Mexico, By Application
10.3 Europe
10.3.1 Fiberglass Pipes Market Size in Europe, By Application
10.3.2 Fiberglass Pipes Market Size in Europe, By Country
10.3.2.1 Germany
10.3.2.1.1 By Market Size in Germany, By Application
10.3.2.2 France
10.3.2.2.1 By Market Size in France, By Application
10.3.2.3 U.K.
10.3.2.3.1 By Market Size in the U.K., By Application
10.3.2.4 Russia
10.3.2.4.1 By Market Size in Russia, By Application
10.3.2.5 Rest of Europe
10.4 Asia-Pacific
10.4.1 Fiberglass Pipes Market Size in Asia-Pacific, By Application
10.4.2 Fiberglass Pipes Market Size in Asia-Pacific, By Country
10.4.2.1 China
10.4.2.1.1 By Market Size in China, By Application
10.4.2.2 Japan
10.4.2.2.1 By Market Size in Japan, By Application
10.4.2.3 India
10.4.2.3.1 By Market Size in India, By Application
10.4.2.4 South Korea
10.4.2.4.1 Fiberglass Pipes Market Size in South Korea, By Application
10.4.2.5 Rest of Asia-Pacific
10.5 Rest of the World (RoW)
10.5.1 Fiberglass Pipes Market Size in RoW, By Application
10.5.2 Fiberglass Pipes Market Size in RoW, By Country
10.5.2.1 Brazil
10.5.2.1.1 By Market Size in Brazil, By Application
10.5.2.2 South Africa
10.5.2.2.1 By Market Size in South Africa, By Application
10.5.2.3 Other Countries of RoW
10.6 GRP Pipes Market By Region
10.6.1 GRP Pipes Market Size in North America, By Application
10.6.2 GRP Pipes Market Size in Europe
10.6.3 GRP Pipes Market Size in Asia-Pacific
10.6.4 GRP Pipes Market Size in RoW
10.7 GRE Pipes Market By Region
10.7.1 GRE Pipes Market Size in North America
10.7.2 GRE Pipes Market Size in Europe
10.7.3 GRE Pipes Market Size in Asia-Pacific
10.7.4 GRE Pipes Market Size in RoW
11 Competitive Landscape (Page No. - 101)
11.1 Overview
11.2 Competitive Situation and Trends
11.3 Market Ranking of Key Players
11.3.1 Ranking of Top 5 Players in the Fiberglass Pipes Market, 2015
11.4 Recent Developments
11.4.1 Agreements
11.4.2 Acquisitions
11.4.3 New Product Launches
11.4.4 Expansions
12 Company Profiles (Page No. - 108)
(Overview, Products and Services, Financials, Strategy & Development)*
12.1 Abu Dhabi Pipe Factory
12.2 Balaji Fiber Reinforced Pvt. Ltd.
12.3 Chemical Process Piping Pvt. Ltd.
12.4 Future Pipe Industries
12.5 Graphite India Limited
12.6 HOBAS
12.7 Hengrun Group Co., Ltd.
12.8 Enduro Composites, Inc.
12.9 Lianyungang Zhongfu Lianzhong Composites Group Co., Ltd.
12.10 National Oilwell Varco
12.11 Saudi Arabian Amiantit Co.
12.12 ZCL Composites Inc.
*Details on Overview, Products and Services, Financials, Strategy & Development Might Not Be Captured in Case of Unlisted Companies
13 Appendix (Page No. - 131)
13.1 Insights From Industry Experts
13.2 Discussion Guide
13.3 Knowledge Store: Marketsandmarkets� Subscription Portal
13.4 Introducing RT: Real-Time Market Intelligence
13.5 Available Customizations
13.6 Related Reports
13.7 Author Details
List of Tables (110 Tables)
Table 1 Trends and Forecast of Gdp, 2015�2021 (USD Billion)
Table 2 Per Capita GDP vs Per Capita Fiberglass Pipes Demand, 2015
Table 3 Trend of Oil Production, By Country (Thousand Barrels Per Day)
Table 4 Trend of Gas Production, By Country (Billion Cubic Meters)
Table 5 Fiberglass Pipes Market Size, By Type, 2014�2021 (Kiloton)
Table 6 Fiberglass Pipes Market Size, By Type, 2014�2021 (USD Million)
Table 7 Fiberglass Pipes Market Size, By Application, 2014�2021 (Kiloton)
Table 8 Fiberglass Pipes Market Size, By Application, 2014�2021 (USD Million)
Table 9 Fiberglass Pipes Market Size, By Application, 2014�2021 (Kiloton)
Table 10 Fiberglass Pipes Market Size, By Application, 2014�2021 (USD Million)
Table 11 Other Fiberglass Pipes Market Size, By Application, 2014�2021 (Kiloton)
Table 12 Other Fiberglass Pipes Market Size, By Application, 2014�2021 (USD Million)
Table 13 Fiberglass Pipes Market Size, By Fiber Type, 2014�2021 (Kiloton)
Table 14 Fiberglass Pipes Market Size, By Type, 2014�2021 (USD Million)
Table 15 Fiberglass Pipes Market Size, By Application, 2014�2021 (Kiloton)
Table 16 Fiberglass Pipes Market Size, By Application, 2014�2021 (USD Million)
Table 17 Fiberglass Pipes Market Size in Oil & Gas Application, By Region, 2014�2021 (Kiloton)
Table 18 Fiberglass Pipes Market Size in Oil & Gas Application, By Region, 2014�2021 (USD Million)
Table 19 Fiberglass Pipes Market Size in Chemicals Application, By Region, 2014�2021 (Kiloton)
Table 20 Fiberglass Pipes Market Size in Chemicals Application, By Region, 2014�2021 (USD Million)
Table 21 Fiberglass Pipes Market Size in Sewage Pipes Application, By Region, 2014�2021 (Kiloton)
Table 22 Fiberglass Pipes Market Size in Sewage Pipes Application, By Region, 2014�2021 (USD Million)
Table 23 Fiberglass Pipes Market Size in Irrigation Application, By Region, 2014�2021 (Kiloton)
Table 24 Fiberglass Pipes Market Size in Irrigation Application, By Region, 2014�2021 (USD Million)
Table 25 Fiberglass Pipes Market Size in Other Applications, By Region, 2014�2021 (Kiloton)
Table 26 Fiberglass Pipes Market Size in Other Applications, By Region, 2014�2021 (USD Million)
Table 27 Fiberglass Pipes Market Size in Oil & Gas Application, By Region, 2014�2021 (Kiloton)
Table 28 Fiberglass Pipes Market Size in Oil & Gas Application, By Region, 2014�2021 (USD Million)
Table 29 Fiberglass Pipes Market Size in Chemicals Application, By Region, 2014�2021 (Kiloton)
Table 30 Fiberglass Pipes Market Size in Chemicals Application, By Region, 2014�2021 (USD Million)
Table 31 By Market Size in Sewage Pipes Application, By Region, 2014�2021 (Kiloton)
Table 32 By Market Size in Sewage Pipes Application, By Region, 2014�2021 (USD Million)
Table 33 By Market Size in Irrigation Application, By Region, 2014�2021 (Kiloton)
Table 34 By Market Size in Irrigation Application, By Region, 2014�2021 (USD Million)
Table 35 By Market Size in Other Applications, By Region, 2014�2021 (Kiloton)
Table 36 By Market Size in Other Applications, By Region, 2014�2021 (USD Million)
Table 37 By Market Size in Oil & Gas Application, By Region, 2014�2021 (Kiloton)
Table 38 By Market Size in Oil & Gas Application, By Region, 2014�2021 (USD Million)
Table 39 By Market Size in Chemicals Application, By Region, 2014�2021 (Kiloton)
Table 40 By Market Size in Chemicals Application, By Region, 2014�2021 (USD Million)
Table 41 By Market Size in Sewage Pipes Application, By Region, 2014�2021 (Kiloton)
Table 42 By Market Size in Sewage Pipes Application, By Region, 2014�2021 (USD Million)
Table 43 By Market Size in Irrigation Application, By Region, 2014�2021 (Kiloton)
Table 44 By Market Size in Irrigation Application, By Region, 2014�2021 (USD Million)
Table 45 By Market Size in Other Applications, By Region, 2014�2021 (Kiloton)
Table 46 By Market Size in Other Applications, By Region, 2014�2021 (USD Million)
Table 47 By Market Size, By Region, 2014�2021 (Kiloton)
Table 48 By Market Size, By Region, 2014�2021 (USD Million)
Table 49 North America: By Market Size, By Application, 2014�2021 (Kiloton)
Table 50 North America: By Market Size, By Application, 2014�2021 (USD Million)
Table 51 North America: By Market Size, By Country, 2014�2021 (Kiloton)
Table 52 North America: By Market Size, By Country, 2014�2021 (USD Million)
Table 53 U.S.: By Market Size, By Application, 2014�2021 (Kiloton)
Table 54 U.S.: By Market Size, By Application, 2014�2021 (USD Million)
Table 55 Canada: By Market Size, By Application, 2014�2021 (Kiloton)
Table 56 Canada: By Market Size, By Application, 2014�2021 (USD Million)
Table 57 Mexico: By Market Size, By Application, 2014�2021 (Kiloton)
Table 58 Mexico: By Market Size, By Application, 2014�2021 (USD Million)
Table 59 Europe: By Market Size, By Application, 2014�2021 (Kiloton)
Table 60 Europe: By Market Size, By Application, 2014�2021 (USD Million)
Table 61 Europe: By Market Size, By Country, 2014�2021 (Kiloton)
Table 62 Europe: By Market Size, By Country, 2014�2021 (USD Million)
Table 63 Germany: By Market Size, By Application, 2014�2021 (Kiloton)
Table 64 Germany: By Market Size, By Application, 2014�2021 (USD Million)
Table 65 France: By Market Size, By Application, 2014�2021 (Kiloton)
Table 66 France: By Market Size, By Application, 2014�2021 (USD Million)
Table 67 U.K.: By Market Size, By Application, 2014�2021 (Kiloton)
Table 68 U.K.: By Market Size, By Application, 2014�2021 (USD Million)
Table 69 Russia: By Market Size, By Application, 2014�2021 (Kiloton)
Table 70 Russia: By Market Size, By Application, 2014�2021 (USD Million)
Table 71 Asia-Pacific: Fiberglass Pipes Market Size, By Application, 2014�2021 (Kiloton)
Table 72 Asia-Pacific: By s Market Size, By Application, 2014�2021 (USD Million)
Table 73 Asia-Pacific: By Market Size, By Country, 2014�2021 (Kiloton)
Table 74 Asia-Pacific: By Market Size, By Country, 2014�2021 (USD Million)
Table 75 China: By Market Size, By Application, 2014�2021 (Kiloton)
Table 76 China: By Market Size, By Application, 2014�2021 (USD Million)
Table 77 Japan: By Market Size, By Application, 2014�2021 (Kiloton)
Table 78 Japan: By Market Size, By Application, 2014�2021 (USD Million)
Table 79 India: By Market Size, By Application, 2014�2021 (Kiloton)
Table 80 India: By Market Size, By Application, 2014�2021 (USD Million)
Table 81 South Korea: Fiberglass Pipes Market Size, By Application, 2014�2021 (Kiloton)
Table 82 South Korea: By Market Size, By Application, 2014�2021 (USD Million)
Table 83 RoW: Fiberglass Pipes Market Size, By Application, 2014�2021 (Kiloton)
Table 84 RoW: Fiberglass Pipes Market Size, By Application, 2014�2021 (USD Million)
Table 85 RoW: Fiberglass Pipes Market Size, By Country, 2014�2021 (Kiloton)
Table 86 RoW: Fiberglass Pipes Market Size, By Country, 2014�2021 (USD Million)
Table 87 Brazil: Fiberglass Pipes Market Size, By Application, 2014�2021 (Kiloton)
Table 88 Brazil: Fiberglass Pipes Market Size, By Application, 2014�2021 (USD Million)
Table 89 South Africa: Fiberglass Pipes Market Size, By Application, 2014�2021 (Kiloton)
Table 90 South Africa: Fiberglass Pipes Market Size, By Application, 2014�2021 (USD Million)
Table 91 North America: GRP Pipes Market Size, By Application, 2014�2021 (Kiloton)
Table 92 North America: GRP Pipes Market Size, By Application, 2014�2021 (USD Million)
Table 93 Europe: GRP Pipes Market Size, By Application, 2014�2021 (Kiloton)
Table 94 Europe: GRP Pipes Market Size, By Application, 2014�2021 (USD Million)
Table 95 Asia-Pacific: GRP Pipes Market Size, By Application, 2014�2021 (Kiloton)
Table 96 Asia-Pacific: GRP Pipes Market Size, By Application, 2014�2021 (USD Million)
Table 97 RoW: GRP Pipes Market Size, By Application, 2014�2021 (Kiloton)
Table 98 RoW: GRP Pipes Market Size, By Application, 2014�2021 (USD Million)
Table 99 North America: GRE Pipes Market Size, By Application, 2014�2021 (Kiloton)
Table 100 North America: GRE Pipes Market Size, By Application, 2014�2021 (USD Million)
Table 101 Europe: GRE Pipes Market Size, By Application, 2014�2021 (Kiloton)
Table 102 Europe: GRE Pipes Market Size, By Application, 2014�2021 (USD Million)
Table 103 Asia-Pacific: GRE Pipes Market Size, By Application, 2014�2021 (Kiloton)
Table 104 Asia-Pacific: GRE Pipes Market Size, By Application, 2014�2021 (USD Million)
Table 105 RoW: GRE Pipes Market Size, By Application, 2014�2021 (Kiloton)
Table 106 RoW: GRE Pipes Market Size, By Application, 2014�2021 (USD Million)
Table 107 Agreements, 2011�2016
Table 108 Acquisitions, 2011�2016
Table 109 New Product Launches, 2011�2016
Table 110 Expansions, 2011�2016
List of Figures (44 Figures)
Figure 1 Fiberglass Pipes: Market Segmentation
Figure 2 Fiberglass Pipes Market: Research Design
Figure 3 Market Size Estimation: Bottom-Up Approach
Figure 4 Market Size Estimation: Top-Down Approach
Figure 5 Fiberglass Pipes Market: Data Triangulation
Figure 6 Sewage Application to Drive Fiberglass Pipes Market Between 2016 and 2021
Figure 7 E-Glass Fiber-Based Fiberglass Pipes to Register Highest CAGR (2016 vs 2021)
Figure 8 GRE Pipes to Drive Fiberglass Pipes Market Between 2016 and 2021
Figure 9 Asia-Pacific Was Largest Fiberglass Pipes Market in 2015
Figure 10 Attractive Opportunities in Fiberglass Pipes Market, Between 2016 and 2021
Figure 11 GRE Pipes to Dominate Fiberglass Pipes Market
Figure 12 Asia-Pacific Dominated Fiberglass Pipes Market in 2015
Figure 13 India is Projected to Register Highest CAGR in Fiberglass Pipes Market in 2015
Figure 14 Drivers, Restraints, Opportunities, and Challenges of Fiberglass Pipes Market
Figure 15 Porter�s Five Forces Analysis of Fiberglass Pipes Market
Figure 16 Relative GDP Growth Scenario of Key Economies (2015-2021)
Figure 17 Per Capita GDP vs Per Capita Fiberglass Pipes Demand (2015)
Figure 18 U.S. is Largest Country in Terms of Oil Production, 2015
Figure 19 U.S. is Largest Country in Terms of Gas Production, 2015
Figure 20 GRE Pipes to Dominate the Fiberglass Pipes Market Between 2016 and 2021
Figure 21 Chemical Application to Lead the GRE Pipes Market During the Forecast Period
Figure 22 Sewage Application to Lead the GRP Pipes Market During the Forecast Period
Figure 23 E-Glass Fiber Dominate the Fiberglass Pipes Market
Figure 24 Sewage Pipes Application to Lead the Fiberglass Pipes Market
Figure 25 North America to Dominate the Fiberglass Pipes Market in Oil & Gas Application
Figure 26 Asia-Pacific to Dominate Fiberglass Pipes Market in Chemicals Application
Figure 27 Asia-Pacific to Dominate Fiberglass Pipes Market in Sewage Pipes Application
Figure 28 India and South Korea to Be the Fastest-Growing Fiberglass Pipes Market
Figure 29 North America Fiberglass Pipes Market Snapshot: the U.S. is the Most Lucrative Market
Figure 30 Europe Fiberglass Pipes Market Snapshot: Germany is the Most Lucrative Market
Figure 31 Asia-Pacific Fiberglass Pipes Market Snapshot: China is the Largest Market
Figure 32 Brazil is the Most Lucrative Fiberglass Pipes Market
Figure 33 Companies Adopted Agreements as the Key Growth Strategy Between 2011 and 2016
Figure 34 Agreements Was the Most Preferred Strategy Adopted Between 2011 and 2016
Figure 35 Market Evaluation Framework: Significant Number of Agreements Have Fueled Growth and Innovation, 2011�2016
Figure 36 Future Pipe Industries: SWOT Analysis
Figure 37 Graphite India Limited: Company Snapshot
Figure 38 HOBAS: SWOT Analysis
Figure 39 National Oilwell Varco: Company Snapshot
Figure 40 National Oilwell Varco: SWOT Analysis
Figure 41 Saudi Arabian Amiantit Co.: Company Snapshot
Figure 42 Saudi Arabian Amiantit Co.: SWOT Analysis
Figure 43 ZCL Composites Inc.: Company Snapshot
Figure 44 ZCL Composites Inc.: SWOT Analysis


Growth opportunities and latent adjacency in Fiberglass Pipes Market