Earthen Plasters Market by Type (Iron, Calcium, Magnesium, Silicates, Aluminium), Application (Walls, Roofs, Masonry, Agriculture,) and Region (APAC, North America, Europe, MEA & South America) - Global Forecast to 2026
Updated on : September 03, 2025
Earthen Plasters Market
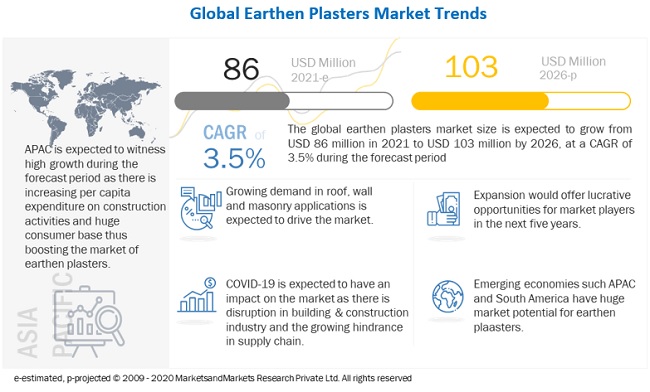
The global earthen plasters market was valued at USD 84.4 million in 2021 and is projected to reach USD 103.0 million by 2026, growing at 3.5% cagr from 2021 to 2026. The driving factors for the market is the advantages of clay plasters over other natural plasters, the growth in industrial, commercial & residential construction activities. This driving factor is boosting the demand for the industry.
To know about the assumptions considered for the study, Request for Free Sample Report
COVID-19 Impact on the Earthen plasters market
The global earthen plasters market includes major Tier I and II suppliers like American Clay Enterprises LLC (US), Clayworks (India), Claytech Baustoffe Aus Lehm (UK), Conluto (Germany) and Clay.lt (Lithuania). These suppliers have their manufacturing facilities spread across various countries across Asia Pacific, Europe, North America, and Rest of the World. COVID-19 has impacted their businesses as well.
The global earthen plasters market is expected to witness a slower growth rate in 2020-2021, as the building & construction sectors have been significantly hit by the covid-19 pandemic. China is expected to recover as the impact of the pandemic decreases. Southeast Asia and India is expected to have significant growth. MEA will experience a moderate growth. A modest increase is expected in North America, Central and South America, Central and Eastern Europe, and other Northeast Asian markets (excluding China and Japan). The market will grow with a limited pace in Europe and Japan.
Earthen Plasters Market Dynamics
Driver: Advantages of clay plasters over other natural plasters
- Earthen plasters is a practical, environmentally friendly, durable, affordable, and easy to repair material that can be used instead of paint to decorate interior walls and ceilings. Earthen plasters is made from pure clays and aggregates, with coloring that comes from natural oxides and ochre mineral pigments. It also contains borax, a natural mineral anti-molding agent. Earthen plasters can improve your health. They are non-toxic, contain no volatile organic compounds (VOCs). When clay plasters meets water, it emits a negative charge. These negative ions release into the air and help humans absorb oxygen. This helps to counteract positive charges and ions emitted by electronics and certain plastics. Because these plasters are porous, they can breathe by absorbing humidity and moisture. They help control indoor climate and air quality. This helps regulate temperature, preventing the growth of mold and bacteria. All earthen plasters are fire retardant. Additional benefits of using natural clay plasters include:
- Unique design effects: Different varieties of clay plasters are available to create wall textures ranging from marble-smooth and soft suede to rugged finishes that include mica chips, shredded straw and recycled colored glass.
- • Versatility in application: It can be applied over drywall, stucco, wallpaper, concrete, brick and adobe walls and ceilings. It can even be used in wet areas such as kitchens and bathrooms if the walls are sealed to protect against splashing from sinks, bathtubs, and showers.
- Healthier indoor environment: Clay plasters add negative ions to the air, which help neutralize the electromagnetic effect created by computers, appliances, and synthetic plastics prevalent in today's homes. Negative ions are believed to produce biochemical reactions in the body that increase the serotonin level, helping to alleviate depression, relieve stress and boost daytime energy.
Restraint: Sensitivity to water and frost
Clay is a moisture-sensitive material and should always be protected from rain and splashing water. If earthen plasters is permanently moistened, it loses its stability and begins to weather. For protection against rain, setting up horizontal barriers and providing suitable outdoor rain protection is must. By absorbing and releasing water vapor, the volume of earthen plasters changes: Therefore, the building material should only be provided with coatings that are elastic enough not to break. A short-term water vapor absorption can also be used positively to keep damp areas mold-free.
Another disadvantage of earthen plasters is the relatively high frost sensitivity of the material. If there is a certain amount of water in the clay and this water freezes, then the result is frostbite. That is why wet clay is applied outdoors only in the months of April to September - this of course also applies to indoor areas in the unheated raw state
Opportunity: Rise in demand for green buildings
Green buildings are defined as structures that are environmentally responsible and resource-efficient throughout their lifecycle. These buildings provide various benefits, such as energy efficiency, sustainability, efficient use of resources, environment protection, and higher resale value. Properties of clay such as it being natural, durable and affordable make it an excellent option to be used as a green building material. The increase in demand for green products will highly influence the growth of the earthen plasters market. Green buildings are already trendy in the US and countries of Europe. They are penetrating Asia, the Middle East, and Latin America.
In North America, the US Green Building Council ensures that the buildings are sustainable and utilize green materials for construction purposes through LEED, which is a leading program for green buildings. The European Commission (EC) started the Green Building Program, which aims to create awareness regarding green buildings and give recognition to corporates committed to this initiative.
With cement production alone contributing to nearly 8% of CO2 emissions globally (Trends in Global CO2 emissions: 2016 Report by PBL Netherlands Environmental Assessment Agency), discussion for using environment friendly products were in limelight. Earth houses, as they are called, are making a comeback across the globe. The structures, designed to use natural light and produce natural cooling, are built with local natural resources such as bamboo, clay, cow dung, stones and straw by local artisans further reduces the carbon footprint to almost nil. Numerous organizations of India such as Thannal and Vasthukam in Kerala, Made in Earth in Bengaluru, Auroville Earth Institute in Auroville — and architects such as Dharamsala-based Didi Contractor, Chennai-based Benny Kuriakose, Kerala-based Eugene Pandala and Goa-based Gerard da Cunha are spearheading the movement to use natural products in construction.
Challenges: Lack of awareness towards earthen plasters
Awareness towards earthen plasters is very less globally. The know-how for earthen plasters is limited to small regions. The major companies are in Europe whereas emerging countries shows slight share in the earthen plasters market. The market has not seen major technology advancements and upgradations and is consumed in various less parts of world. The people are still stringent to use earthen plasters over conventional ways of plasters due to less knowledge about the products and less manufacturers.
To know about the assumptions considered for the study, download the pdf brochure
“The earthen plasters market is projected to register a CAGR of 3.5% during the forecast period, in terms of value.”
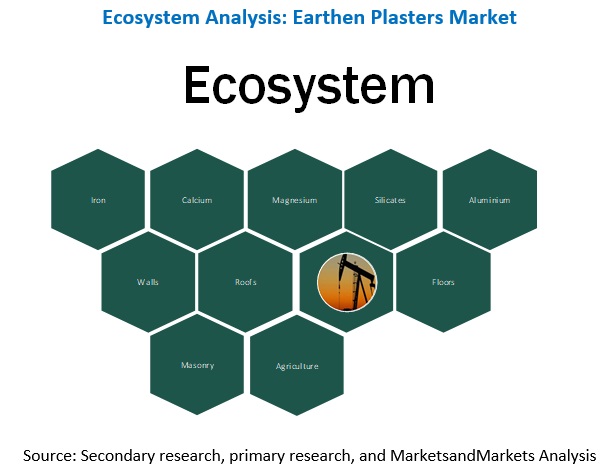
The growth is due to the growing demand of earthen plasters in roof, Walls, Masonry, Agriculture and Floors applications throughout the world. The increasing demand from the masonry, Walls and agriculture applications sector is boosting the demand for earthen plasters.
“APAC is the largest market for earthen plasters .”
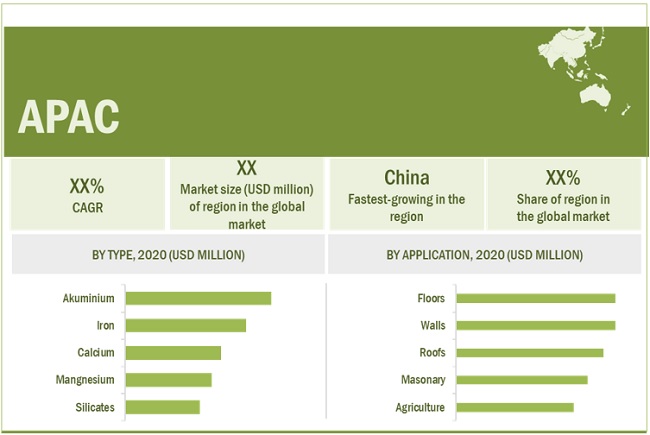
APAC accounted for the largest share of the earthen plasters market in 2020. The market in the region is growing because of the huge consumer base increase in the per captia expenditure on construction activities. These two factors align themselves proportionally to facilitate the growth of the market.
Earthen Plasters Market Players
Earthen plasters is a consolidated market with a large number of global players and few regional and local players. American Clay Enterprises LLC (US), Clayworks (India), Claytech Baustoffe Aus Lehm (UK), Conluto (Germany) and Clay.lt (Lithuania) are some of the key players in the market.
Earthen Plasters Market Report Scope
|
Report Metric |
Details |
|
Market Size Value in 2021 |
USD 84.4 million |
|
Revenue Forecast in 2026 |
USD 103.0 million |
|
CAGR |
3.5% |
|
Market Size Available for Years |
2019-2026 |
|
Base Year Considered |
2020 |
|
Forecast Period |
2021-2026 |
|
Forecast Units |
Value (USD million) and Volume (Kiloton) |
|
Segments Covered |
Type, Application and Region |
|
Geographies Covered |
North America, Asia Pacific, Europe, Middle East & Africa and South America |
|
Companies Covered |
Some of the leading players operating in the earthen plasters market include like American Clay Enterprises LLC (US), Clayworks (India), Claytech Baustoffe Aus Lehm (UK), Conluto |
This research report categorizes the earthen plasters market based on type, application, and region.
Earthen Plasters Market By Type:
- Iron
- Calcium
- Magnesium
- Silicates
- Aluminum
Earthen Plasters Market By Application:
- Walls
- Roofs
- Masonry
- Agriculture
- Others
Earthen Plasters Market By Region:
- Asia Pacific
- North America
- Europe
- Middle East & Africa
- South America
Recent Developments
- In January 2021, Clayworks conducted a project with Dulong Store (Copenhagen). Norm Architects combined natural materials to create a calm finish for the jewelry showroom in Copenhagen, which was informed by modernist artists' studios. The studio used a light clay plaster with a smooth finish as the backdrop for the store that has oak flooring and travertine furniture.
- In January 2021, Claytech Baustoffe Aus Lehm conducted a project with BAU in Mousonturm. It is a "eco-friendly cave" consists of a wooden structure around which the natural building material clay is placed in organic movements. Between two walls of the wooden structure, the inner wall, with polymorphic openings as windows, forms the view of the oval of the stage.
- Conluto has a done a project with Straw Bale House. Under this project, a total of 4 big bags of clay concealed plasters and 2 big bags of clay top plasters were used on a 105 m² wall surface (after deducting the large window surfaces).
Frequently Asked Questions (FAQ):
Does this report cover volume tables in addition to the value tables?
Yes, volume tables are provided for each segment except offering.
Which countries are considered in the European region?
The report includes the following European countries
- Germany
- U.K.
- Italy
- Russia
- France
- Rest of Europe
What is the COVID-19 impact on the construction silicone sealants market?
Industry experts believe that COVID-19 would have a significant impact on earthen plasters market. There seems to be slower in the demand for earthen plasters from the construction and agriculture applications, during COVID-19. .
To speak to our analyst for a discussion on the above findings, click Speak to Analyst

TABLE OF CONTENTS
1 INTRODUCTION (Page No. - 24)
1.1 OBJECTIVES OF THE STUDY
1.2 MARKET DEFINITION
1.2.1 INCLUSIONS & EXCLUSIONS
1.3 MARKET SCOPE
1.3.1 EARTHEN PLASTERS MARKET SEGMENTATION
1.3.2 REGIONS COVERED
1.3.3 YEARS CONSIDERED FOR THE STUDY
1.4 CURRENCY
1.5 UNIT CONSIDERED
1.6 LIMITATION
1.7 STAKEHOLDERS
2 RESEARCH METHODOLOGY (Page No. - 27)
2.1 RESEARCH DATA
FIGURE 1 EARTHEN PLASTERS MARKET: RESEARCH DESIGN
2.1.1 SECONDARY DATA
2.1.1.1 Critical secondary inputs
2.1.1.2 Key data from secondary sources
2.1.2 PRIMARY DATA
2.1.2.1 Critical primary inputs
2.1.2.2 Key data from primary sources
2.1.2.3 Key industry insights
2.1.2.4 Breakdown of primary interviews
2.2 BASE NUMBER CALCULATION APPROACH
2.2.1 ESTIMATION OF EARTHEN PLASTERS MARKET SIZE BASED ON MARKET SHARE ANALYSIS
FIGURE 2 MARKET SIZE ESTIMATION: SUPPLY–SIDE ANALYSIS
2.3 MARKET SIZE ESTIMATION
2.3.1 MARKET SIZE ESTIMATION METHODOLOGY: BOTTOM–UP APPROACH
2.3.2 MARKET SIZE ESTIMATION METHODOLOGY: TOP–DOWN APPROACH
2.4 DATA TRIANGULATION
FIGURE 3 EARTHEN PLASTERS MARKET: DATA TRIANGULATION
2.4.1 RESEARCH ASSUMPTIONS
2.4.2 LIMITATION
2.4.3 GROWTH RATE ASSUMPTIONS
2.4.4 FACTOR ANALYSIS IMPACTING GROWTH
3 EXECUTIVE SUMMARY (Page No. - 35)
FIGURE 4 ALUMINUM TYPE TO LEAD THE EARTHEN PLASTERS MARKET
FIGURE 5 ROOFS APPLICATION ACCOUNTED FOR HIGHEST CAGR IN THE EARTHEN PLASTERS MARKET
FIGURE 6 NORTH AMERICA LED THE EARTHEN PLASTERS MARKET IN 2020
4 PREMIUM INSIGHTS (Page No. - 38)
4.1 HIGH–GRADE EARTHEN PLASTERS TO OFFER LUCRATIVE OPPORTUNITIES TO MARKET PLAYERS
FIGURE 7 EMERGING COUNTRIES TO BE ATTRACTIVE MARKETS FOR EARTHEN PLASTERS DURING THE FORECAST PERIOD
4.2 APAC: EARTHEN PLASTERS MARKET, BY END–USE INDUSTRY AND COUNTRY
FIGURE 8 CHINA WAS THE LARGEST MARKET FOR EARTHEN PLASTERS IN APAC IN 2020
4.3 EARTHEN PLASTERS MARKET, BY TYPE
FIGURE 9 ALUMINUM TO LEAD THE EARTHEN PLASTERS MARKET DURING THE FORECAST PERIOD
4.4 EARTHEN PLASTERS MARKET, BY APPLICATION
FIGURE 10 ROOFS APPLICATION TO WITNESS HIGHEST GROWTH IN THE EARTHEN PLASTERS MARKET
4.5 EARTHEN PLASTERS MARKET, BY COUNTRY
FIGURE 11 THE EARTHEN PLASTERS MARKET IN CHINA IS PROJECTED TO GROW AT THE HIGHEST CAGR
5 MARKET OVERVIEW (Page No. - 41)
5.1 INTRODUCTION
5.2 COVID–19 ECONOMIC ASSESSMENT
FIGURE 12 REVISED GDP FORECASTS FOR SELECT G20 COUNTRIES IN 2020
5.3 MARKET DYNAMICS
FIGURE 13 DRIVERS, RESTRAINTS, OPPORTUNITIES, AND CHALLENGES IN THE EARTHEN PLASTERS MARKET
5.3.1 DRIVERS
5.3.1.1 Advantages of clay plaster over other natural plasters
5.3.1.2 Increase in industrial, commercial, and residential construction activities
5.3.2 RESTRAINTS
5.3.2.1 Downsides of the use of earthen plasters
5.3.2.2 Sensitivity to water and frost
5.3.3 OPPORTUNITIES
5.3.3.1 Rise in demand for green buildings
5.3.3.2 Growth in investment in infrastructural projects in developing economies
5.3.4 CHALLENGES
5.3.4.1 Lack of awareness regarding earthen plasters
6 INDUSTRY TRENDS (Page No. - 46)
6.1 PORTER’S FIVE FORCES ANALYSIS
FIGURE 14 EARTHEN PLASTERS: PORTER’S FIVE FORCES ANALYSIS
TABLE 1 EARTHEN PLASTERS MARKET: PORTER’S FIVE FORCES ANALYSIS
6.1.1 BARGAINING POWER OF SUPPLIERS
6.1.2 THREAT OF NEW ENTRANTS
6.1.3 THREAT OF SUBSTITUTES
6.1.4 BARGAINING POWER OF BUYERS
6.1.5 INTENSITY OF COMPETITIVE RIVALRY
6.2 VALUE CHAIN ANALYSIS
FIGURE 15 PRODUCTION PROCESS CONTRIBUTES THE HIGHEST VALUE TO OVERALL PRICE OF EARTHEN PLASTERS
6.3 SUPPLY CHAIN ANALYSIS
FIGURE 16 SUPPLY CHAIN OF EARTHEN PLASTERS INDUSTRY
TABLE 2 EARTHEN PLASTERS MARKET: VALUE CHAIN
6.3.1 IMPACT OF COVID–19 ON SUPPLY CHAIN
6.3.2 IMPACT OF COVID–19 ON END–USE INDUSTRIES OF EARTHEN PLASTERS
6.3.3 COVID–19 IMPACT ON BUILDING & CONSTRUCTION INDUSTRY
6.3.4 COVID–19 IMPACT ON CHEMICAL INDUSTRY
6.4 YC & YCC SHIFT
6.4.1 REVENUE SHIFT & NEW REVENUE POCKETS FOR EARTHEN PLASTER MANUFACTURERS
FIGURE 17 REVENUE SHIFT FOR EARTHEN PLASTER MANUFACTURERS
6.5 TRADE ANALYSIS
TABLE 3 CLAY TRADE DATA 2019 (USD MILLION)
6.6 ECOSYSTEM
6.7 PRICING ANALYSIS
FIGURE 18 AVERAGE SELLING PRICE (2020–2026)
6.8 TECHNOLOGY ANALYSIS
6.9 CASE STUDY ANALYSIS
6.10 REGULATORY ANALYSIS
6.10.1 DIN 18947 STANDARDS
6.10.2 ASTM STANDARDS
6.10.3 INDIAN STANDARDS
6.11 PATENT ANALYSIS
6.11.1 INTRODUCTION
6.11.2 METHODOLOGY
6.11.3 DOCUMENT TYPE
TABLE 4 THE GRANTED PATENTS ARE 14% OF THE TOTAL COUNT IN LAST 10 YEARS
FIGURE 19 NUMBER OF PATENTS REGISTERED IN LAST 10.I YEARS
6.11.4 PATENT PUBLICATION TRENDS
FIGURE 20 NUMBER OF PATENTS YEAR–WISE IN LAST 10 YEARS
6.11.5 INSIGHTS
6.11.6 JURISDICTION ANALYSIS
FIGURE 21 CHINA ACCOUNTED FOR THE HIGHEST NUMBER OF PATENTS
6.11.7 TOP COMPANIES/APPLICANTS
FIGURE 22 TOP 10 COMPANIES/APPLICANTS WITH HIGHEST NUMBER OF PATENTS
TABLE 5 LIST OF PATENTS
7 IMPACT OF COVID–19 ON EARTHEN PLASTERS MARKET, SCENARIO ANALYSIS, BY REGION (Page No. - 60)
7.1 SCENARIO ANALYSIS
7.2 RANGE SCENARIOS OF EARTHEN PLASTERS MARKET
7.2.1 OPTIMISTIC SCENARIO
7.2.2 PESSIMISTIC SCENARIO
7.2.3 REALISTIC SCENARIO
8 EARTHEN PLASTERS MARKET, BY TYPE (Page No. - 62)
8.1 INTRODUCTION
FIGURE 23 ALUMINUM SEGMENT TO EXHIBIT HIGHEST GROWTH RATE
TABLE 6 EARTHEN PLASTERS MARKET SIZE, BY TYPE, 2019–2026 (USD MILLION)
TABLE 7 EARTHEN PLASTERS MARKET SIZE, BY TYPE, 2019–2026 (TON)
8.2 IRON
8.2.1 OFFERS PROPERTY OF EASY MODIFICATION TO CLAY
TABLE 8 IRON: EARTHEN PLASTERS MARKET SIZE, BY REGION, 2019–2026 (USD MILLION)
TABLE 9 IRON: EARTHEN PLASTERS MARKET SIZE, BY REGION, 2019–2026 (TON)
8.3 MAGNESIUM
8.3.1 ACCOMMODATING IN AGRICULTURAL USE
TABLE 10 MAGNESIUM: EARTHEN PLASTERS MARKET SIZE, BY REGION, 2019–2026 (USD MILLION)
TABLE 11 MAGNESIUM: EARTHEN PLASTERS MARKET SIZE, BY REGION, 2019–2026 (TON)
8.4 CALCIUM
8.4.1 BINDS CLAY SOIL TO AVOID BREAKDOWN OF SOIL
TABLE 12 CALCIUM: EARTHEN PLASTERS MARKET SIZE, BY REGION, 2019–2026 (USD MILLION)
TABLE 13 CALCIUM: EARTHEN PLASTERS MARKET SIZE, BY REGION, 2019–2026 (TON)
8.5 SILICATES
8.5.1 OFFERS DURABILITY AGAINST RAINWATER
TABLE 14 SILICATES: EARTHEN PLASTERS MARKET SIZE, BY REGION, 2019–2026 (USD MILLION)
TABLE 15 SILICATE: EARTHEN PLASTERS MARKET SIZE, BY REGION, 2019–2026 (TON)
8.6 ALUMINUM
8.6.1 EXCELLENT SOIL STABILIZING PROPERTY TO BOOST THE MARKET
TABLE 16 ALUMINUM: EARTHEN PLASTERS MARKET SIZE, BY REGION, 2019–2026 (USD MILLION)
TABLE 17 ALUMINUM: EARTHEN PLASTERS MARKET SIZE, BY REGION, 2019–2026 (TON)
9 EARTHEN PLASTERS MARKET, BY APPLICATION (Page No. - 69)
9.1 INTRODUCTION
FIGURE 24 ROOFS APPLICATION TO EXHIBIT HIGHEST GROWTH RATE IN THE EARTHEN PLASTERS MARKET
TABLE 18 EARTHEN PLASTERS MARKET SIZE, BY APPLICATION, 2019–2026 (USD MILLION)
TABLE 19 EARTHEN PLASTERS MARKET SIZE, BY APPLICATION, 2019–2026 (TON)
9.2 WALLS
9.2.1 WALLS HAD LARGEST SHARE IN THE MARKET IN 2020
TABLE 20 WALLS: EARTHEN PLASTERS MARKET SIZE BY REGION, 2019–2026 (USD MILLION)
TABLE 21 WALLS: EARTHEN PLASTERS MARKET SIZE BY REGION, 2019–2026 (TON)
9.3 ROOFS
9.3.1 ROOFS TO DOMINATE EARTHEN PLASTERS MARKET BY 2026
TABLE 22 ROOFS: EARTHEN PLASTERS MARKET SIZE BY REGION, 2019–2026 (USD MILLION)
TABLE 23 ROOFS: EARTHEN PLASTERS MARKET SIZE BY REGION, 2019–2026 (TON)
9.4 MASONRY
9.4.1 MECHANICAL COMPATIBILITY WITH ALL TYPES OF MASONRY
TABLE 24 MASONRY: EARTHEN PLASTERS MARKET SIZE BY REGION, 2019–2026 (USD MILLION)
TABLE 25 MASONRY: EARTHEN PLASTERS MARKET SIZE BY REGION, 2019–2026 (TON)
9.5 AGRICULTURE
9.5.1 VARIOUS ADVANTAGES AS AGRICULTURE PLASTER
TABLE 26 AGRICULTURE: EARTHEN PLASTERS MARKET SIZE BY REGION, 2019–2026 (USD MILLION)
TABLE 27 AGRICULTURE: EARTHEN PLASTERS MARKET SIZE BY REGION, 2019–2026 (TON)
9.6 OTHERS
TABLE 28 OTHERS: EARTHEN PLASTERS MARKET SIZE BY REGION, 2019–2026 (USD MILLION)
TABLE 29 OTHERS: EARTHEN PLASTERS MARKET SIZE BY REGION, 2019–2026 (TON)
10 EARTHEN PLASTERS MARKET, BY REGION (Page No. - 76)
10.1 INTRODUCTION
FIGURE 25 INDIA TO RECORD FASTEST GROWTH DURING FORECAST PERIOD
TABLE 30 EARTHEN PLASTERS MARKET SIZE, BY REGION, 2019–2026 (USD MILLION)
TABLE 31 EARTHEN PLASTERS MARKET SIZE, BY REGION, 2019–2026 (TON)
10.2 APAC
FIGURE 26 APAC: EARTHEN PLASTERS MARKET SNAPSHOT
TABLE 32 APAC: EARTHEN PLASTERS MARKET SIZE, BY COUNTRY, 2019–2026 (USD MILLION)
TABLE 33 APAC: EARTHEN PLASTERS MARKET SIZE, BY COUNTRY, 2019–2026 (TON)
TABLE 34 APAC: EARTHEN PLASTERS MARKET SIZE, BY TYPE, 2019–2026 (USD MILLION)
TABLE 35 APAC: EARTHEN PLASTERS MARKET SIZE, BY TYPE, 2019–2026 (TON)
TABLE 36 APAC: EARTHEN PLASTERS MARKET SIZE, BY APPLICATION, 2019–2026 (USD MILLION)
TABLE 37 APAC: EARTHEN PLASTERS MARKET SIZE, BY APPLICATION, 2019–2026 (TON)
10.2.1 CHINA
10.2.1.1 Availability of raw materials, skilled labor, and foreign investments is boosting the market
TABLE 38 CHINA: EARTHEN PLASTERS MARKET SIZE, BY TYPE, 2019–2026 (USD MILLION)
TABLE 39 CHINA: EARTHEN PLASTERS MARKET SIZE, BY TYPE, 2019–2026 (TON)
TABLE 40 CHINA: EARTHEN PLASTERS MARKET SIZE, BY APPLICATION, 2019–2026 (USD MILLION)
TABLE 41 CHINA: EARTHEN PLASTERS MARKET SIZE, BY APPLICATION, 2019–2026 (TON)
10.2.2 JAPAN
10.2.2.1 New housing projects to drive the market
TABLE 42 JAPAN: EARTHEN PLASTERS MARKET SIZE, BY TYPE, 2019–2026 (USD MILLION)
TABLE 43 JAPAN: EARTHEN PLASTERS MARKET SIZE, BY TYPE, 2019–2026 (TON)
TABLE 44 JAPAN: EARTHEN PLASTERS MARKET SIZE, BY APPLICATION, 2019–2026 (USD MILLION)
TABLE 45 JAPAN: EARTHEN PLASTERS MARKET SIZE, BY APPLICATION, 2019–2026 (TON)
10.2.3 INDIA
10.2.3.1 Growing construction industry and rapid industrialization
TABLE 46 INDIA: EARTHEN PLASTERS MARKET SIZE, BY TYPE, 2019–2026 (USD MILLION)
TABLE 47 INDIA: EARTHEN PLASTERS MARKET SIZE, BY TYPE, 2019–2026 (TON)
TABLE 48 INDIA: EARTHEN PLASTERS MARKET SIZE, BY APPLICATION, 2019–2026 (USD MILLION)
TABLE 49 INDIA: EARTHEN PLASTERS MARKET SIZE, BY APPLICATION, 2019–2026 (TON)
10.2.4 SOUTH KOREA
10.2.4.1 Growing residential and commercial construction projects to support market growth
TABLE 50 SOUTH KOREA: EARTHEN PLASTERS MARKET SIZE, BY TYPE, 2019–2026 (USD MILLION)
TABLE 51 SOUTH KOREA: EARTHEN PLASTERS MARKET SIZE, BY TYPE, 2019–2026 (TON)
TABLE 52 SOUTH KOREA: EARTHEN PLASTERS MARKET SIZE, BY APPLICATION, 2019–2026 (USD MILLION)
TABLE 53 SOUTH KOREA: EARTHEN PLASTERS MARKET SIZE, APPLICATION, 2019–2026 (TON)
10.2.5 AUSTRALIA
10.2.5.1 Strong spending in building & construction activities
TABLE 54 AUSTRALIA: EARTHEN PLASTERS MARKET SIZE, BY TYPE, 2019–2026 (USD MILLION)
TABLE 55 AUSTRALIA: EARTHEN PLASTERS MARKET SIZE, BY TYPE, 2019–2026 (TON)
TABLE 56 AUSTRALIA: EARTHEN PLASTERS MARKET SIZE, BY APPLICATION, 2019–2026 (USD MILLION)
TABLE 57 AUSTRALIA: EARTHEN PLASTERS MARKET SIZE, BY APPLICATION, 2019–2026 (TON)
10.2.6 REST OF APAC
TABLE 58 REST OF APAC: EARTHEN PLASTERS MARKET SIZE, BY TYPE, 2019–2026 (USD MILLION)
TABLE 59 REST OF APAC: EARTHEN PLASTERS MARKET SIZE, BY TYPE, 2019–2026 (TON)
TABLE 60 REST OF APAC: EARTHEN PLASTERS MARKET SIZE, BY APPLICATION, 2019–2026 (USD MILLION)
TABLE 61 REST OF APAC: EARTHEN PLASTERS MARKET SIZE, BY APPLICATION, 2019–2026 (TON)
10.3 NORTH AMERICA
FIGURE 27 NORTH AMERICA: EARTHEN PLASTERS MARKET SNAPSHOT
TABLE 62 NORTH AMERICA: EARTHEN PLASTERS MARKET SIZE, BY COUNTRY, 2019–2026 (USD MILLION)
TABLE 63 NORTH AMERICA: EARTHEN PLASTERS MARKET SIZE, BY COUNTRY, 2019–2026 (TON)
TABLE 64 NORTH AMERICA: EARTHEN PLASTERS MARKET SIZE, BY TYPE, 2019–2026 (USD MILLION)
TABLE 65 NORTH AMERICA: EARTHEN PLASTERS MARKET SIZE, BY TYPE, 2019–2026 (TON)
TABLE 66 NORTH AMERICA: EARTHEN PLASTERS MARKET SIZE, BY APPLICATION, 2019–2026 (USD MILLION)
TABLE 67 NORTH AMERICA: EARTHEN PLASTERS MARKET SIZE, BY APPLICATION, 2019–2026 (TON)
10.3.1 US
10.3.1.1 LEED rating system to boost market in the country
TABLE 68 US: EARTHEN PLASTERS MARKET SIZE, BY TYPE, 2019–2026 (USD MILLION)
TABLE 69 US: EARTHEN PLASTERS MARKET SIZE, BY TYPE, 2019–2026 (TON)
TABLE 70 US: EARTHEN PLASTERS MARKET SIZE, BY APPLICATION, 2019–2026 (USD MILLION)
TABLE 71 US: EARTHEN PLASTERS MARKET SIZE, BY APPLICATION, 2019–2026 (TON)
10.3.2 CANADA
10.3.2.1 Significant growth of green construction industry in the country to drive the market
TABLE 72 CANADA: EARTHEN PLASTERS MARKET SIZE, BY TYPE, 2019–2026 (USD MILLION)
TABLE 73 CANADA: EARTHEN PLASTERS MARKET SIZE, BY TYPE, 2019–2026 (TON)
TABLE 74 CANADA: EARTHEN PLASTERS MARKET SIZE, BY APPLICATION, 2019–2026 (USD MILLION)
TABLE 75 CANADA: EARTHEN PLASTERS MARKET SIZE, BY APPLICATION, 2019–2026 (TON)
10.3.3 MEXICO
10.3.3.1 Private investments in infrastructure development to drive the market
TABLE 76 MEXICO: EARTHEN PLASTERS MARKET SIZE, BY TYPE, 2019–2026 (USD MILLION)
TABLE 77 MEXICO: EARTHEN PLASTERS MARKET SIZE, BY TYPE, 2019–2026 (TON)
TABLE 78 MEXICO: EARTHEN PLASTERS MARKET SIZE, BY APPLICATION, 2019–2026 (USD MILLION)
TABLE 79 MEXICO: EARTHEN PLASTERS MARKET SIZE, BY APPLICATION, 2019–2026 (TON)
10.4 EUROPE
FIGURE 28 EUROPE: EARTHEN PLASTERS MARKET SNAPSHOT
TABLE 80 EUROPE: EARTHEN PLASTERS MARKET SIZE, BY COUNTRY, 2019–2026 (USD MILLION)
TABLE 81 EUROPE: EARTHEN PLASTERS MARKET SIZE, BY COUNTRY, 2019–2026 (TON)
TABLE 82 EUROPE: EARTHEN PLASTERS MARKET SIZE, BY TYPE, 2019–2026 (USD MILLION)
TABLE 83 EUROPE: EARTHEN PLASTERS MARKET SIZE, BY TYPE, 2019–2026 (TON)
TABLE 84 EUROPE: EARTHEN PLASTERS MARKET SIZE, BY APPLICATION, 2019–2026 (USD MILLION)
TABLE 85 EUROPE: EARTHEN PLASTERS MARKET SIZE, BY APPLICATION, 2019–2026 (TON)
10.4.1 GERMANY
10.4.1.1 Established players to drive the market
TABLE 86 GERMANY: EARTHEN PLASTERS MARKET SIZE, BY TYPE, 2019–2026 (USD MILLION)
TABLE 87 GERMANY: EARTHEN PLASTERS MARKET SIZE, BY TYPE, 2019–2026 (TON)
TABLE 88 GERMANY: EARTHEN PLASTERS MARKET SIZE, BY APPLICATION, 2019–2026 (USD MILLION)
TABLE 89 GERMANY: EARTHEN PLASTERS MARKET SIZE, BY APPLICATION, 2019–2026 (TON)
10.4.2 FRANCE
10.4.2.1 Recovery of the construction industry to increase demand for earthen plasters
TABLE 90 FRANCE: EARTHEN PLASTERS MARKET SIZE, BY TYPE, 2019–2026 (USD MILLION)
TABLE 91 FRANCE: EARTHEN PLASTERS MARKET SIZE, BY TYPE, 2019–2026 (TON)
TABLE 92 FRANCE: EARTHEN PLASTERS MARKET SIZE, BY APPLICATION, 2019–2026 (USD MILLION)
TABLE 93 FRANCE: EARTHEN PLASTERS MARKET SIZE, BY APPLICATION, 2019–2026 (TON)
10.4.3 UK
10.4.3.1 Increasing demand for earthen plasters in residential & commercial construction industry
TABLE 94 UK: EARTHEN PLASTERS MARKET SIZE, BY TYPE, 2019–2026 (USD MILLION)
TABLE 95 UK: EARTHEN PLASTERS MARKET SIZE, BY TYPE, 2019–2026 (TON)
TABLE 96 UK EARTHEN PLASTERS MARKET SIZE, BY APPLICATION, 2019–2026 (USD MILLION)
TABLE 97 UK: EARTHEN PLASTERS MARKET SIZE, BY APPLICATION, 2019–2026 (TON)
10.4.4 ITALY
10.4.4.1 Rapid urbanization & infrastructural development to propel demand growth
TABLE 98 ITALY: EARTHEN PLASTERS MARKET SIZE, BY TYPE, 2019–2026 (USD MILLION)
TABLE 99 ITALY: EARTHEN PLASTERS MARKET SIZE, BY TYPE, 2019–2026 (TON)
TABLE 100 ITALY: EARTHEN PLASTERS MARKET SIZE, BY APPLICATION, 2019–2026 (USD MILLION)
TABLE 101 ITALY: EARTHEN PLASTERS MARKET SIZE, BY APPLICATION, 2019–2026 (TON)
10.4.5 RUSSIA
10.4.5.1 Upcoming infrastructure projects to drive demand
TABLE 102 RUSSIA: EARTHEN PLASTERS MARKET SIZE, BY TYPE, 2019–2026 (USD MILLION)
TABLE 103 RUSSIA: EARTHEN PLASTERS MARKET SIZE, BY TYPE, 2019–2026 (TON)
TABLE 104 RUSSIA: EARTHEN PLASTERS MARKET SIZE, BY APPLICATION, 2019–2026 (USD MILLION)
TABLE 105 RUSSIA: EARTHEN PLASTERS MARKET SIZE, BY APPLICATION, 2019–2026 (TON)
10.4.6 REST OF EUROPE
TABLE 106 REST OF EUROPE: EARTHEN PLASTERS MARKET SIZE, BY TYPE, 2019–2026 (USD MILLION)
TABLE 107 REST OF EUROPE: EARTHEN PLASTERS MARKET SIZE, BY TYPE, 2019–2026 (TON)
TABLE 108 REST OF EUROPE: EARTHEN PLASTERS MARKET SIZE, BY APPLICATION, 2019–2026 (USD MILLION)
TABLE 109 REST OF EUROPE: EARTHEN PLASTERS MARKET SIZE, BY APPLICATION, 2019–2026 (TON)
10.5 MIDDLE EAST & AFRICA
TABLE 110 MIDDLE EAST & AFRICA: EARTHEN PLASTERS MARKET SIZE, BY COUNTRY, 2019–2026 (USD MILLION)
TABLE 111 MIDDLE EAST & AFRICA: EARTHEN PLASTERS MARKET SIZE, BY COUNTRY, 2019–2026 (TON)
TABLE 112 MIDDLE EAST & AFRICA: EARTHEN PLASTERS MARKET SIZE, BY TYPE, 2019–2026 (USD MILLION)
TABLE 113 MIDDLE EAST & AFRICA: EARTHEN PLASTERS MARKET SIZE, BY TYPE, 2019–2026 (TON)
TABLE 114 MIDDLE EAST & AFRICA: EARTHEN PLASTERS MARKET SIZE, BY APPLICATION, 2019–2026 (USD MILLION)
TABLE 115 MIDDLE EAST & AFRICA: EARTHEN PLASTERS MARKET SIZE, APPLICATION, 2019–2026 (TON)
10.5.1 UAE
10.5.1.1 Huge government spending in infrastructure to drive the demand for earthen plasters
TABLE 116 UAE: EARTHEN PLASTERS MARKET SIZE, BY TYPE, 2019–2026 (USD MILLION)
TABLE 117 UAE: EARTHEN PLASTERS MARKET SIZE, BY TYPE, 2019–2026 (TON)
TABLE 118 UAE: EARTHEN PLASTERS MARKET SIZE, BY APPLICATION, 2019–2026 (USD MILLION)
TABLE 119 UAE: EARTHEN PLASTERS MARKET SIZE, APPLICATION, 2019–2026 (TON)
10.5.2 SAUDI ARABIA
10.5.2.1 Large construction projects to boost the market for earthen plasters
TABLE 120 SAUDI ARABIA: EARTHEN PLASTERS MARKET SIZE, BY TYPE, 2019–2026 (USD MILLION)
TABLE 121 SAUDI ARABIA: EARTHEN PLASTERS MARKET SIZE, BY TYPE, 2019–2026 (TON)
TABLE 122 SAUDI ARABIA: EARTHEN PLASTERS MARKET SIZE, BY APPLICATION, 2019–2026 (USD MILLION)
TABLE 123 SAUDI ARABIA: EARTHEN PLASTERS MARKET SIZE, APPLICATION, 2019–2026 (TON)
10.5.3 SOUTH AFRICA
10.5.3.1 Ongoing mega projects to drive the earthen plasters market
TABLE 124 SOUTH AFRICA: EARTHEN PLASTERS MARKET SIZE, BY TYPE, 2019–2026 (USD MILLION)
TABLE 125 SOUTH AFRICA: EARTHEN PLASTERS MARKET SIZE, BY TYPE, 2019–2026 (TON)
TABLE 126 SOUTH AFRICA: EARTHEN PLASTERS MARKET SIZE, BY APPLICATION, 2019–2026 (USD MILLION)
TABLE 127 SOUTH AFRICA: EARTHEN PLASTERS MARKET SIZE, APPLICATION, 2019–2026 (TON)
10.5.4 REST OF MIDDLE EAST & AFRICA
TABLE 128 REST OF MIDDLE EAST & AFRICA: EARTHEN PLASTERS MARKET SIZE, BY TYPE, 2019–2026 (USD MILLION)
TABLE 129 REST OF MIDDLE EAST & AFRICA: EARTHEN PLASTERS MARKET SIZE, BY TYPE, 2019–2026 (TON)
TABLE 130 REST OF MIDDLE EAST & AFRICA: EARTHEN PLASTERS MARKET SIZE, BY APPLICATION, 2019–2026 (USD MILLION)
TABLE 131 REST OF MIDDLE EAST & AFRICA: EARTHEN PLASTERS MARKET SIZE, APPLICATION, 2019–2026 (TON)
10.6 SOUTH AMERICA
TABLE 132 SOUTH AMERICA: EARTHEN PLASTERS MARKET SIZE, BY COUNTRY, 2019–2026 (USD MILLION)
TABLE 133 SOUTH AMERICA: EARTHEN PLASTERS MARKET SIZE, BY COUNTRY, 2019–2026 (TON)
TABLE 134 SOUTH AMERICA: EARTHEN PLASTERS MARKET SIZE, BY TYPE, 2019–2026 (USD MILLION)
TABLE 135 SOUTH AMERICA: EARTHEN PLASTERS MARKET SIZE, BY TYPE, 2019–2026 (TON)
TABLE 136 SOUTH AMERICA: EARTHEN PLASTERS MARKET SIZE, BY APPLICATION, 2019–2026 (USD MILLION)
TABLE 137 SOUTH AMERICA: EARTHEN PLASTERS MARKET SIZE, APPLICATION, 2019–2026 (TON)
10.6.1 BRAZIL
10.6.1.1 Brazil to dominate the market for earthen plasters in South America
TABLE 138 BRAZIL: EARTHEN PLASTERS MARKET SIZE, BY TYPE, 2019–2026 (USD MILLION)
TABLE 139 BRAZIL: EARTHEN PLASTERS MARKET SIZE, BY TYPE, 2019–2026 (TON)
TABLE 140 BRAZIL: EARTHEN PLASTERS MARKET SIZE, BY APPLICATION, 2019–2026 (USD MILLION)
TABLE 141 BRAZIL: EARTHEN PLASTERS MARKET SIZE, APPLICATION, 2019–2026 (TON)
10.6.2 ARGENTINA
10.6.2.1 Increasing demand for earthen plasters for industrial applications
TABLE 142 ARGENTINA: EARTHEN PLASTERS MARKET SIZE, BY TYPE, 2019–2026 (USD MILLION)
TABLE 143 ARGENTINA: EARTHEN PLASTERS MARKET SIZE, BY TYPE, 2019–2026 (TON)
TABLE 144 ARGENTINA: EARTHEN PLASTERS MARKET SIZE, BY APPLICATION, 2019–2026 (USD MILLION)
TABLE 145 ARGENTINA: EARTHEN PLASTERS MARKET SIZE, APPLICATION, 2019–2026 (TON)
10.6.3 REST OF SOUTH AMERICA
TABLE 146 REST OF SOUTH AMERICA: EARTHEN PLASTERS MARKET SIZE, BY TYPE, 2019–2026 (USD MILLION)
TABLE 147 REST OF SOUTH AMERICA: EARTHEN PLASTERS MARKET SIZE, BY TYPE, 2019–2026 (TON)
TABLE 148 REST OF SOUTH AMERICA: EARTHEN PLASTERS MARKET SIZE, BY APPLICATION, 2019–2026 (USD MILLION)
TABLE 149 REST OF SOUTH AMERICA: EARTHEN PLASTERS MARKET SIZE, APPLICATION, 2019–2026 (TON)
11 COMPETITIVE LANDSCAPE (Page No. - 129)
11.1 OVERVIEW
11.2 MARKET RANKING
FIGURE 29 MARKET RANKING OF KEY PLAYERS, 2020
11.2.1 AMERICAN CLAY ENTERPRISES, LLC
11.2.2 CLAYWORKS
11.2.3 CLAYTECH BAUSTOFFE AUS LEHM
11.2.4 CONLUTO
11.2.5 CLAY.IT
11.3 MARKET SHARE ANALYSIS
TABLE 150 EARTHEN PLASTERS MARKET: MARKET SHARES OF KEY PLAYERS
FIGURE 30 SHARE OF LEADING COMPANIES IN EARTHEN PLASTERS MARKET
11.3.1 COMPETITIVE BENCHMARKING
FIGURE 31 PRODUCT FOOTPRINT
FIGURE 32 BUSINESS STRATEGY EXCELLENCE
TABLE 151 COMPANY APPLICATION FOOTPRINT
TABLE 152 COMPANY REGIONAL FOOTPRINT
12 COMPANY PROFILES (Page No. - 134)
12.1 KEY COMPANIES
(Business Overview, Products and services offered, Recent Developments, right to win)*
12.1.1 AMERICAN CLAY ENTERPRISES, LLC
TABLE 153 AMERICAN CLAY ENTERPRISES, LLC: BUSINESS OVERVIEW
TABLE 154 AMERICAN CLAY ENTERPRISES, LLC: PRODUCT OFFERINGS
12.1.2 CLAYWORKS
TABLE 155 CLAYWORKS: BUSINESS OVERVIEW
TABLE 156 CLAYWORKS: PRODUCT AND SERVICES OFFERINGS
TABLE 157 CLAYWORKS: PROJECTS
12.1.3 CLAYTECH BAUSTOFFE AUS LEHM
TABLE 158 CLAYTECH BAUSTOFFE AUS LEHM: BUSINESS OVERVIEW
TABLE 159 CLAYTECH BAUSTOFFE AUS LEHM: PRODUCT OFFERINGS
TABLE 160 CLAYTECH BAUSTOFFE AUS LEHM: PROJECTS
12.1.4 CONLUTO
TABLE 161 CONLUTO: BUSINESS OVERVIEW
TABLE 162 CONLUTO: PRODUCT OFFERINGS
TABLE 163 CONLUTO: PROJECTS
12.1.5 CLAY.IT
TABLE 164 CLAY.IT: BUSINESS OVERVIEW
TABLE 165 CLAY.IT: PRODUCT OFFERINGS
12.1.6 ARMOURCOAT LIMITED
TABLE 166 ARMOURCOAT LIMITED: BUSINESS OVERVIEW
TABLE 167 ARMOURCOAT LIMITED: PRODUCT OFFERINGS
12.1.7 TIERRAFINO B.V.
TABLE 168 TIERRAFINO B.V.: BUSINESS OVERVIEW
TABLE 169 TIERRAFINO B.V.: PRODUCT OFFERINGS
12.1.8 UKU PURE EARTH
TABLE 170 UKU PURE EARTH: BUSINESS OVERVIEW
TABLE 171 UKU PURE EARTH: PRODUCT OFFERINGS
12.1.9 STUDIO MOMO
TABLE 172 STUDIO MOMO: BUSINESS OVERVIEW
TABLE 173 STUDIO MOMO: PRODUCT OFFERINGS
TABLE 174 STUDIO MOMO: PROJECTS
*Details on Business Overview, Products and services offered, Recent Developments, right to win might not be captured in case of unlisted companies.
13 APPENDIX (Page No. - 148)
13.1 DISCUSSION GUIDE
13.2 KNOWLEDGE STORE: MARKETSANDMARKETS’ SUBSCRIPTION PORTAL
13.3 AVAILABLE CUSTOMIZATIONS
13.4 RELATED REPORTS
13.5 AUTHOR DETAILS
The study involved four major activities in estimating the size of the earthen plasters market. Exhaustive secondary research has been carried out to collect information on the market, the peer markets, and the parent market. Both top-down and bottom-up approaches have been employed to estimate the total market size. Market breakdown and data triangulation methods have also been used to estimate the market for segments and sub segments.
Secondary Research
In the secondary research process, various sources such as Hoovers, Bloomberg Businessweek, Factiva, World Bank, and Industry Journals were used. These secondary sources included annual reports, press releases & investor presentations of companies; white papers; certified publications; articles by recognized authors; and databases.
Primary Research
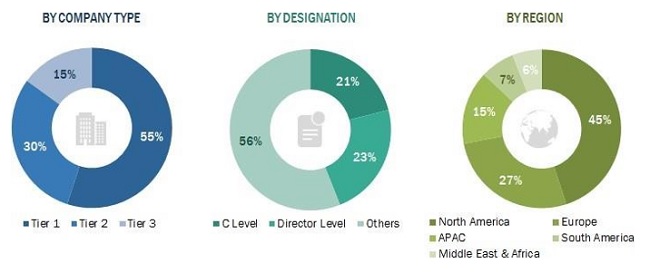
The earthen plasters market comprises several stakeholders, such as raw material suppliers, end-product manufacturers, and regulatory organizations in the supply chain. Developments in the earthen plasters market characterize the demand side. Market consolidation activities undertaken by manufacturers characterize the supply side. Various primary sources from both the supply and demand sides of the market were interviewed to obtain qualitative and quantitative information. Following is the breakdown of primary respondents:
To know about the assumptions considered for the study, download the pdf brochure
Market Size Estimation
Both top-down and bottom-up approaches were used to estimate and validate the total size of the earthen plasters market. These methods were also used extensively to determine the size of various sub segments in the market. The research methodology used to estimate the market sizeincludes the following:
The key players in the industry and markets were identified through extensive secondary research.
The industry’s supply chain and market size, in terms of value, were determined through primary and secondary research processes.
All percentage shares, splits, and breakdowns were determined using secondary sources and verified through primary sources.
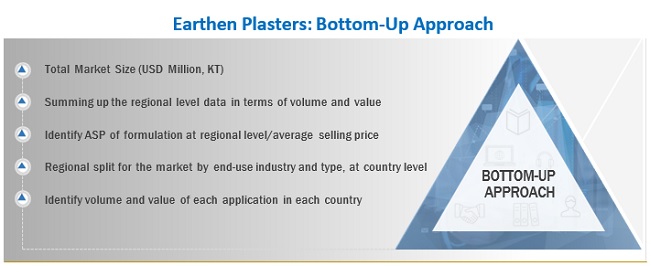
To know about the assumptions considered for the study, Request for Free Sample Report
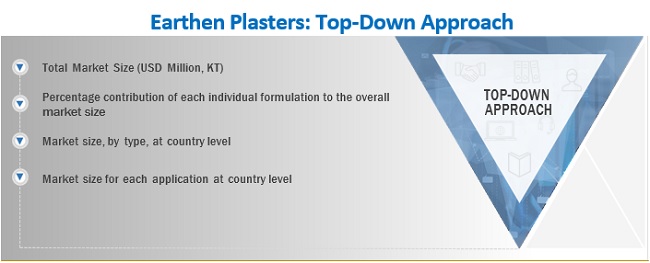
Data Triangulation
After arriving at the overall market size—using the market size estimation processes as explained above— the market was split into several segments and subsegments. To complete the overall market engineering process and arrive at the exact statistics of each market segment and sub segment, the data triangulation, and market breakdown procedures were employed, wherever applicable. The data was triangulated by studying various factors and trends from both thedemand and supply sides in the earthen plasters market.
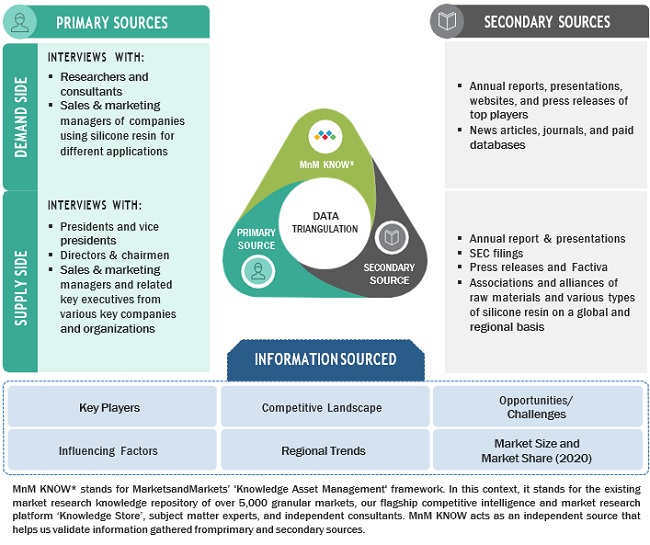
*MnM KNOW stands for MarketsandMarkets’ 'Knowledge Asset Management' framework. In this context, it stands for the existing market research knowledge repository of over 5,000 granular markets, our flagship competitive intelligence and market research platform “Knowledge Store", subject matter experts, and independent consultants. MnM KNOW acts as an independent source that helps us validate information gathered from primary and secondary sources.
Report Objectives
- To define, describe, and forecast the earthen plasters market in terms of value and volume
- To provide detailed information about the key factors influencing the market growth, such as drivers, restraints, opportunities, and challenges
- To analyze and forecast the market size based on type, applications, and region.
- To forecast the market size of five main regions, namely, North America, Europe, Asia Pacific (APAC), South America and Middle East and Africa (MEA) (along with the key countries in eachregion)
- To strategically analyze the micromarkets1 with respect to individual growth trends, growth prospects, and contribution to the overall market
- To analyze the opportunities in the market for stakeholders and draw a competitive landscape for market leaders
- To analyze the competitive developments, such as new product launch, expansion, mergers acquisitions, expansion, and agreement & contracts in the earthen plasters market.
- To strategically profile the key players and comprehensively analyze their core competencies.
Available Customizations:
With the given market data, MarketsandMarkets offers customizations according to the specific needs of the companies.
The following customization options are available for the report:
Product Analysis
- Product matrix, which gives a detailed comparison of the product portfolio of each company
Regional Analysis
- Further breakdown of a region with respect to a particular country
Company Information
- Detailed analysis and profiling of additional market players (up to five)


 Generating Response ...


Growth opportunities and latent adjacency in Earthen Plasters Market