Drill Pipe Market by Application (Onshore and Offshore), by Grade (American Petroleum Institute (API) Grade and Premium Grade), and by Region (North America, Latin America, Europe, Asia-Pacific, Middle East, and Africa) - Global Trends & Forecast to 2020


Global oil and gas production has increased over the last five years, from 81.15 Million barrels per day in 2009, to 88.67 Million barrels per day b 2014. This has led to the supply for oil & gas exceeding its demand which has ultimately caused a decline in the prices of crude oil during the last six months of 2014. Consequently, the oil and gas operators have reduced their capital expenditure outlook for 2015 citing concerns over low profit margins. This reduction has mainly impacted the upstream exploration and production (E&P) activities. However, the declining production from onshore oilfields in countries such as Russia, the U.K. and India among others has resulted in higher demand for exploring new offshore reserves. Drill pipe which are used to support drilling and exploration activities are expected to grow at a CAGR of 3.8% to reach USD 1,133.8 Million by 2020 from USD 940.62 Million in 2015. In this report, 2014 is considered as the base year and 2020 is considered as the forecast year. The report covers the grade of drill pipe as well as the application segments.
Research Methodology
The market for the drill pipe report was arrived by using regional data for the well costs and the relative costs incurred for the drill pipe per well. Finally, the global values were arrived by consolidation of drill pipe markets for individual regions.
The size of the overall market has been determined by forecast techniques based on region-wise E&P capital expenditure along with the well count, rig count, and oil & gas E&P activities in different regions, which have been validated through primary sources. The primary sources considered for the report include market players from both the supply side as well as from the demand side. The primary respondents targeted were from all over the world including the drilling and exploration hotspots such as North America, the Middle East, and Africa among others. The respondents were also working at different designation levels ranging from top level management to technical supervisors.
Market for drill pipe is projected to grow with a CAGR of 3.8% from 2015 to 2020. The crude oil prices are expected to increase gradually in the short term and are expected to reach USD 80/ barrel by 2018. This rebound in oil prices will be spurred by the delay in capacity addition as the oil & gas companies are currently shelving new projects to reduce their capital expenditure. With the increase in the price of crude oil, the investments for E&P activities will also increase which will lead to new projects in regions such as Europe and Asia-Pacific that are looking to overturn their production decline. This will in turn create further demand for the drill pipe in these regions.
This report caters to the requirements of certain stakeholders in the drill pipe market which includes the drill pipe manufacturing companies, oilfield rental companies, drilling contractors, oilfield service companies, industrial associations, and private equity investors among others.
The drill pipe market report covers the following segments:
On the basis of Grade
- API grade
- Premium grade
On the basis of Application
- Onshore
- Offshore
On the basis of Region
- North America
- Latin America
- Asia-Pacific
- Middle East
- Europe
- Africa
The available customization for the drill pipe market report includes the following:
- Detailed analysis and profiling of additional market players (Up to 5)
- Country-wise analysis can be extended by one country for every region
The drill pipe market is forecasted to grow from an estimated value of USD 940.62 Million in 2015 to reach USD 1,133.80 Million by 2020 at a CAGR of 3.8%. The recent downturn in the crude oil prices has resulted in the decline of the exploration & production (E&P) activities all over the world. The spot price of the Brent crude plunged from USD 111.8/barrel in June 2014 to USD 62.3/barrel in December 2014. This dramatic decline is being largely attributed to the over production of petroleum which has increased the oil & gas supply as compared to its demand. The largest oil and gas producing countries included Saudi Arabia, Russia, and the U.S. The low price environment has reduced the operating profits of almost all the oil & gas companies which resulted in reduced capital expenditures in 2015. This budget cut has largely affected the exploratory drilling activities mainly the offshore activities. The oil & gas industry is cyclical in nature and is currently experiencing a downturn. The low crude oil prices have created a demand for optimizing production from existing oilfields and to operate at an economical rate. Apart from this, the low levels of E&P activity are likely to reduce the oil & gas supply in comparison to the demand in next two years which is expected to cause rise in the oil prices again. Also, new oil & gas activities are being undertaken in few regions of the world such as Africa and Latin America which are expected to be developed once the oil prices bounce back above USD 75 per barrel.
Largest application for the drill pipe market is onshore primarily due to the large number of E&P activities being carried onshore as compared to offshore. Moreover, the presence of large unconventional resources onshore in countries such as China, Argentina, Venezuela, Canada, and the U.S. has also boosted the demand for drill pipe market. On the other hand, growing E&P activities in offshore regions within countries such as Angola, Norway, and the U.S. is also one of the reasons behind the growth of the drill pipe market for offshore applications.
The drill pipe market for the API grade is projected to hold the larger market size as compared to the premium grade drill pipes. This is due to the fact that the API grade drill pipes are less expensive as compared to the premium grade drill pipes. Also, these drill pipes can easily cater to the normal drilling environment thus reducing the overall exploration and drilling costs. On the other hand, premium grade drill pipes are generally suitable for abnormal drilling conditions such as high temperature, high pressure, corrosive environments, and Arctic drilling among others. With the increase in the deepwater drilling activities, the market for premium grade drill pipe is expected to grow at a higher CAGR in comparison to that of API grade drill pipe.
North America is expected to continue to be the largest market by 2020. Asia-Pacific is the second largest market owing partly due to the shale related exploration activity in China and the offshore developments in the South China Sea region. The fastest growing market for the drill pipes is Africa which is experiencing some of the largest offshore discoveries in Angola and Tanzania. Many international oil companies (IOCs) such as Statoil ASA (Norway), ENI SPA (Italy), and BG group (U.K.) among others have provided technical expertise in the region to explore offshore reserves more efficiently at optimum costs. Thus, the African drill pipe is forecasted to grow at a CAGR of 5.9% between 2015 and 2020.
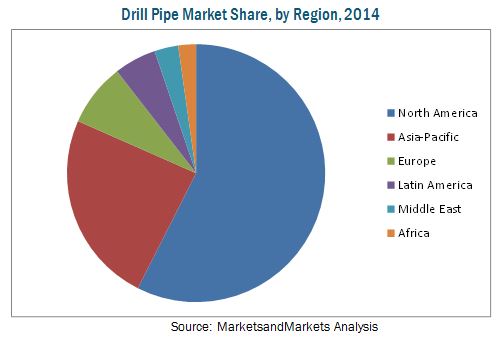
In 2014, European drill pipe market was initially spurred by the exploratory drilling in Russia, the U.K. and Norway. Offshore development in the Kara sea region by Rosneft (Russia) and ExxonMobil (U.S.) was critical for the drill pipe market. However, ExxonMobil pulled out following the economic sanctions on Russia by European Union and the U.S. which slowed down the Arctic exploration project. Moreover, the plunge in the oil prices has also suspended most of the drilling activities in the Europe largely due to the expensive nature of offshore oilfield development.
Shale gas drilling which was one of the major growth contributors to the drilling activities in North America has faced major cutbacks since the oil price collapsed beginning in mid-2014. This is because of the fact that the cost of exploration for unconventional resources is high as compared to that of conventional oil & gas resource. This has led to a decline in exploratory drilling in North America. The U.S. market which accounted for the largest share in the North American drill pipe market also faces the problem of low natural gas prices which reduces the profit margins for the shale gas operating companies.
Drill pipe market is largely controlled by 4 major market players including National Oilwell Varco (U.S.), Hilong Group (China), Vallourec S.A. (France), and Tenaris S.A. (Luxembourg) which control nearly three fourths of the overall market. These companies have the advantage of having large scale manufacturing operations which cater to major oil & gas exploration hotspots such as Africa and Asia-Pacific among others.
 Exclusive indicates content/data unique to MarketsandMarkets and not available with any competitors.
Table of Contents
1 Introduction (Page No. - 15)
1.1 Objectives of the Study
1.2 Market Definition
1.3 Study Scope
1.3.1 Markets Covered
1.3.2 Years Considered for the Study
1.4 Currency
1.5 Limitations
1.6 Stakeholders
2 Research Methodology (Page No. - 18)
2.1 Research Data
2.1.1 Secondary Data
2.1.1.1 Key Data Collected From Secondary Sources
2.1.2 Primary Data
2.1.2.1 Key Data From Primary Sources
2.1.2.2 Key Industry Insights
2.1.2.3 Breakdown of Primaries
2.2 Market Size Estimation
2.2.1 Bottom-Up Approach
2.2.2 Top-Down Approach
2.3 Market Breakdown and Data Triangulation
2.4 Research Assumptions and Limitations
2.4.1 Assumptions
2.4.2 Limitations
3 Executive Summary (Page No. - 27)
4 Premium Insights (Page No. - 31)
4.1 Attractive Market Opportunities for Drill Pipes
4.2 Onshore Applications are Expected to Dominate the Market During the Forecast Period
4.3 Onshore Application Segment to Hold the Largest Share in the Drill Pipe Market in 2015
4.4 North America Accounted for the Largest Share of the Drill Pipe Market in 2014
4.5 Top Countries in the Drill Pipe Market
4.6 Demand for Onshore Applications is Projected to Increase From 2015 to 2020
5 Market Overview (Page No. - 35)
5.1 Introduction
5.2 Market Segmentation
5.2.1 By Application
5.2.1.1 Onshore
5.2.1.2 Offshore
5.2.2 By Grade
5.2.2.1 Api Grade
5.2.2.2 Premium Grade
5.3 Market Dynamics
5.3.1 Drivers
5.3.1.1 Deepwater Exploration in Africa and South America
5.3.1.2 Unconventional Resources
5.3.1.3 Advancements in Drilling Technology
5.3.1.4 Natural Gas as A Bridge Fuel in Developing Countries
5.3.2 Restraints
5.3.2.1 Low Oil Prices
5.3.2.2 Low Natural Gas Prices in the U.S.
5.3.3 Opportunities
5.3.3.1 New Reserve Discoveries
5.3.3.2 Nascent Renewable Energy Sources
5.3.3.3 Optimized Drilling
5.3.4 Challenges
5.3.4.1 Stringent Regulatory Legislations and Environmental Disasters
5.3.4.2 Low-Cost South Korean Steel Imports
5.4 Impact of Market Dynamics
5.5 Supply Chain Analysis
5.6 Porter�s Five Forces Analysis
5.6.1 Threat of New Entrants
5.6.2 Threat of Substitutes
5.6.3 Bargaining Power of Buyers
5.6.4 Bargaining Power of Suppliers
5.6.5 Intensity of Competitive Rivalry
6 Drill Pipe Market, By Application (Page No. - 47)
6.1 Introduction
6.1.1 Onshore Drill Pipe Market, By Value
6.1.2 Offshore Drill Pipe Market, By Value
6.2 North America Market, By Application
6.3 Asia-Pacific Market, By Application
6.4 Europe Market, By Application
6.5 Latin America Market, By Application
6.6 Middle East Market, By Application
6.7 Africa Market, By Application
7 Drill Pipe Market, By Grade (Page No. - 54)
7.1 Introduction
7.2 North America Drill Pipe Market Size, By Grade
7.2.1 North American Market Size (Value), By Grade
7.2.2 North American Market Size (Volume), By Grade
7.3 Asia-Pacific Drill Pipe Market Size, By Grade
7.3.1 Asia-Pacific Market Size (Value), By Grade
7.3.2 Asia-Pacific Market Size (Volume), By Grade
7.4 Europe Drill Pipe Market Size, By Grade
7.4.1 European Market Size (Value), By Grade
7.4.2 European Market Size (Volume), By Grade
7.5 Latin America Drill Pipe Market Size, By Grade
7.5.1 Latin American Market Size (Value), By Grade
7.5.2 Latin American Market Size (Volume), By Grade
7.6 Middle East Drill Pipe Market Size, By Grade
7.6.1 Middle East Market Size (Value), By Grade
7.6.2 Middle East Market Size (Volume), By Grade
7.7 Africa Drill Pipe Market Size, By Grade
7.7.1 African Market Size (Value), By Grade
7.7.2 African Market Size (Volume), By Grade
8 Drill Pipe Market, By Region (Page No. - 64)
8.1 Introduction
8.2 North America Drill Pipe Market
8.2.1 U.S. Market, By Value
8.2.2 Canada Market, By Value
8.3 Asia-Pacific Drill Pipe Market
8.3.1 China Market, By Value
8.3.2 Thailand Market, By Value
8.3.3 India Market, By Value
8.3.4 Indonesia Market, By Value
8.3.5 Australia Market, By Value
8.3.6 Rest of Asia-Pacific Market, By Value
8.4 Europe Drill Pipe Market
8.4.1 Russia Market, By Value
8.4.2 Norway Market, By Value
8.4.3 U.K. Market, By Value
8.4.4 Rest of Europe Market, By Value
8.5 Latin America Drill Pipe Market
8.5.1 Mexico Market, By Value
8.5.2 Argentina Market, By Value
8.5.3 Brazil Market, By Value
8.5.4 Venezuela Market, By Value
8.5.5 Rest of Latin America Market, By Value
8.6 Middle East Drill Pipe Market
8.6.1 Oman Market, By Value
8.6.2 Saudi Arabia Market, By Value
8.6.3 Uae Market, By Value
8.6.4 Qatar Market, By Value
8.6.5 Rest of Middle East Market, By Value
8.7 Africa Drill Pipe Market
8.7.1 Egypt Market, By Value
8.7.2 Algeria Market, By Value
8.7.3 Nigeria Market, By Value
8.7.4 Angola Market, By Value
8.7.5 Rest of Africa Market, By Value
9 Competitive Landscape (Page No. - 93)
9.1 Overview
9.2 Market Share Analysis, By Key Players
9.3 Competitive Situation & Trends
9.3.1 Contracts & Agreements
9.3.2 Expansion
9.3.3 New Product Launch
9.3.4 Mergers & Acquisitions
9.3.5 Others
10 Company Profiles (Page No. - 102)
(Company at A Glance, Recent Financials, Products & Services, Strategies & Insights, & Recent Developments)*
10.1 Introduction
10.2 Hilong Group
10.3 National Oilwell Varco
10.4 Tenaris S.A.
10.5 Vallourec S.A.
10.6 TMK Group
10.7 Oil Country Tubular Limited
10.8 Tejas Tubular Products Inc.
10.9 Texas Steel Conversion Inc.
10.10 DP Master
10.11 Jiangyin Long Bright Drill Pipe Manufacture Co. Ltd.
10.12 Drill Pipe International Llc
10.13 Superior Drill Pipe Manufacturing, Inc.
*Details on Company at A Glance, Recent Financials, Products & Services, Strategies & Insights, & Recent Developments Might Not Be Captured in Case of Unlisted Companies.
11 Appendix (Page No. - 134)
11.1 Insights of Industry Experts
11.2 Company Developments
11.3 Discussion Guide
11.4 Introducing RT: Real Time Market Intelligence
11.5 Available Customizations
11.6 Related Reports
List of Tables (81 Tables)
Table 1 Drill Pipe Market Size, By Application, 2013�2020 (USD Million)
Table 2 Onshore Drill Pipe Market Size, By Region, 2013�2020 (USD Million)
Table 3 Offshore Drill Pipe Market Size, By Region, 2013�2020 (USD Million)
Table 4 North America: Drill Pipe Market Size, By Application, 2013�2020 (USD Million)
Table 5 Asia-Pacific: Drill Pipe Market Size, By Application, 2013�2020 (USD Million)
Table 6 Europe: Drill Pipe Market Size, By Application, 2013�2020 (USD Million)
Table 7 Latin America: Drill Pipe Market Size, By Application, 2013�2020 (USD Million)
Table 8 Middle East: Drill Pipe Market Size, By Application, 2013�2020 (USD Million)
Table 9 Africa: Drill Pipe Market Size, By Application, 2013�2020 (USD Million)
Table 10 Drill Pipe Market Size, By Grade, 2013�2020 (USD Million)
Table 11 Drill Pipe Market Size, By Grade, 2013�2020 (�000 Short Tons)
Table 12 North America: Drill Pipe Market Size, By Grade, 2013�2020 (USD Million)
Table 13 North America: Drill Pipe Market Size, By Grade, 2013�2020 (�000 Short Tons)
Table 14 Asia-Pacific: Drill Pipe Market Size, By Grade, 2013�2020 (USD Million)
Table 15 Asia-Pacific: Drill Pipe Market Size, By Grade, 2013�2020 (�000 Short Tons)
Table 16 Europe: Drill Pipe Market Size, By Grade, 2013�2020 (USD Million)
Table 17 Europe: Drill Pipe Market Size, By Grade, 2013�2020 (�000 Short Tons)
Table 18 Latin America: Drill Pipe Market Size, By Grade, 2013�2020 (USD Million)
Table 19 Latin America: Drill Pipe Market Size, By Grade, 2013�2020 (�000 Short Tons)
Table 20 Middle East: Drill Pipe Market Size, By Grade, 2013�2020 (USD Million)
Table 21 Middle East: Drill Pipe Market Size, By Grade, 2013�2020 (�000 Short Tons)
Table 22 Africa: Drill Pipe Market Size, By Grade, 2013�2020 (USD Million)
Table 23 Africa: Drill Pipe Market Size, By Grade, 2013�2020 (�000 Short Tons)
Table 24 Drill Pipe Market Size, By Region, 2013�2020 (USD Million)
Table 25 Drill Pipe Market Size, By Region, 2013�2020 (�000 Short Tons)
Table 26 Largest Market Size, By Countries, 2013�2020 (USD Million)
Table 27 Fastest Growing Market, By Countries, 2013�2020 (USD Million)
Table 28 North America: Drill Pipe Market Size, By Country, 2013�2020 (USD Million)
Table 29 U.S.: Drill Pipe Market Size, By Application, 2013�2020 (USD Million)
Table 30 Canada: Drill Pipe Market Size, By Application, 2013�2020 (USD Million)
Table 31 Asia-Pacific: Drill Pipe Market Size, By Country, 2013�2020 (USD Million)
Table 32 China: Drill Pipe Market Size, By Application, 2013�2020 (USD Million)
Table 33 Thailand: Drill Pipe Market Size, By Application, 2013�2020 (USD Million)
Table 34 India: Drill Pipe Market Size, By Application, 2013�2020 (USD Million)
Table 35 Indonesia: Drill Pipe Market Size, By Application, 2013�2020 (USD Million)
Table 36 Australia: Drill Pipe Market Size, By Application, 2013�2020 (USD Million)
Table 37 Rest of Asia-Pacific: Drill Pipe Market Size, By Application, 2013�2020 (USD Million)
Table 38 Europe: Drill Pipe Market Size, By Country, 2013�2020 (USD Million)
Table 39 Russia: Drill Pipe Market Size, By Application, 2013�2020 (USD Million)
Table 40 Norway: Drill Pipe Market Size, By Application, 2013�2020 (USD Million)
Table 41 U.K.: Drill Pipe Market Size, By Application, 2013�2020 (USD Million)
Table 42 Rest of Europe: Drill Pipe Market Size, By Application, 2013�2020 (USD Million)
Table 43 Latin America: Drill Pipe Market Size, By Country, 2013�2020 (USD Million)
Table 44 Mexico: Drill Pipe Market Size, By Application, 2013�2020 (USD Million)
Table 45 Argentina: Drill Pipe Market Size, By Application, 2013�2020 (USD Million)
Table 46 Brazil: Drill Pipe Market Size, By Application, 2013�2020 (USD Million)
Table 47 Venezuela: Drill Pipe Market Size, By Application, 2013�2020 (USD Million)
Table 48 Rest of Latin America: Drill Pipe Market Size, By Application, 2013�2020 (USD Million)
Table 49 Middle East: Drill Pipe Market Size, By Country, 2013�2020 (USD Million)
Table 50 Oman: Drill Pipe Market Size, By Application, 2013�2020 (USD Million)
Table 51 Saudi Arabia: Drill Pipe Market Size, By Application, 2013�2020 (USD Million)
Table 52 Uae: Drill Pipe Market Size, By Application, 2013�2020 (USD Million)
Table 53 Qatar: Drill Pipe Market Size, By Application, 2013�2020 (USD Million)
Table 54 Rest of Middle East: Drill Pipe Market Size, By Application, 2013�2020 (USD Million)
Table 55 Africa: Drill Pipe Market Size, By Country, 2013�2020 (USD Million)
Table 56 Egypt: Drill Pipe Market Size, By Application, 2013�2020 (USD Million)
Table 57 Algeria: Drill Pipe Market Size, By Application, 2013�2020 (USD Million)
Table 58 Nigeria: Drill Pipe Market Size, By Application, 2013�2020 (USD Million)
Table 59 Angola: Drill Pipe Market Size, By Application, 2013�2020 (USD Million)
Table 60 Rest of Africa: Drill Pipe Market Size, By Application, 2013�2020 (USD Million)
Table 61 Contracts & Agreements, 2012�2015
Table 62 Expansions, 2012�2015
Table 63 New Product Launches, 2012�2015
Table 64 Mergers & Acquisitions, 2012�2015
Table 65 Others (Joint Ventures & Restructuring), 2012�2015
Table 66 Hilong Group: Products Offered
Table 67 National Oilwell Varco: Products Offered
Table 68 Tenaris S.A.: Products Offered
Table 69 Vallourec S.A.: Products Offered
Table 70 TMK Group: Products Offered
Table 71 Oil Country Tubular Limited: Products & Services Offered
Table 72 Tejas Tubular Products Inc.: Products Offered
Table 73 Texas Steel Conversion Inc.: Products & Services Offered
Table 74 DP Master: Products Offered
Table 75 Jiangyin Long Bright Drill Pipe Manufacture Co. Ltd.: Products Offered
Table 76 Drill Pipe International Llc: Products Offered
Table 77 Superior Drill Pipe Manufacturing, Inc.: Products & Services Offered
Table 78 Contracts & Agreements, 2012�2015
Table 79 Expansions, 2012�2015
Table 80 New Product Launches, 2012�2015
Table 81 Mergers & Acquisitions, 2012�2015
List of Figures (43 Figures)
Figure 1 Research Design
Figure 2 Bottom-Up Approach
Figure 3 Top-Down Approach
Figure 4 Assumptions of the Research Study
Figure 5 Limitations of the Research Study
Figure 6 North America Dominated the Drill Pipe Market in 2014
Figure 7 Drill Pipe Market: Grade Snapshot (�000 Short Tons)
Figure 8 North America Generated the Highest Demand for Drill Pipes in 2014
Figure 9 Top Countries in the Drill Pipe Market , 2014
Figure 10 Deepwater Drilling in African Countries is Expected to Drive the Drill Pipe Market During the Forecast Period
Figure 11 Offshore Applications to Grow at the Highest CAGR From 2015 to 2020
Figure 12 Onshore Application to Dominate the Drill Pipe Market in 2015
Figure 13 North America Held the Largest Market Share in 2014
Figure 14 China, U.S., & Russia are Expected to Acquire Majority of the Market Share During the Forecast Period
Figure 15 The Onshore Application Market is Expected to Grow at the Highest CAGR During the Forecast Period
Figure 16 Drill Pipe Market Dynamics
Figure 17 Brent Crude Spot Price Decline Continues (2014�2015)
Figure 18 Henry Hub Spot Prices Declined Over the Last Year (2014�2015)
Figure 19 Impact of Market Dynamics
Figure 20 Drill Pipe Market: Supply Chain Analysis
Figure 21 Porter�s Five Forces Analysis: Drill Pipe Market
Figure 22 Drill Pipe Market Share (Value), By Application, 2014
Figure 23 Drill Pipe Market Share (Value), By Grade, 2014
Figure 24 Drill Pipe Market Share (Volume), By Grade, 2014
Figure 25 Regional Snapshot (2014): Rapid-Growth Markets are Emerging as New Hotspots
Figure 26 Regional Snapshot: Emerging Technologies of North America Provide Attractive Market Opportunities
Figure 27 Regional Snapshot: Increasing Energy Demand in Asia-Pacific Provides Attractive Market Opportunities
Figure 28 Regional Snapshot: Unexplored Reserves in Africa Provide Attractive Market Opportunities
Figure 29 Companies Adopted Contracts & Agreements and Expansion as Key Growth Strategies in the Past Four Years (2012-2015)
Figure 30 National Oilwell Varco Held the Largest Share in the Drill Pipe Market, 2014
Figure 31 Market Evaluation Framework
Figure 32 Battle for Market Share: Contracts & Agreements Was the Key Strategy
Figure 33 Regional Revenue of the Top 5 Market Players
Figure 34 Hilong Group: Company Snapshot
Figure 35 Hilong Group: SWOT Analysis
Figure 36 National Oilwell Varco: Company Snapshot
Figure 37 National Oilwell Varco: SWOT Analysis
Figure 38 Tenaris S.A.: Company Snapshot
Figure 39 Tenaris S.A.: SWOT Analysis
Figure 40 Vallourec S.A.: Company Snapshot
Figure 41 Vallourec S.A.: SWOT Analysis
Figure 42 TMK Group: Company Snapshot
Figure 43 Oil Country Tubular Limited: Company Snapshot


Growth opportunities and latent adjacency in Drill Pipe Market