Distillers� Grains Market by Type (Dried Distillers� Grains with Solubles, Dried Distillers� Grains, and Wet Distillers� Grains), Source (Corn and Wheat), Livestock (Ruminants, Swine, and Poultry), and Region - Global Forecast to 2023


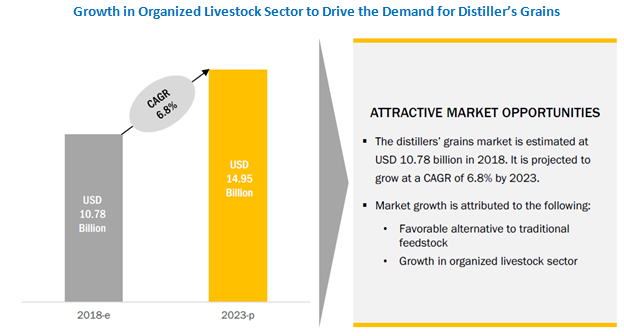
[149 Pages Report] The distillers’ grains market is estimated to be valued at USD 10.8 billion in 2018 and is projected to reach USD 14.9 billion by 2023, at a CAGR of 6.8% from 2018 to 2023. Factors such as distillers’ grains being a favourable alternative to traditional feedstock, and growth in the organized livestock sector is expected to drive market growth. Traditionally, crops such as corn, wheat, and rice are used as feedstock, since they are an efficient source of protein and energy for livestock. Distillers’ grains, especially DDGS, are fed to livestock as an alternative to commodity crops such as corn and wheat. Distillers’ grains are produced as a by-product of ethanol production.
For More details on this research, Request Free Sample Report
According to the American Coalition for Ethanol (US), “for every gallon of ethanol, ethanol plants produce six pounds of high-quality feed, called distillers’ grains.” According to the Renewable Fuel Association (US), the total production of ethanol increased by more than 10% from 2010 to 2015, which is driving the market for distillers’ grains. Additionally, constant growth has been witnessed in the organized livestock sector in developing countries due to the increase in awareness about the need and demand for quality livestock products. According to the Food and Agriculture Organization (US), meat consumption in the world increased from 30.7 kg (67.9 pounds) to 41.3 kg (91.1 pounds) per capita/year and milk consumption increased by 78 kg (172 pounds) to 83 kg (183 pounds) per capita/year, from 1986 to 2015. According to the FAO, from 1961 to 2007, maximum growth in meat production occurred in Southeast Asian countries, followed by South American and Caribbean countries. High growth was also seen in egg production in Southeast Asian countries. In the last decade, developing countries have outperformed developed countries in terms of the production of livestock products. These trends are expected to increase the demand for distillers’ grains.
The periodization considered for the study is as follows:
- Base year: 2017
- Forecast period: 2018 to 2023
The objectives of the report
- Determining and projecting the size of the distillers’ grains market with respect to type, source, livestock, and regional markets, over a five-year period ranging from 2018 to 2023
- Identifying attractive opportunities in the market by determining the largest and fastest-growing segments across regions
- Analyzing the segments and subsegments of the global market for distillers’ grains included in the report with respect to individual growth trends, future prospects, and their contribution to the global market
- Identifying and profiling the key players in the global market
- Determining the market ranking of key players operating in the market for distillers’ grains.
-
Providing a comparative analysis of the market leaders on the basis of the following:
- Product offerings
- Business strategies
- Strengths and weaknesses
- Key financials
- Understanding the competitive landscape and identifying the major growth strategies adopted by players across key regions
- Analyzing the market dynamics and competitive situations & trends across regions and their impact on prominent market players
Research Methodology:
- The key regions were identified, along with countries contributing the maximum share
- Secondary research was conducted to find the value of distillers’ grains for regions such as North America, Europe, Asia Pacific, and RoW
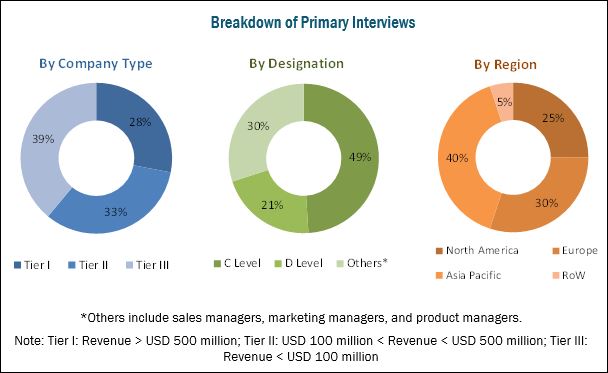
- The key players were identified through secondary sources such as the Food and Agriculture Organization (FAO), the US Department of Agriculture (USDA), International Monetary Fund (IMF), World Bank, and Organisation for Economic Co-operation and Development (OECD), while their market share in respective regions were determined through both, primary and secondary research processes. The research methodology included the study of annual and financial reports of top market players, as well as interviews with industry experts (such as CEOs, VPs, directors, and marketing executives) for key insights (both quantitative and qualitative) for the distillers’ grains market.
To know about the assumptions considered for the study, download the pdf brochure
The various contributors involved in the value chain of the global market include raw material suppliers, R&D institutes, distillers’ grain manufacturing companies [such as ADM (US), Valero (US), Green Plains Inc. (US), Pacific Ethanol, Inc. (US)], distillers’ grain distributors, livestock producers, feed manufacturers, and government bodies & regulatory associations [such as the US Department of Agriculture (USDA), the Food and Drug Administration (FDA), and the European Food Safety Authority (EFSA)].
Target Audience
The stakeholders for the report are as follows:
- Manufacturers, distributors, and traders of feed
- Manufacturers, distributors, importers, and exporters of distillers’ grains
- Livestock producers
- Animal husbandry companies
- Ranches & poultry farms
- R&D institutes
-
Regulatory bodies
- Food and Agriculture Organization (FAO)
- United States Department of Agriculture (USDA)
- European Food Safety Authority (EFSA)
- Ministry of Health, Labour and Welfare (MHLW) (Japan)
- Food Standards Australia New Zealand (FSANZ)
- China’s Ministry of Agriculture (MOA)
-
Government agencies, NGOs, and associations
- US Grain Council (USGC)
- Association of American Feed Control Officials (AAFCO)
- International Feed Industry Federation (IFIF)
- Associations of Poultry Processors and Poultry Trade in EU (AVEC)
- EU Association of Specialty Feed Ingredients and their Mixtures (FEFANA)
- Global Feed LCA Institute (GFLI)
Scope of the Report:
This research report categorizes the distillers’ grains market based on type, source, livestock, and region.
Based on Type, the market has been segmented as follows:
- DDGS
- DDG
- WDG
- Others (MWDG and CDS)
Based on Source, the market has been segmented as follows:
- Corn
- Wheat
- Others (Sorghum, rice, barley, and rye)
Based on Livestock, the market has been segmented as follows:
- Ruminants
- Swine
- Poultry
- Others (Equine and aquaculture)
Based on Region, the market has been segmented as follows:
- North America
- Europe
- Asia Pacific
- RoW (South America, Middle East, and Africa)
Available Customizations
With the given market data, MarketsandMarkets offers customizations according to the company’s specific scientific needs.
The following customization options are available for the report:
Product Analysis
- Product matrix, which gives a detailed comparison of product portfolio of each company
Geographic Analysis
- Further breakdown of the Rest of Asia Pacific market for distillers’ grains, by key country
- Further breakdown of the Rest of Europe market for distillers’ grains, by key country
Company Information
- Detailed analyses and profiling of additional market players (up to five)
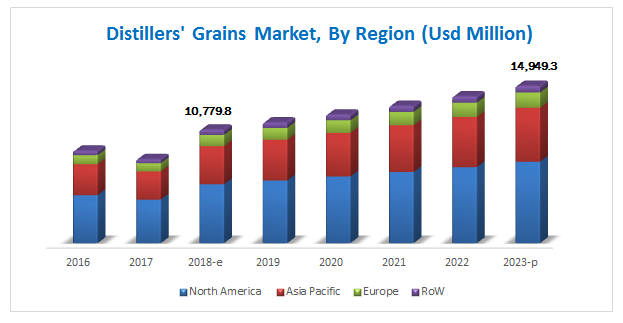
The distillers’ grains market is estimated to be valued at USD 10.78 Billion in 2018 and is projected to reach USD 14.95 Billion by 2023, at a CAGR of 6.8% during the forecast period. The market is driven by the growing use of distillers grains as a favorable alternative to traditional feedstock and growth of the organized livestock sector.
The market, based on type, has been segmented into DDGS, DDG, WDG, and others. The market for DDGS is estimated to dominate in 2018 and is also projected to be the fastest-growing segment during the forecast period. This growth can be attributed to several properties of DDGS such as high protein content, energy, and highly digestible phosphorus content, which are responsible for its growing use as a partial replacement for some more expensive traditional animal feed such as corn and soybean meal.
The global market, by source, has been segmented into corn, wheat, and others. The corn segment is estimated to dominate the market in 2018 and is projected to grow at a higher CAGR by 2023. This is attributable to the fact that this is the key grain used in ethanol production, resulting in an increasing supply of corn-based distillers’ grains, as a by-product. Further, the high availability of phosphorus content in corn-based distillers’ grains provides high energy and protein to livestock. It is also an economical alternative to other feed ingredients.
The market, by livestock, has been segmented into ruminants, swine, poultry, and others. It was dominated by the ruminants segment in 2017. The growth in demand for quality milk and beef products has led to the use of distillers’ grains in ruminant diets, due to their higher protein content than traditional feed such as corn. The poultry segment is projected to be the fastest-growing during the forecast period. On a global level, poultry production has been increasing, and with such growth in production and consumption, it has become important for meat producers to focus more on quality. This gives a boost to the market for distillers’ grains to provide nutritional feed for poultry.
For More details on this research, Request Free Sample Report
The market in North America is driven by the high production and consumption of distillers’ grains in the US market. Further growth can be attributed to the growing trade of distillers’ grains from the US to Canada and Mexico, due to the North American Free Trade Agreement (NAFTA). This agreement allows duty-free access to all products promoted by the United States Grains Council (USGC) which include distillers’ grains. The Asia Pacific market is projected to grow at the highest CAGR from 2018 to 2023. The increase in demand for animal-based products; growth of the regional population; the rise in disposable incomes; the rise in urbanization, especially in China, India, and Japan; and continuous modernization in the feed industry drive the global market in Asia Pacific.
Lack of awareness in developing countries, fluctuating prices of grains, and Ill-effects of excess consumption are the major restraints for the growth of this market.
The global market for distillers’ grains is dominated by large-scale players such as Green Plains Inc. (US), Pacific Ethanol, Inc. (US), Flint Hill Resources (US), Valero (US), and CropEnergies AG (Germany).
ADM (US), Husky Energy (Canada), Bunge Limited (US), Purina Animal Nutrition (US), Poet LLC (US), Didion Milling Inc. (US) and Greenfield Global (Canada) are the other players that hold a significant share in the global market.
To speak to our analyst for a discussion on the above findings, click Speak to Analyst
 Exclusive indicates content/data unique to MarketsandMarkets and not available with any competitors.
Table of Contents
1 Introduction (Page No. - 15)
1.1 Objectives of the Study
1.2 Market Definition
1.3 Study Scope
1.4 Periodization Considered for the Study
1.5 Currency Considered
1.6 Units Considered
1.7 Stakeholders
2 Research Methodology (Page No. - 20)
2.1 Research Data
2.1.1 Secondary Data
2.1.1.1 Key Data From Secondary Sources
2.1.2 Primary Data
2.1.2.1 Key Data From Primary Sources
2.1.2.2 Breakdown of Primaries
2.2 Market Size Estimation
2.3 Data Triangulation
2.4 Research Assumptions & Limitations
3 Executive Summary (Page No. - 28)
4 Premium Insights (Page No. - 33)
4.1 Attractive Opportunities in the Market
4.2 Market For Distillers’ Grains, By Key Country
4.3 Asia Pacific: Distillers’ Grains Market, By Type & Key Country
4.4 Market For Distillers’ Grains, By Source & Region
4.5 Market For Distillers’ Grains, By Livestock & Region
5 Market Overview (Page No. - 38)
5.1 Introduction
5.2 Market Dynamics
5.2.1 Drivers
5.2.1.1 Favorable Alternative to Traditional Feedstock
5.2.1.2 Growth of the Organized Livestock Sector
5.2.2 Restraints
5.2.2.1 Lack of Awareness in Developing Countries
5.2.2.2 Fluctuating Prices of Grains
5.2.2.3 Ill-Effects of Excess Consumption
5.2.3 Opportunities
5.2.3.1 Increase in Awareness About Precision Nutrition Techniques
5.2.4 Challenges
5.2.4.1 Incidences of Mycotoxin Contamination in Feed
5.3 Value Chain
5.4 Feed Raw Material Analysis
5.4.1 Total Production of Feed Ingredients and Their Usage in Feed
5.4.1.1 Corn
5.4.1.2 Wheat
5.4.1.3 Barley
5.4.1.4 Sorghum
5.4.1.5 Oats
5.4.1.6 Rye
5.4.1.7 Millet
5.5 Pricing Analysis
6 Distillers’ Grains Market, By Type (Page No. - 53)
6.1 Introduction
6.2 Dried Distillers’ Grains With Solubles (DDGS)
6.3 Dried Distillers’ Grains (DDG)
6.4 Wet Distillers’ Grains (WDG)
6.5 Others
7 Distillers’ Grains Market, By Source (Page No. - 60)
7.1 Introduction
7.2 Corn
7.3 Wheat
7.4 Others
8 Distillers’ Grains Market, By Livestock (Page No. - 67)
8.1 Introduction
8.2 Ruminants
8.3 Swine
8.4 Poultry
8.5 Others
9 Distillers’ Grains Market, By Region (Page No. - 75)
9.1 Introduction
9.2.1 US
9.2.2 Canada
9.2.3 Mexico
9.3 Asia Pacific
9.3.1 China
9.3.2 Vietnam
9.3.3 India
9.3.4 Japan
9.3.5 Australia & New Zealand
9.3.6 Rest of Asia Pacific
9.4 Europe
9.4.1 France
9.4.2 Germany
9.4.3 Spain
9.4.4 Netherlands
9.4.5 UK
9.4.6 Hungary
9.4.7 Rest of Europe
9.5 Rest of the World (RoW)
9.5.1 South America
9.5.2 Middle East
9.5.3 Africa
10 Competitive Landscape (Page No. - 115)
10.1 Overview
10.2 Competitive Scenario
10.3 Market Ranking Analysis
10.4 Mergers & Acquisitions
10.5 Expansions & Investments
10.6 Partnerships & Agreements
11 Company Profiles (Page No. - 120)
(Business Overview, Products Offered, Recent Developments, SWOT Analysis, MnM View)*
11.1 ADM
11.2 Valero
11.3 Husky Energy
11.4 Green Plains Inc.
11.5 Bunge Limited
11.6 Pacific Ethanol, Inc.
11.7 Cropenergies AG
11.8 Purina Animal Nutrition (Land O’ Lakes)
11.9 Flint Hills Resources
11.10 Poet, LLC
11.11 Didion Milling Inc.
11.12 Greenfield Global
*Details on Business Overview, Products Offered, Recent Developments, SWOT Analysis, MnM View Might Not Be Captured in Case of Unlisted Companies.
12 Appendix (Page No. - 141)
12.1 Discussion Guide
12.2 Knowledge Store: Marketsandmarkets’ Subscription Portal
12.3 Introducing RT: Real-Time Market Intelligence
12.4 Available Customizations
12.5 Related Reports
12.6 Author Details
List of Tables (114 Tables)
Table 1 Distillers’ Grains Market Snapshot, By Region & Source, 2018 vs 2023 (KT)
Table 2 Feed Cost Saving By Increasing Dietary Wheat DDGS for Swine
Table 3 Feed Cost Saving By Increasing Dietary Corn DDGS for Swine
Table 4 Size of Market For Distillers’ Grains, By Type, 2016–2023 (USD Million)
Table 5 Size of Market For Distillers’ Grains, By Type, 2016–2023 (KT)
Table 6 DDGS Market Size, By Region, 2016–2023 (USD Million)
Table 7 DDGS Market Size, By Region, 2016–2023 (KT)
Table 8 DDG Market Size, By Region, 2016–2023 (USD Million)
Table 9 DDG Market Size, By Region, 2016–2023 (KT)
Table 10 WDG Market Size, By Region, 2016–2023 (USD Million)
Table 11 WDG Market Size, By Region, 2016–2023 (KT)
Table 12 Other Distillers’ Grains Market Size, By Region, 2016–2023 (USD Million)
Table 13 Other Distillers’ Grains Market Size, By Region, 2016–2023 (USD Million)
Table 14 Comparison of Nutritional Composition: Corn & Wheat DDGS vs Other Feed Ingredients
Table 15 Size of Market For Distillers’ Grains, By Source, 2016–2023 (USD Million)
Table 16 Size of Market For Distillers’ Grains, By Source, 2016–2023 (KT)
Table 17 Comparison of Nutritional Composition: Corn DDGS vs Other Feed Ingredients
Table 18 Corn Market Size, By Region, 2016–2023 (USD Million)
Table 19 Corn Market Size, By Region, 2016–2023 (KT)
Table 20 Comparison of Nutritional Composition: Wheat DDGS vs Other Feed Ingredients
Table 21 Wheat Market Size, By Region, 2016–2023 (USD Million)
Table 22 Wheat Market Size, By Region, 2016–2023 (KT)
Table 23 Comparison of Nutritional Composition: Sorghum DDGS vs Other Feed Ingredients
Table 24 Other Sources Market Size, By Region, 2016–2023 (USD Million)
Table 25 Other Sources Market Size, By Region, 2016–2023 (KT)
Table 26 Size of Market For Distillers’ Grains, By Livestock, 2016–2023 (USD Million)
Table 27 Size of Market For Distillers’ Grains, By Livestock, 2016–2023 (KT)
Table 28 Distillers’ Grains Market Size in Ruminant Feed, By Region, 2016–2023 (USD Million)
Table 29 Market Size in Ruminant Feed, By Region, 2016–2023 (KT)
Table 30 Market Size in Ruminant Feed, By Ruminant Type, 2016–2023 (USD Million)
Table 31 Market Size in Swine Feed, By Region, 2016–2023 (USD Million)
Table 32 Market Size in Swine Feed, By Region, 2016–2023 (KT)
Table 33 Market Size in Swine Feed, By Swine Type, 2016–2023 (USD Million)
Table 34 Market Size in Poultry Feed, By Region, 2016–2023 (USD Million)
Table 35 Market Size in Poultry Feed, By Region, 2016–2023 (KT)
Table 36 Market Size in Poultry Feed, By Poultry Type, 2016–2023 (USD Million)
Table 37 Market Size in Other Livestock Feed, By Region, 2016–2023 (USD Million)
Table 38 Market Size in Other Livestock Feed, By Region, 2016–2023 (KT)
Table 39 Market Size, By Region, 2016–2023 (USD Million)
Table 40 Market Size, By Region, 2016–2023 (KT)
Table 41 North America: Distillers’ Grains Market Size, By Country, 2016–2023 (USD Million)
Table 42 North America: Market Size, By Country, 2016–2023 (KT)
Table 43 North America: Market Size, By Type, 2016–2023 (USD Million)
Table 44 North America: Size of Market For Distillers’ Grains, By Type, 2016–2023 (KT)
Table 45 North America: Size of Market For Distillers’ Grains, By Source, 2016–2023 (USD Million)
Table 46 North America: Size of Market For Distillers’ Grains, By Source, 2016–2023 (KT)
Table 47 North America: Distillers’ Grains Market Size, By Livestock, 2016–2023 (USD Million)
Table 48 North America: Market Size, By Livestock, 2016–2023 (KT)
Table 49 US: Distillers’ Grains Market Size, By Type, 2016–2023 (USD Million)
Table 50 US: Size of Market For Distillers’ Grains, By Livestock, 2016–2023 (USD Million)
Table 51 Feedstock Used for Ethanol Production, 2010–2017 (KT)
Table 52 Canada: Market Size, By Type, 2016–2023 (USD Million)
Table 53 Canada: Size of Market For Distillers’ Grains, By Livestock, 2016–2023 (USD Million)
Table 54 Mexico: Distillers’ Grains Market Size, By Type, 2016–2023 (USD Million)
Table 55 Mexico: Size of Market For Distillers’ Grains, By Livestock, 2016–2023 (USD Million)
Table 56 Asia Pacific: Distillers’ Grains Market Size, By Country, 2016–2023 (USD Million)
Table 57 Asia Pacific: Market Size, By Country, 2016–2023 (KT)
Table 58 Asia Pacific: Market Size, By Type, 2016–2023 (USD Million)
Table 59 Asia Pacific: Size of Market For Distillers’ Grains, By Type, 2016–2023 (KT)
Table 60 Asia Pacific: Size of Market For Distillers’ Grains, By Source, 2016–2023 (USD Million)
Table 61 Asia Pacific: Size of Market For Distillers’ Grains, By Source, 2016–2023 (KT)
Table 62 Asia Pacific: Market Size, By Livestock, 2016–2023 (USD Million)
Table 63 Asia Pacific: Market Size, By Livestock, 2016–2023 (KT)
Table 64 China: Distillers’ Grains Market Size, By Type, 2016–2023 (USD Million)
Table 65 China: Size of Market For Distillers’ Grains, By Livestock, 2016–2023 (USD Million)
Table 66 Vietnam: Distillers’ Grains Market Size, By Type, 2016–2023 (USD Million)
Table 67 Vietnam: Size of Market For Distillers’ Grains, By Livestock, 2016–2023 (USD Million)
Table 68 India: Distillers’ Grains Market Size, By Type, 2016–2023 (USD Million)
Table 69 India: Size of Market For Distillers’ Grains, By Livestock, 2016–2023 (USD Million)
Table 70 Japan: Market Size, By Type, 2016–2023 (USD Million)
Table 71 Japan: Size of Market For Distillers’ Grains, By Livestock, 2016–2023 (USD Million)
Table 72 Australia & New Zealand: Distillers’ Grains Market Size, By Type, 2016–2023 (USD Million)
Table 73 Australia & New Zealand: Size of Market For Distillers’ Grains, By Livestock, 2016–2023 (USD Million)
Table 74 Rest of Asia Pacific: Distillers’ Grains Market Size, By Type, 2016–2023 (USD Million)
Table 75 Rest of Asia Pacific: Size of Market For Distillers’ Grains, By Livestock, 2016–2023 (USD Million)
Table 76 Europe: Distillers’ Grains Market Size, By Country, 2016–2023 (USD Million)
Table 77 Europe: Market Size, By Country, 2016–2023 (KT)
Table 78 Europe: Market Size, By Type, 2016–2023 (USD Million)
Table 79 Europe: Size of Market For Distillers’ Grains, By Type, 2016–2023 (KT)
Table 80 Europe: Size of Market For Distillers’ Grains, By Source, 2016–2023 (USD Million)
Table 81 Europe: Size of Market For Distillers’ Grains, By Source, 2016–2023 (KT)
Table 82 Europe: Market Size, By Livestock, 2016–2023 (USD Million)
Table 83 Europe: Market Size, By Livestock, 2016–2023 (KT)
Table 84 France: Market Size, By Type, 2016–2023 (USD Million)
Table 85 France: Size of Market For Distillers’ Grains, By Livestock, 2016–2023 (USD Million)
Table 86 Germany: Distillers’ Grains Market Size, By Type, 2016–2023 (USD Million)
Table 87 Germany: Size of Market For Distillers’ Grains, By Livestock, 2016–2023 (USD Million)
Table 88 Spain: Distillers’ Grains Market Size, By Type, 2016–2023 (USD Million)
Table 89 Spain: Size of Market For Distillers’ Grains, By Livestock, 2016–2023 (USD Million)
Table 90 Netherlands: Distillers’ Grains Market Size, By Type, 2016–2023 (USD Million)
Table 91 Netherlands: Size of Market For Distillers’ Grains, By Livestock, 2016–2023 (USD Million)
Table 92 UK: Market Size, By Type, 2016–2023 (USD Million)
Table 93 UK: Size of Market For Distillers’ Grains, By Livestock, 2016–2023 (USD Million)
Table 94 Hungary: Distillers’ Grains Market Size, By Type, 2016–2023 (USD Million)
Table 95 Hungary: Size of Market For Distillers’ Grains, By Livestock, 2016–2023 (USD Million)
Table 96 Rest of Europe: Distillers’ Grains Market Size, By Type, 2016–2023 (USD Million)
Table 97 Rest of Europe: Size of Market For Distillers’ Grains, By Livestock, 2016–2023 (USD Million)
Table 98 RoW: Distillers’ Grains Market Size, By Region, 2016–2023 (USD Million)
Table 99 RoW: Market Size, By Region, 2016–2023 (KT)
Table 100 RoW: Market Size, By Type, 2018–2023 (USD Million)
Table 101 RoW: Size of Market For Distillers’ Grains, By Type, 2018–2023 (KT)
Table 102 RoW: Size of Market For Distillers’ Grains, By Source, 2016–2023 (USD Million)
Table 103 RoW: Size of Market For Distillers’ Grains, By Source, 2016–2023 (KT)
Table 104 RoW: Market Size, By Livestock, 2016–2023 (USD Million)
Table 105 RoW: Market Size, By Livestock, 2016–2023 (KT)
Table 106 South America: Distillers’ Grains Market Size, By Type, 2016–2023 (USD Million)
Table 107 South America: Size of Market For Distillers’ Grains, By Livestock, 2016–2023 (USD Million)
Table 108 Middle East: Distillers’ Grains Market Size, By Type, 2016–2023 (USD Million)
Table 109 Middle East: Size of Market For Distillers’ Grains, By Livestock, 2016–2023 (USD Million)
Table 110 Africa: Distillers’ Grains Market Size, By Type, 2016–2023 (USD Million)
Table 111 Africa: Size of Market For Distillers’ Grains, By Livestock, 2016–2023 (USD Million)
Table 112 Acquisitions, 2015–2017
Table 113 Expansions & Investments, 2016–2017
Table 114 Partnerships & Agreements, 2013–2016
List of Figures (45 Figures)
Figure 1 Market Segmentation
Figure 2 Regional Scope
Figure 3 Research Design
Figure 4 Market Size Estimation Methodology: Bottom-Up Approach
Figure 5 Market Size Estimation Methodology: Top-Down Approach
Figure 6 Data Triangulation
Figure 7 Research Assumptions
Figure 8 Research Limitations
Figure 9 Distillers’ Grains Market Size, By Type, 2018 vs 2023 (USD Million)
Figure 10 Size of Market For Distillers’ Grains, By Source, 2018 vs 2023 (USD Million)
Figure 11 Size of Market For Distillers’ Grains, By Livestock, 2018 vs 2023 (USD Million)
Figure 12 Distillers’ Grains Market Share (Value), By Region, 2017
Figure 13 Growth in Organized Livestock Sector to Drive the Demand for Distillers’ Grains
Figure 14 The Chinese Distillers’ Grains Market is Projected to Be the Fastest-Growing, 2018–2023
Figure 15 DDGS and China Accounted for the Largest Shares in Their Respective Segments in 2017 (Value)
Figure 16 North America to Be the Dominant Region in the Global Market Across All Sources, 2018 vs 2023 (Value)
Figure 17 Poultry to Be the Fastest-Growing Segment During the Forecast Period
Figure 18 Ethanol Production, By Country/Region (1967–2030)
Figure 19 Fluctuating Grain Prices, 2006–2017
Figure 20 Mycotoxin Contamination in Feed Ingredients
Figure 21 Value Chain
Figure 22 Global Corn Production and Usage in Feed, 2006–2018
Figure 23 Global Wheat Production and Usage in Feed, 2006–2018
Figure 24 Global Barley Production and Usage in Feed, 2006–2018
Figure 25 Global Sorghum Production and Usage in Feed, 2006–2018
Figure 26 Global Oat Production and Usage in Feed, 2006–2018
Figure 27 Global Rye Production and Usage in Feed, 2006–2018
Figure 28 Global Millet Production and Usage in Feed, 2006–2018
Figure 29 Price Comparison: Distillers’ Grains vs Other Feed Materials, 2014–2025 (USD/Mt)
Figure 30 Market Share (Value), By Type, 2018 vs 2023
Figure 31 Share (Value) of Market For Distillers’ Grains, By Source, 2018 vs 2023
Figure 32 Share (Value) of Market For Distillers’ Grains, By Livestock, 2018 vs 2023
Figure 33 US Accounted for the Largest Share in the Market For Distillers’ Grains in 2017
Figure 34 North America: Snapshot of Market For Distillers’ Grains
Figure 35 Asia Pacific: Snapshot of Market For Distillers’ Grains
Figure 36 Key Developments By Leading Players in the Market For Distillers’ Grains, 2013–2018
Figure 37 Number of Developments Between 2015 and 2017
Figure 38 Ranking of Key Players in the Global Market
Figure 39 ADM: Company Snapshot
Figure 40 Valero: Company Snapshot
Figure 41 Husky Energy: Company Snapshot
Figure 42 Green Plains Inc.: Company Snapshot
Figure 43 Bunge Limited: Company Snapshot
Figure 44 Pacific Ethanol, Inc.: Company Snapshot
Figure 45 Cropenergies AG: Company Snapshot


Growth opportunities and latent adjacency in Distillers� Grains Market