Dark Analytics Market by Component (Solutions, Services), Deployment Mode (Cloud, On-premises), Business Application (Marketing, Operations, Finance, Human Resources), Vertical (BFSI, Healthcare), and Region - Global Forecast to 2023


[124 Pages Report] Dark analytics is the process of turning dark data into insightful and intelligent data that can be used by organizations for decision-making, building new insights regarding customers, developing new target paths for the future, exploring new growth opportunities, reducing operational risks, and increasing ROI. Dark analytics mainly focuses on raw, unstructured data that includes text messages, emails, audio, video, and images, which has not been tapped or analyzed before.
Dark analytics solutions help organizations manage campaigns, make quick decisions, analyze markets, and derive customer insights. These solutions empower the decision-making process of SMEs and enable them to identify the existing and future business risks. The presence of cloud-based analytics solutions has paved the way for wide-scale implementation of dark analytics solutions among SMEs
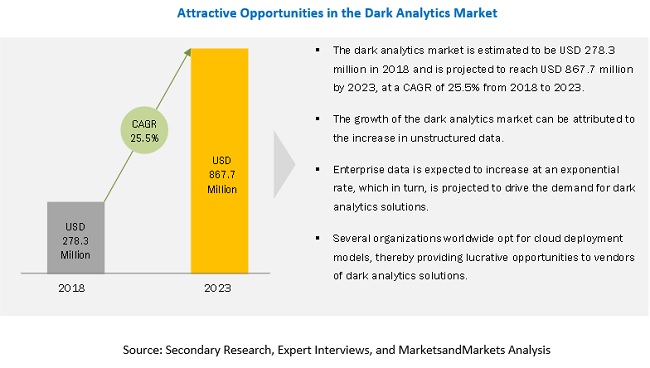
The dark analytics market is projected to grow from USD 278.3 million in 2018 to USD 867.7 million by 2023, at a CAGR of 25.5% during the forecast period.
“The solutions segment is projected to lead the dark analytics market during the forecast period”
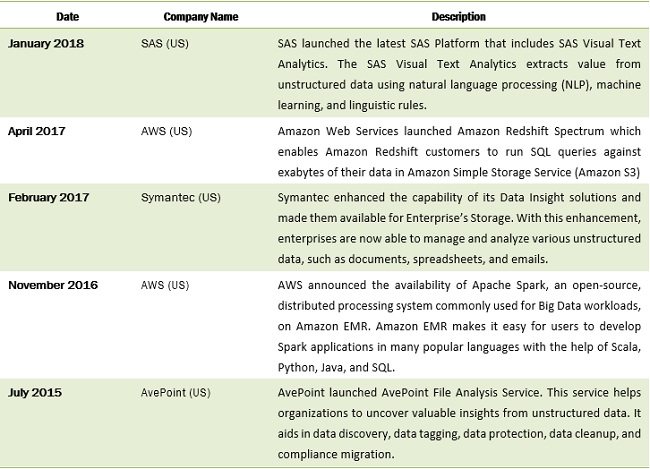
Based on component, the solutions segment is projected to lead the dark analytics market from 2018 to 2023. The growth of the solutions segment can be attributed to the increasing adoption of dark analytics tools that include Apache Hadoop, IBM Watson, SAP HANA 2, Datumize Observer, and Microsoft Cognitive Services. These tools encompass features such as video and sound analytics, computer vision, machine learning, and advanced pattern recognition.
The on-premises segment of the dark analytics is projected to dominate the market during the forecast period
Based on deployment mode, the on-premises segment of the dark analytics is projected to grow at a higher CAGR of 26.5% during the forecast period as compared to the cloud segment. Rising security concerns and increasing regulations in the BFSI and healthcare sectors have led to the on-premises deployment of dark analytics solutions.
“The marketing segment is projected to lead the dark analytics market during the forecast period”
Based on business application, the marketing segment is projected to lead the dark analytics market from 2018 to 2023. This segment is estimated to be USD 124.7 million in 2018 and is projected to reach USD 404.8 million by 2023, at a CAGR of 26.6% during the forecast period. Marketing is considered to be one of the most integral business applications of any organization.
“APAC to account for the largest market growth during the forecast period”
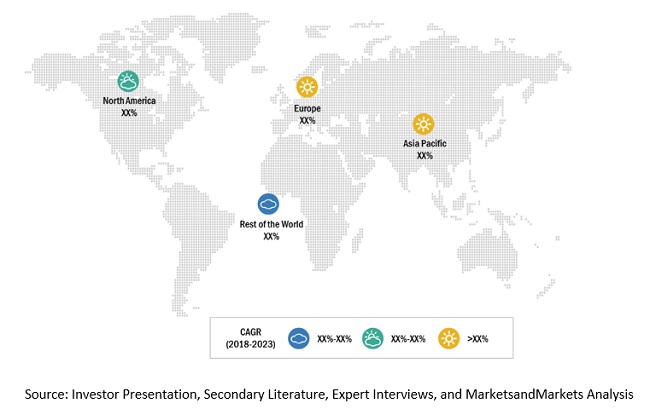
The dark analytics market in Asia Pacific is expected to grow at the highest CAGR during the forecast period. This growth can be attributed to the increased spending on improving the IT infrastructure and the emergence of advanced and secure cloud-based solutions. Key countries considered for market analysis in the Asia Pacific region include China, Japan, Australia, and New Zealand. Companies in the Asia Pacific region are shifting their focus from customer acquisition to customer experience. They are increasingly investing in customer intelligence to gain insights regarding customer sentiment and buying behavior. Companies are also focused on the adoption of cloud-based analytics services, which, in turn, is contributing to the growth of the dark analytics market in this region.
Countries in the North American region are early adopters of dark analytics technology. In North America, various dark analytics startups are providing services to various industries. In addition, leading analytics and cloud service providers are based in this region. Dark analytics solutions are adopted by governments and large enterprises to improve their decision-making process. Key countries considered for market analysis in the North American region are the US and Canada.
Market Dynamics
Driver: Rapid Growth in data generated by organizations due to increasing adoption of IoT
Internet connectivity and devices present organizations with the opportunity to extract relevant data, such as consumer behavior in retail outlets, real-time marketing analysis, sensor-driven decision analytics, and instantaneous control response in complex autonomous systems. IoT connects companies and governments with all smart prospects, such as smart cities, smart transportation, smart healthcare, and smart energy. Every day, IoT generates vast amounts of data in different formats from millions of sources in real time at high velocity. According to Cisco’s Global Cloud Index study, IoT would generate 600 Zettabytes (ZB) of data per year by 2020. About 90% of the data generated by IoT would be in an unstructured format. These unstructured data contain vital information that can help organizations plan and strategize future operations. Hence, the rapid adoption of IoT in verticals such as BFSI, healthcare, manufacturing, and others is expected to drive the demand for dark analytics to generate meaningful insights from dark data.
Restraint: Non-uniformity of data
Synchronization and integration of dark data are among the major restraints for the dark analytics market. There is huge heterogeneity in dark data since it is obtained from different sources at different rates and on different schedules. There is a risk of information being unsynchronized due to conventional data marts, sequences of data extractions and transformations, and importantly, its accumulation from diverse sources. In recent times, the volume of data has been increasing due to the growing use of various personal devices, such as smartphones, wearable devices, and laptops, among others, which require real-time processing of data, data coherence, and proper technology selection, thereby making integration of transactional data much more difficult. Dark data is present in the form of emails, videos, text, audio, images, and other formats. It is very difficult for data scientists to manage, govern, and clean this dark data. There is a lack of tools for dark data standardization. Hence, organizations have to invest in huge amounts to extract relevant data from varied and non-uniform data sources. In addition, non-uniform data may not always provide relevant insights and consume more time to process and analyze. This may hamper the adoption of dark analytics solutions in the coming years.
Opportunity: Increasing investments in dark analytics technology by SMEs
Presently, SMEs are under immense pressure to compete with large giants. They are implementing the analytics strategy and investing in new analytics solutions to enhance their competitiveness. Dark analytics help organizations in managing campaigns, making quick decisions, analyzing markets, and deriving customer insights. Dark analytics empower the decision-making process of SMEs and enable them to identify existing and future business risks easily. The presence of cloud-based analytics solutions has paved the path for wide-scale implementation of dark analytics solutions among small organizations. In today’s era of digital transformation, more and more SMEs are shifting their focus toward adopting the best-in-class technologies in their business ecosystem. Hence, the increasing investments in emerging technologies present a sizeable opportunity for dark analytics vendors.
Challenge: Limited number of affordable dark analytics management and consulting firms
There is a huge scarcity of affordable dark analytics management and business consulting firms. The dark analytics management and consulting vertical is mostly dominated by large companies whose services are not in line with the needs and budgets of small and medium organizations. Large consulting companies are mostly concerned with selling their business services to undertake complex projects for extended periods of time. As there is a huge demand for analytics associated services among small and business enterprises, the shortage of management and consulting firms may slow down the adoption of dark analytics in the coming years.
Scope of the Dark Analytics Market Report
|
Report Metric |
Details |
|
Market size available for years |
2016 – 2023 |
|
Base year considered |
2017 |
|
Forecast period |
2018 – 2023 |
|
Forecast units |
Million/Billion (USD) |
|
Segments covered |
Component, Business Application, Deployment Mode, Vertical, and Region |
|
Geographies covered |
North America, Europe, APAC, RoW |
|
Companies covered |
Key market players covered, including |
The research report categorizes the Dark Analytics market to forecast the revenues and analyze the trends in each of the following sub-segments:
Dark Analytics Market, By Component
- Solutions
-
Services
- Consulting & System Integration
- Training & Support
- Managed Services
Market By Business Application
- Marketing
- Operations
- Finance
- Human Resource (HR)
Dark Analytics Market, By Deployment Mode
- Cloud
- On-Premises
Market By Vertical
- Retail & E-commerce
- BFSI
- Healthcare
- Travel & Hospitality
- Government
- Telecommunication
- Others*
Dark Analytics Market, By Region
- North America
- Europe
- Asia Pacific (APAC)
- RoW
Key Market Players
IBM Corporation (US), SAP SE (Germany), Amazon Web Services (US), Micro Focus (UK), Dell EMC (US), Microsoft Corporation (US).
Recent Developments
Frequently Asked Questions (FAQ):
How big is the Dark Analytics Market?
What is growth rate of the Dark Analytics Market?
What are the top trends in Dark Analytics Market?
Who are the key players in Dark Analytics Market?
Who will be the leading hub for Dark Analytics Market?
What are the top opportunities in Dark Analytics Market?
To speak to our analyst for a discussion on the above findings, click Speak to Analyst
 Exclusive indicates content/data unique to MarketsandMarkets and not available with any competitors.
Table of Contents
1 Introduction (Page No. - 15)
1.1 Objectives of the Study
1.2 Market Definition
1.3 Market Scope
1.3.1 Market Segmentation
1.4 Years Considered for the Study
1.5 Currency
1.6 Stakeholders
2 Research Methodology (Page No. - 18)
2.1 Research Data
2.1.1 Secondary Data
2.1.2 Primary Data
2.1.2.1 Breakdown of Primaries
2.1.2.2 Key Industry Insights
2.2 Market Size Estimation
2.3 Research Assumptions
2.4 Limitations
3 Executive Summary (Page No. - 25)
4 Premium Insights (Page No. - 30)
4.1 Attractive Opportunities in the Dark Analytics Market
4.2 North America: Market By Component
4.3 Europe: Market By Business Application
4.4 Asia Pacific: Market By Deployment Mode
4.5 Rest of the World: Market By Vertical
4.6 Market By Vertical & Region
5 Market Overview and Industry Trends (Page No. - 34)
5.1 Introduction
5.2 Market Dynamics
5.2.1 Drivers
5.2.1.1 Rapid Growth in Data Generated By Organizations Due to Increasing Adoption of Iot
5.2.1.2 Adoption of Artificial Intelligence and Machine Learning for Dark Data Analysis
5.2.1.3 Dark Data Solutions Enhancing Organizational Return on Investment
5.2.2 Restraints
5.2.2.1 Non-Uniformity of Data
5.2.3 Opportunities
5.2.3.1 Increasing Investments in Dark Analytics Technology By SMEs
5.2.4 Challenges
5.2.4.1 Limited Number of Affordable Dark Analytics Management and Consulting Firms
5.2.4.2 Presence of Skill Gap in the Market
5.3 Industry Trends
5.3.1 Introduction
5.3.2 Data Classification
5.3.3 Case Studies
5.3.3.1 Case Study 1: Globalia Implemented Datumize’s Dark Analytics Solutions to Streamline Revenue and Service Level
5.3.3.2 Case Study 2: Etstur Used Datameer’s Solutions to Personalize Customer Experience
5.3.3.3 Case Study 3: Airline Company Drives Sales and Increases Revenue Through Datumize’s Solutions
5.3.3.4 Case Study 4: A Global Bank Used the Pendo Data Platform to Uncover Its Dark Data
6 Dark Analytics Market, By Component (Page No. - 40)
6.1 Introduction
6.2 Solutions
6.3 Services
6.3.1 Consulting & System Integration
6.3.2 Training & Support
6.3.3 Managed Services
7 Market By Deployment Mode (Page No. - 44)
7.1 Introduction
7.2 Cloud
7.3 On-Premises
8 Market By Business Application (Page No. - 47)
8.1 Introduction
8.2 Marketing
8.3 Operations
8.4 Finance
8.5 Human Resources
9 Dark Analytics Market, By Vertical (Page No. - 53)
9.1 Introduction
9.2 Retail & E-Commerce
9.3 BFSI
9.4 Healthcare
9.5 Travel & Hospitality
9.6 Government
9.7 Telecommunication
9.8 Others
10 Regional Analysis (Page No. - 62)
10.1 Introduction
10.2 North America
10.2.1 US
10.2.2 Canada
10.3 Europe
10.3.1 UK
10.3.2 Germany
10.3.3 Rest of Europe
10.4 Asia Pacific
10.4.1 China
10.4.2 Australia
10.4.3 Japan
10.4.4 Rest of Asia Pacific
10.5 Rest of the World
11 Competitive Landscape (Page No. - 76)
11.1 Overview
11.2 Competitive Scenario
11.2.1 New Product Launches
11.2.2 Business Expansions
11.2.3 Mergers & Acquisitions
11.2.4 Agreements & Partnerships
11.3 Market Ranking Analysis for the Dark Analytics Market
12 Company Profiles (Page No. - 81)
(Business Overview, Products & Services, Key Insights, Recent Developments, SWOT Analysis, MnM View)*
12.1 IBM
12.2 SAP SE
12.3 Amazon Web Services
12.4 Micro Focus
12.5 Dell EMC
12.6 Microsoft
12.7 AvePoint
12.8 Teradata
12.9 Symantec
12.1 Datameer
12.11 IRI
12.12 SAS Institute
12.13 Commvault
12.14 Veritas
12.15 Cohesity
12.16 Datumize
12.17 SynerScope
12.18 Key Innovators
12.18.1 Komprise
12.18.2 Lattice
12.18.3 Quantta Analytics
12.18.4 Zoomdata
12.18.5 Formcept
12.18.6 Globanet
12.18.7 Esdebe Consultancy
12.18.8 Levi, Ray & Shoup
*Details on Business Overview, Products & Services, Key Insights, Recent Developments, SWOT Analysis, MnM View Might Not Be Captured in Case of Unlisted Companies.
13 Appendix (Page No. - 117)
13.1 Key Insights From Industry Experts
13.2 Discussion Guide
13.3 Knowledge Store: Marketsandmarkets’ Subscription Portal
13.4 Available Customizations
13.5 Related Reports
13.6 Author Details
List of Tables (46 Tables)
Table 1 Dark Analytics Market Size, By Component, 2016-2023 (USD Million)
Table 2 Dark Analytics Solutions Market Size, By Region, 2016-2023 (USD Million)
Table 3 Dark Analytics Services Market Size, By Region, 2016-2023 (USD Million)
Table 4 Dark Analytics Market Size, By Deployment Mode, 2016–2023 (USD Million)
Table 5 Cloud: Market Size By Region, 2016–2023 (USD Million)
Table 6 On-Premises: Market Size By Region, 2016–2023 (USD Million)
Table 7 Dark Analytics Market Size, By Business Application, 2016-2023 (USD Million)
Table 8 Marketing: Market Size By Region, 2016-2023 (USD Million)
Table 9 Operations: Market Size By Region, 2016-2023 (USD Million)
Table 10 Finance: Market Size By Region, 2016-2023 (USD Million)
Table 11 Hr: Market Size By Region, 2016-2023 (USD Million)
Table 12 Dark Analytics Market Size, By Vertical, 2016-2023 (USD Million)
Table 13 Retail & E-Commerce: Market Size By Region, 2016-2023 (USD Million)
Table 14 BFSI: Market Size By Region, 2016-2023 (USD Million)
Table 15 Healthcare: Market Size By Region, 2016-2023 (USD Million)
Table 16 Travel & Hospitality: Market Size By Region, 2016-2023 (USD Million)
Table 17 Government: Market Size By Region, 2016-2023 (USD Million)
Table 18 Telecommunication: Market Size By Region, 2016-2023 (USD Million)
Table 19 Other Verticals: Market Size By Region, 2016-2023 (USD Million)
Table 20 Dark Analytics Market Size, By Region, 2016-2023 (USD Million)
Table 21 North America: Market Size By Country, 2016–2023 (USD Million)
Table 22 North America: Market Size By Component, 2016–2023 (USD Million)
Table 23 North America: Market Size By Business Application, 2016–2023 (USD Million)
Table 24 North America: Market Size By Deployment Mode, 2016–2023 (USD Million)
Table 25 North America: Market Size By Vertical, 2016–2023 (USD Million)
Table 26 Europe: Dark Analytics Market Size, By Country, 2016–2023 (USD Million)
Table 27 Europe: Market Size By Component, 2016–2023 (USD Million)
Table 28 Europe: Market Size By Business Application, 2016–2023 (USD Million)
Table 29 Europe: Market Size By Deployment Mode, 2016–2023 (USD Million)
Table 30 Europe: Market Size By Vertical, 2016–2023 (USD Million)
Table 31 Asia Pacific: Dark Analytics Market Size, By Country, 2016–2023 (USD Million)
Table 32 Asia Pacific: Market Size By Component, 2016–2023 (USD Million)
Table 33 Asia Pacific: Market Size By Business Application, 2016–2023 (USD Million)
Table 34 Asia Pacific: Market Size By Deployment Mode, 2016–2023 (USD Million)
Table 35 Asia Pacific: Market Size By Vertical, 2016–2023 (USD Million)
Table 36 Rest of the World: Dark Analytics Market Size, By Country, 2016–2023 (USD Million)
Table 37 Rest of the World: Market Size By Component, 2016–2023 (USD Million)
Table 38 Rest of the World: Market Size By Business Application, 2016–2023 (USD Million)
Table 39 Rest of the World: Market Size By Deployment Mode, 2016–2023 (USD Million)
Table 40 Rest of the World: Market Size By Vertical, 2016–2023 (USD Million)
Table 41 Market Evaluation Framework
Table 42 New Product Launches, 2015–2018
Table 43 Business Expansions, 2017–2018
Table 44 Mergers & Acquisitions, 2017-2018
Table 45 Agreements & Partnerships, 2016–2018
Table 46 Market Ranking, 2017
List of Figures (36 Figures)
Figure 1 Dark Analytics Market: Research Design
Figure 2 Breakdown of Primary Interview: By Company Type, Designation, and Region
Figure 3 Data Triangulation
Figure 4 Market Size Estimation Methodology: Bottom-Up Approach
Figure 5 Market Size Estimation Methodology: Top-Down Approach
Figure 6 Assumptions
Figure 7 Dark Analytics Market, By Component, 2018 & 2023 (USD Million)
Figure 8 Market By Deployment Mode, 2018 & 2023 (USD Million)
Figure 9 Market By Business Application, 2018 & 2023 (USD Million)
Figure 10 Market By Vertical, 2018 & 2023 (USD Million)
Figure 11 Market in Asia Pacific Expected to Grow at the Highest CAGR During the Forecast Period
Figure 12 Increasing Amount of Dark Data is Driving the Growth of the Dark Analytics Market
Figure 13 The Solutions Component Segment Projected to Lead the North America Market During the Forecast Period
Figure 14 The Marketing Business Application Segment Projected to Lead the Europe Market During the Forecast Period
Figure 15 The Cloud Deployment Mode Segment Expected to Lead the Asia Pacific Market During the Forecast Period
Figure 16 The Healthcare Vertical Segment Projected to Lead the RoW Market By 2023
Figure 17 North America Estimated to Account for the Largest Share of theMarket in 2018
Figure 18 Dark Analytics Market: Drivers, Restraints, Opportunities, and Challenges
Figure 19 Data Types
Figure 20 The Solutions Component Segment Projected to Lead the Dark Analytics Market During the Forecast Period
Figure 21 The On-Premises Deployment Mode Segment Projected to Grow at A Higher CAGR as Compared to the Cloud Segment During the Forecast Period
Figure 22 Market By Business Application, 2018 & 2023 (USD Million)
Figure 23 Market By Vertical, 2018-2023 (USD Million)
Figure 24 North America Projected to Lead the Dark Analytics Market From 2018 to 2023
Figure 25 North America Market Snapshot
Figure 26 Asia Pacific Market Snapshot
Figure 27 Companies Majorly Adopted the New Product Launch Strategy Between March 2015 and May 2018
Figure 28 IBM: Company Snapshot
Figure 29 SAP SE: Company Snapshot
Figure 30 Amazon Web Services: Company Snapshot
Figure 31 Micro Focus: Company Snapshot
Figure 32 Microsoft: Company Snapshot
Figure 33 Teradata: Company Snapshot
Figure 34 Symantec: Company Snapshot
Figure 35 SAS Institute: Company Snapshot
Figure 36 Commvault: Company Snapshot


Growth opportunities and latent adjacency in Dark Analytics Market