Customer Relationship Management (CRM) Market & Social CRM (Social Monitoring; Social Listening; Social Mapping; Social Measurements; Social Engagement; Social Middleware) � Global Advancements, Forecasts & Analysis (2013 � 2018)


[248 Pages Report] MarketsandMarkets expects the social Customer Relationship Management market to grow from $1.91 billion in 2013 to $9.08 billion in 2018, at a CAGR of 36.5% from 2013 to 2018.
Customer Relationship Management has become a vital part for various functions across global enterprises. Advancements in Social CRM have made it faster, reachable and have also brought in vital information on business analytics. Enterprises are adopting social CRM as an additional channel in the overall CRM software solutions. Social CRM refers to a social layer on top of tradition CRM software solutions; these solutions provide enterprises with several advantages including increased transparency, better communication of business ideas and information, flexibility and performance. Social CRM helps companies to establish customer engagements and increase their brand presence among customers. Social CRM focuses on capturing the customers need and creating value for them in a transparent business environment.
Major forces driving this market are the rising focus on customer engagement, emerging SMEs, social platforms and the recognition of sharing ideas on a real time basis. Enterprises are coming up with solutions for Social Monitoring, Social Listening, Social Middleware, Social Management and Social Measurement for providing the best in class customer experience to the customers. Today, Customer Relationship Management market is not limited only for increasing sales and improving marketing activities, but to bring in more customer engagement with the enterprises.
Some of the major vendors are SAP, Oracle, Salesforce.com, Amdocs and IBM. Companies such as Lithium and Jive Inc. are moving towards Social Customer Relationship Management market and many others have ventured into it as well. MarketsandMarkets believes that the need for increasing enterprise customer relationship management market needs, along with social media boom is playing a pivotal role in shaping the future of emerging social CRM software. Social CRM solutions are bringing enterprises closer to their customers by utilizing the prevailing social platforms.
This research report categorizes the customer relationship management market & Social Customer Relationship Management market for forecasting the revenues and analyzing the trends in each of the following sub-markets:
Applications:
- Marketing
- Sales
- Customer support & service
- Others
Deployment Type:
- On Demand (SaaS and PaaS)
- On Premise
- Hybrid
Solutions:
- Social Monitoring
- Social Mapping
- Social Middleware
- Social Management
- Social Measurement
Users:
- Small & Medium Businesses (SMB)
- Enterprises
Verticals:
- Academia & Government
- Automotive, Transportation and Logistics
- BFSI
- Consumer Goods and Retail
- Energy, Power and Utilities
- Healthcare
Customer Interested in this report also can view
-
Social Customer Relationship Management (CRM) Market - Solution (Social Monitoring, Social Listening, Social Mapping, Social Measurements, Social Engagement, Social Middleware), by Deployment (Hosted, On Premise) � Global Forecasts to 2019
Customer Relationship Management (CRM) solutions are gaining pace in the current enterprise ecosystem. With the boom of social media, enterprises are adopting social integration with CRM software as well, thus making way for social CRM as a new channel now days. Social CRM solutions combine traditional CRM solutions with social media for improving the customer engagement for enterprises. The solution provides a social platform for evolving businesses CRM needs, while also offering flexibility, in terms of reach, deployment, and administration. Social CRM incorporates the customer decisions into the planning mix and the feedback loop so as to engage customers with the enterprises.
Enterprises are coming up with solutions for Social Monitoring, Social Listening, Social Middleware, Social Management and Social Measurement for providing the best in class customer experience to the customers. Today, Customer Relationship Management is not limited only for increasing sales and improving marketing activities, but to bring in better customer engagement with the enterprises.
MarketsandMarkets expects that, investments in social CRM will increase across geographies and verticals, with the need of more business specific solutions for enterprises. These solutions will put together customer data from all sources with the enterprises. It is expected that, these solutions will move beyond marketing and sales functions into customer facing departments, improving brand value through better communications and seamless connectivity across all departments.
MarketsandMarkets expects the social Customer Relationship Management market to grow from $1.91 billion in 2013 to $9.08 billion in 2018, at a CAGR of 36.5% from 2013 to 2018.
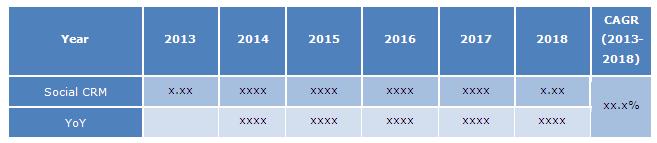
Source: MarketsandMarkets Analysis
MarketsandMarkets expects the Customer Relationship Management market to grow from $17.19 billion in 2013 to $24.22 billion in 2018, at a CAGR of 7.1% from 2013 to 2018.
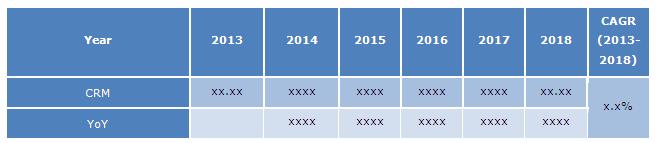
Source: MarketsandMarkets Analysis
 Exclusive indicates content/data unique to MarketsandMarkets and not available with any competitors.
Table Of Contents
1 Introduction (Page No. - 22)
1.1 Research Overview
1.1.1 Purpose And Scope
1.1.2 Report Description
1.1.3 Key Take-Aways
1.2 Research Methodology
1.2.1 Secondary And Primary Research
1.2.2 Data Triangulation And Forecasting
1.2.3 Forecast Assumptions
1.3 Market Overview
1.3.1 Markets Covered
1.3.2 Segment Definitions
1.3.3 Industry Trends
1.3.3.1 Social Media Integration Across CRM Software
1.3.3.2 Emerging SMBS
1.3.3.3 Hosted CRM Software Gaining Increased Adoption
2 Executive Summary (Page No. - 31)
2.1 Abstract
2.2 Overall Market Size � CRM
2.3 Overall Market Size � Social CRM
3 Customer Relationship Management Market Ecosystem And Dynamics (Page No. - 34)
3.1 Market Ecosystem
3.1.1 Mapping Trends
3.1.2 Market Players And Roles
3.2 Market Dynamics
3.2.1 Drivers
3.2.1.1 Focus On Customer Engagement
3.2.1.2 Emerging SMES
3.2.1.3 Simplicity Of CRM Products And Services
3.2.2 Restraints And Challenges
3.2.2.1 Security And Privacy
3.2.2.2 Enterprise Readiness
3.2.3 Opportunities
3.2.3.1 Solutions For Business Specific Problems
3.2.3.2 Bring Your Own Device (BYOD) Ecosystem
3.2.4 Time Impact Analysis Of Dynamics
4 Customer Relationship Management Market Size And Forecast By Application (Page No. - 42)
4.1 Overview And Introduction
4.2 Customer Service And Support
4.2.1 Overview
4.2.2 Market Size And Forecast By Region
4.2.3 Market Size And Forecast By Vertical
4.2.4 Market Size And Forecast By Deployment
4.3 Marketing
4.3.1 Overview
4.3.2 Market Size And Forecast By Region
4.3.3 Market Size And Forecast By Vertical
4.3.4 Market Size And Forecast By Deployment
4.4 Sales
4.4.1 Overview
4.4.2 Market Size And Forecast By Region
4.4.3 Market Size And Forecast By Vertical
4.4.4 Market Size And Forecast By Deployment
4.5 Other Applications (Innovations, Collaboration, Customer Experience)
4.5.1 Overview
4.5.2 Market Size And Forecast By Region
4.5.3 Market Size And Forecast By Vertical
4.5.4 Market Size And Forecast By Deployment
5 Customer Relationship Management Market Size And Forecast By Deployment Types (Page No. - 77)
5.1 Overview And Introduction
5.2 Hosted
5.2.1 Overview
5.2.2 Market Size And Forecast By Region� CRM
5.2.3 Market Size And Forecast By Vertical � CRM
5.2.4 Market Size And Forecast By Region � Social CRM
5.2.5 Market Size And Forecast By Vertical� Social CRM
5.3 On-Premise
5.3.1 Overview
5.3.2 Market Size And Forecast By Region � Customer Relationship Management
5.3.3 Market Size And Forecast By Vertical � CRM
5.3.4 Market Size And Forecast By Region � Social CRM
5.3.5 Market Size And Forecast By Vertical � Social CRM
5.4 Hybrid
5.4.1 Overview
5.4.2 Market Size And Forecast By Region � Customer Relationship Management
5.4.3 Market Size And Forecast By Vertical � CRM
5.4.4 Market Size And Forecast By Region � Social CRM
5.4.5 Market Size And Forecast By Vertical � Social CRM
6 Social Customer Relationship Management Market Size And Forecast By Solutions (Page No. - 112)
6.1 Overview And Introduction
6.2 Social Monitoring And Social Listening
6.2.1 Overview
6.2.2 Market Size And Forecast By Region
6.3 Social Mapping
6.3.1 Overview
6.3.2 Market Size And Forecast By Region
6.4 Social Middleware
6.4.1 Overview
6.4.2 Market Size And Forecast By Region
6.5 Social Management
6.5.1 Overview
6.5.2 Market Size And Forecast By Region
6.6 Social Measurement
6.6.1 Overview
6.6.2 Market Size And Forecast By Region
7 Customer Relationship Management Market Size And Forecast By End-Users (Page No. - 129)
7.1 Market Analysis By Verticals
7.1.1 Overview And Introduction
7.1.2 Academia And Government
7.1.2.1 Overview
7.1.2.2 Market Size And Forecast By Deployment
7.1.3 Automotive, Transportation And Logistics
7.1.3.1 Overview
7.1.3.2 Market Size And Forecast By Deployment
7.1.4 Banking , Financial Services And Insurance (BFSI)
7.1.4.1 Overview
7.1.4.2 Market Size And Forecast By Deployment
7.1.5 Consumer Goods And Retail
7.1.5.1 Overview
7.1.5.2 Market Size And Forecast By Deployment
7.1.6 Energy, Power And Utilities
7.1.6.1 Overview
7.1.6.2 Market Size And Forecast By Deployment
7.1.7 Healthcare
7.1.7.1 Overview
7.1.7.2 Market Size And Forecast By Deployment
7.1.8 Oil And Gas
7.1.8.1 Overview
7.1.8.2 Market Size And Forecast By Deployment
7.1.9 Telecom And It
7.1.9.1 Overview
7.1.9.2 Market Size And Forecast By Deployment
7.2 Market Analysis By Company Size
7.2.1 Overview And Introduction
7.2.2 Small And Medium Businesses (SMB)
7.2.2.1 Overview
7.2.2.2 Market Size And Forecast By Region
7.2.3 Enterprises
7.2.3.1 Overview
7.2.3.2 Market Size And Forecast By Region
8 Customer Relationship Management Market Size And Forecast By Regions (Page No. - 158)
8.1 Overview And Introduction
8.1.1 Parfait Charts
8.2 North America
8.2.1 Overview
8.2.2 Market Size And Forecast By Solutions
8.3 Europe
8.3.1 Overview
8.3.2 Market Size And Forecast By Solutions
8.4 Asia-Pacific And Japan (APAC)
8.4.1 Overview
8.4.2 Market Size And Forecast By Solutions
8.5 Middle East And Africa (MEA)
8.5.1 Overview
8.5.2 Market Size And Forecast By Solutions
8.6 Latin America (LA)
8.6.1 Overview
8.6.2 Market Size And Forecast By Solutions
9 Customer Relationship Management Market Analysis, Trends And Insights (Page No. - 176)
9.1 Market Evolution
9.1.1 Market Uptake And Disruption
9.1.2 Lifecycle And Chasm Plots
9.2 Go To Market And Trends
9.2.1 Go To Market Strategy
9.2.2 Adoption Roadmaps
10 Competitive Landscape (Page No. - 181)
10.1 Portfolio Comparison
10.1.1 Overview
10.1.2 Product Category Mapping
10.2 Venture Capital (VC) Funding Analysis
10.2.1 Overview
10.2.2 Capital Funding Trends
10.3 Mergers And Acquisitions (M&A)
10.4 Social Reach
10.4.1 Social Trends
11 Company Profiles (MnM View, Overview, Products & Services, Financials, SWOT And Strategy & Analyst Insights)* (Page No. - 190)
11.1 Acquia
11.2 Amdocs
11.3 IBM
11.4 Jive Software
11.5 Lithium
11.6 Microsoft
11.7 Netsuite
11.8 Nimble
11.9 Oracle
11.10 Pegasystems
11.11 Ramco Systems
11.12 SAGE
11.13 Salesforce
11.14 SAP
11.15 Sugarcrm
11.16 Key Innovators
11.16.1 Allegiance
11.16.2 Contactually
11.16.3 ITC Infotech
11.16.4 Nearstream
11.16.5 Nextprinciples
11.16.6 Tracx
List Of Tables (142 Tables)
Table 1 Forecast Assumptions
Table 2 Overall Customer Relationship Management Market Size, 2013 � 2018 ($Billion)
Table 3 Overall Social CRM Market Size, 2013 � 2018 ($Billion)
Table 4 Time Impact Analysis Of Dynamics
Table 5 Customer Relationship Management Market Size, By Application, 2013 � 2018 ($Billion)
Table 6 Market Size, By Application, By Proportion,2013 � 2018 (Y-O-Y %)
Table 7 Market Size, By Application, 2013 � 2018 (Y-O-Y %)
Table 8 Market Size, By Customer Service And Support, By Region, 2013 � 2018 ($Million)
Table 9 Market Size, By Customer Service And Support, By Vertical, 2013 � 2018 ($Million)
Table 10 CRM Market Size, By Customer Service And Support, By Vertical, 2013 � 2018 (Y-O-Y %)
Table 11 Customer Relationship Management Market Size, By Customer Service And Support, By Deployment, 2013 � 2018 ($Billion)
Table 12 Market Size, By Customer Service And Support, By Deployment, 2013 � 2018 (Y-O-Y %)
Table 13 Market Size, By Marketing, By Region,2013 � 2018 ($Million)
Table 14 Market Size, By Marketing, By Region,2013 � 2018 (Y-O-Y %)
Table 15 Market Size, By Marketing, By Vertical,2013 � 2018 ($Million)
Table 16 Market Size, By Marketing, By Vertical,2013 � 2018 (Y-O-Y %)
Table 17 Market Size, By Marketing, By Deployment,2013 � 2018 ($Billion)
Table 18 Market Size, By Marketing, By Deployment,2013 � 2018 (Y-O-Y %)
Table 19 Customer Relationship Management Market Size, By Sales, By Region, 2013 � 2018 ($Million)
Table 20 Market Size, By Sales, By Region, 2013 � 2018 (Y-O-Y %)
Table 21 Market Size, By Sales, By Vertical, 2013 � 2018 ($Million)
Table 22 Market Size, By Sales, By Vertical, 2013 � 2018 (Y-O-Y %)
Table 23 Market Size, By Sales, By Deployment,2013 � 2018 ($Billion)
Table 24 Market Size, By Sales, By Deployment,2013 � 2018 (Y-O-Y %)
Table 25 Customer Relationship Management Market Size, By Other Applications,2013 � 2018 ($Billion)
Table 26 Market Size, By Other Applications, 2013 � 2018 (Y-O-Y %)
Table 27 Market Size, By Other Applications, By Region,2013 � 2018 ($Million)
Table 28 Market Size, By Other Applications, By Region,2013 � 2018 (Y-O-Y %)
Table 29 Market Size, By Other Applications, By Vertical,2013 � 2018 ($Million)
Table 30 Market Size, By Other Applications, By Vertical,2013 � 2018 (Y-O-Y %)
Table 31 Market Revenue By Other Applications, By Deployment, 2013 � 2018 ($Billion)
Table 32 Market Size, By Other Applications, By Deployment,2013 � 2018 (Y-O-Y %)
Table 33 Customer Relationship Management Market Size, By Type Of Deployment, 2013 � 2018 ($Billion)
Table 34 Social CRM Market Size, By Type Of Deployment,2013 � 2018 ($Billion)
Table 35 Market Size, By Type Of Deployment, 2013 � 2018 (Y-O-Y %)
Table 36 Social CRM Market Size, By Type Of Deployment,2013 � 2018 (Y-O-Y %)
Table 37 Customer Relationship Management Market Size, By Hosted, By Region,2013 � 2018 ($Million)
Table 38 Market Size, By Hosted, By Region, 2013 � 2018 (Y-O-Y %)
Table 39 Market Size, By Hosted, By Vertical,2013 � 2018 ($Million)
Table 40 Market Size, By Hosted, By Vertical, 2013 � 2018 (Y-O-Y %)
Table 41 Social CRM Market Size, By Hosted, By Region,2013 � 2018 ($Million)
Table 42 Market Size, By Hosted, By Region,2013 � 2018 (Y-O-Y %)
Table 43 Market Size, By Hosted, By Vertical,2013 � 2018 ($Million)
Table 44 Market Size, By Hosted, By Vertical,2013 � 2018 (Y-O-Y %)
Table 45 Customer Relationship Management Market Size, By On-Premise, By Region,2013 � 2018 ($Million)
Table 46 Market Size, By On-Premise, By Region,2013 � 2018 (Y-O-Y %)
Table 47 Market Size, By On-Premise, By Vertical,2013 � 2018 ($Million)
Table 48 Market Size, By On-Premise, By Vertical,2013 � 2018 (Y-O-Y %)
Table 49 Social CRM Market Size, By On-Premise, By Region,2013 � 2018 ($Million)
Table 50 Market Size, By On-Premise, By Region,2013 � 2018 (Y-O-Y %)
Table 51 Market Size, By On-Premise, By Vertical,2013 � 2018 ($Million)
Table 52 Market Size, By On-Premise, By Vertical,2013 � 2018 (Y-O-Y %)
Table 53 CRM Market Size, By Hybrid, By Region, 2013 � 2018 ($Million)
Table 54 Market Size, By Hybrid, By Region, 2013 � 2018 (Y-O-Y %)
Table 55 Customer Relationship Management Market Size, By Hybrid, By Vertical, 2013 � 2018 ($Million)
Table 56 Market Size, By Hybrid, By Vertical, 2013 � 2018 (Y-O-Y %)
Table 57 Social CRM Market Size, By Hybrid, By Region,2013 � 2018 ($Million)
Table 58 Market Size, By Hybrid, By Region,2013 � 2018 (Y-O-Y %)
Table 59 Market Size, By Hybrid, By Vertical,2013 � 2018 ($Million)
Table 60 Market Size, By Hybrid, By Vertical,2013 � 2018 (Y-O-Y %)
Table 61 Social CRM Market Size, By Solutions, 2013 � 2018 ($Million)
Table 62 Customer Relationship Management Market Size, By Solutions, By Proportion,2013 � 2018 (%)
Table 63 Market Size, By Software Solutions,2013 � 2018 (Y-O-Y %)
Table 64 Social CRM Market Size, By Social Monitoring And Social Listening, By Region, 2013 � 2018 ($Million)
Table 65 Market Size, By Social Monitoring And Social Listening, By Region, 2013 � 2018 (Y-O-Y %)
Table 66 Market Size, By Social Mapping, By Region,2013 � 2018 ($Million)
Table 67 Market Size, By Social Mapping, By Region,2013 � 2018 (Y-O-Y %)
Table 68 Customer Relationship Management Market Size, By Social Middleware, By Region, 2013 � 2018 ($Million)
Table 69 Market Revenue By Social Middleware, By Region, 2013 � 2018 (Y-0-Y %)
Table 70 Market Revenue By Social Management, By Region, 2013 � 2018 ($Million)
Table 71 Market Size, By Social Management, By Region, 2013 � 2018 (Y-O-Y %)
Table 72 Market Size, By Social Measurement, By Region, 2013 � 2018 ($Million)
Table 73 Market Size, By Social Measurement, By Region, 2013 � 2018 (Y-O-Y %)
Table 74 Social CRM Market Size, By Verticals, 2013 � 2018 ($Million)
Table 75 Market Size, By Verticals, By Proportion,2013 � 2018 (%)
Table 76 Market Size, By Verticals, 2013 � 2018 (Y-O-Y %)
Table 77 Social CRM Market Revenue By Academia And Government, By Deployment, 2013 � 2018 ($Million)
Table 78 Customer Relationship Management Market Revenue By Academia And Government, By Deployment, 2013 � 2018 (Y-O-Y %)
Table 79 Market Size, By Automotive, Transportation And Logistics, By Deployment, 2013 � 2018 ($Million)
Table 80 Market Size, By Automotive, Transportation And Logistics, By Deployment, 2013 � 2018 (Y-O-Y %)
Table 81 Social CRM Market Revenue By BFSI, By Deployment,2013 � 2018 ($Million)
Table 82 Market Revenue By BFSI, By Deployment,2013 � 2018 (Y-O-Y %)
Table 83 Market Size, By Consumer Goods And Retail, By Deployment, 2013 � 2018 ($Million)
Table 84 Market Size, By Consumer Goods And Retail, By Deployment, 2013 � 2018 (Y-O-Y %)
Table 85 Market Size, By Energy, Power And Utilities, By Deployment, 2013 � 2018 ($Million)
Table 86 Market Size, By Energy, Power And Utilities, By Deployment, 2013 � 2018 (Y-O-Y %)
Table 87 Social CRM Market Size, By Healthcare, By Deployment,2013 � 2018 ($Million)
Table 88 Market Size, By Healthcare, By Deployment,2013 � 2018 (Y-O-Y %)
Table 89 Social CRM Market Size, By Oil And Gas, By Deployment,2013 � 2018 ($Million)
Table 90 Market Size, By Oil And Gas, By Deployment,2013 � 2018 (Y-O-Y %)
Table 91 Market Size, By Telecom And IT, By Deployment, 2013 � 2018 ($Million)
Table 92 Market Size, By Telecom And IT, By Deployment, 2013 � 2018 (Y-O-Y %)
Table 93 Social CRM Market Size, By Company Size,2013 � 2018 ($Million)
Table 94 Market Revenue By Company Size, By Proportion, 2013 � 2018 (%)
Table 95 Market Size, By Company Size, 2013 � 2018 (Y-O-Y %)
Table 96 Customer Relationship Management Market Revenue By SMB, By Region,2013 � 2018 ($Million)
Table 97 Market Size, By SMB, By Region,2013 � 2018 (Y-O-Y %)
Table 98 Market Size, By Enterprise, By Region,2013 � 2018 ($Million)
Table 99 Market Size, By Enterprise, By Region,2013 � 2018 (Y-O-Y %)
Table 100 Market Size, By Regions, 2013 � 2018 ($Million)
Table 101 Market Size, By Regions, By Proportion,2013 � 2018 (%)
Table 102 Customer Relationship Management Market Size, By Regions, 2013 � 2018 (Y-O-Y %)
Table 103 Market Size, By North America, By Solutions,2013 � 2018 ($Million)
Table 104 Social Market Size, By North America, By Solutions,2013 � 2018 (Y-O-Y %)
Table 105 Social CRM Market Size, By Europe, By Solutions,2013 � 2018 ($Million)
Table 106 Social Market Size, By Europe, By Solutions,2013 � 2018 (Y-O-Y %)
Table 107 Social CRM Market Size, By APAC, By Solutions,2013 � 2018 ($Million)
Table 108 Social Market Size, By APAC, By Solutions,2013 � 2018 (Y-O-Y %)
Table 109 Social CRM Market Size, By Mea, By Solutions,2013 � 2018 ($Million)
Table 110 Social Market Size, By Mea, By Solutions,2013 � 2018 (Y-O-Y %)
Table 111 Social CRM Market Size, By Latin America, By Solutions,2013 � 2018 ($Million)
Table 112 Social Market Size, By Latin America, By Solutions,2013 � 2018 (Y-O-Y %)
Table 113 Customer Relationship Management Market Venture Capital (VC) Funding
Table 114 CRM Market Mergers And Acquisitions (M&A)
Table 115 Amdocs: Revenue, 2011 � 2012 ($Million)
Table 116 Amdocs: Revenue By Region, 2011 � 2012 ($Million)
Table 117 IBM: Revenue, 2011 � 2012 ($Million)
Table 118 IBM: Revenue By Segment, 2011 � 2012 ($Million)
Table 119 IBM: Revenue By Region, 2011 � 2012 ($Million)
Table 120 Jive Software: Revenue, 2011 � 2012 ($Million)
Table 121 Jive Software: Revenue By Segment, 2011 � 2012 ($Million)
Table 122 Microsoft: Revenue, 2011 � 2012 ($Million)
Table 123 Microsoft: Revenue By Segment, 2011 � 2012 ($Million)
Table 124 Microsoft: Revenue By Region, 2011 � 2012 ($Million)
Table 125 Netsuite: Revenue, 2011 � 2012 ($Million)
Table 126 Netsuite: Revenue By Segment, 2011 � 2012 ($Million)
Table 127 Netsuite: Revenue, By Region, 2011 � 2012 ($Million)
Table 128 Oracle: Revenue, 2011 � 2012 ($Million)
Table 129 Oracle: Revenue By Segment, 2011 � 2012 ($Million)
Table 130 Oracle: Revenue By Region, 2011 � 2012 ($Million)
Table 131 Pegasystems: Revenue, 2011 � 2012 ($Million)
Table 132 Ramco Systems: Revenue, 2011 � 2012 ($Million)
Table 133 Ramco Systems: Revenue By Region, 2012 ($Million)
Table 134 Sage: Revenue, 2011 � 2012 ($Million)
Table 135 Sage: Revenue By Business Unit Segment,2011 � 2012 ($Million)
Table 136 Sage: Revenue By Region, 2011 � 2012 ($Million)
Table 137 Salesforce: Revenue, 2011 � 2012 ($Million)
Table 138 Salesforce: Revenue By Business Unit Segment,2011 � 2012 ($Million)
Table 139 Salesforce: Revenue By Region, 2011 � 2012 ($Million)
Table 140 Sap: Revenue, 2011 � 2012 ($Million)
Table 141 Sap: Revenue By Business Unit Segment, 2011 � 2012 ($Million)
Table 142 Sap: Revenue By Region, 2011 � 2012 ($Million)
List Of Figures (64 Figures)
Figure 1 Segment Definitions
Figure 2 Overall Customer Relationship Management Market Size,2013 � 2018 ($Billion)
Figure 3 Overall Social CRM Market Size, 2013 � 2018 ($Billion)
Figure 4 CRM And Social CRM Market Ecosystem
Figure 5 Market Players And Roles
Figure 6 CRM Market Size, By Application, 2013 � 2018 (Y-O-Y %)
Figure 7 Market Size, By Customer Service And Support, By Vertical, 2013 � 2018 (Y-O-Y %)
Figure 8 Customer Relationship Management Market Size, By Customer Service And Support, By Deployment, 2013 � 2018 (Y-O-Y %)
Figure 9 Market Size, By Marketing, By Region,2013 � 2018 (Y-O-Y %)
Figure 10 Market Size, By Marketing, By Vertical,2013 � 2018 (Y-O-Y %)
Figure 11 Market Size, By Marketing, By Deployment,2013 � 2018 (Y-O-Y %)
Figure 12 Customer Relationship Management Market Size, By Sales, By Region, 2013 � 2018 (Y-O-Y %)
Figure 13 Market Size, By Sales, By Vertical, 2013 � 2018 (Y-O-Y %)
Figure 14 Market Size, By Sales, By Deployment,2013 � 2018 (Y-O-Y %)
Figure 15 CRM Market Size, By Other Applications, 2013 � 2018 (Y-O-Y %)
Figure 16 Market Size, By Other Applications, By Region,2013 � 2018 (Y-O-Y %)
Figure 17 Customer Relationship Management Market Size, By Other Applications, By Vertical,2013 � 2018 (Y-O-Y %)
Figure 18 Market Size, By Other Applications, By Vertical,2013 � 2018 (Y-O-Y %)
Figure 19 CRM Market Size, By Type Of Deployment, 2013 � 2018 (Y-O-Y %)
Figure 20 Social CRM Market Size, By Type Of Deployment,2013 � 2018 (Y-O-Y %)
Figure 21 Market Size, By Hosted, By Region, 2013 � 2018 (Y-O-Y %)
Figure 22 Market Size, By Hosted, By Vertical, 2013 � 2018 (Y-O-Y %)
Figure 23 Social CRM Market Size, By Hosted, By Region,2013 � 2018 (Y-O-Y %)
Figure 24 Market Size, By Hosted, By Vertical,2013 � 2018 (Y-O-Y %)
Figure 25 CRM Market Size, By On-Premise, By Region,2013 � 2018 (Y-O-Y %)
Figure 26 Customer Relationship Management Market Size, By On-Premise, By Vertical,2013 � 2018 (Y-O-Y %)
Figure 27 Social CRM Market Size, By On-Premise, By Region,2013 � 2018 (Y-O-Y %)
Figure 28 Market Size, By On-Premise, By Vertical,2013 � 2018 (Y-O-Y %)
Figure 29 CRM Market Size, By Hybrid, By Region, 2013 � 2018 (Y-O-Y %)
Figure 30 Market Size, By Hybrid, By Vertical, 2013 � 2018 (Y-O-Y %)
Figure 31 Social CRM Market Size, By Hybrid, By Region,2013 � 2018 (Y-O-Y %)
Figure 32 Market Size, By Hybrid, By Vertical,2013 � 2018 (Y-O-Y %)
Figure 33 Social CRM Market Size, By Solutions, 2013 � 2018 (Y-O-Y %)
Figure 34 Market Size, By Social Monitoring And Social Listening, By Region, 2013 � 2018 (Y-O-Y %)
Figure 35 Customer Relationship Management Market Size, By Social Mapping, By Region,2013 � 2018 (Y-O-Y %)
Figure 36 Market Size, By Social Middleware, By Region, 2013 � 2018 (Y-0-Y %)
Figure 37 Market Size, By Social Management, By Region, 2013 � 2018 (Y-O-Y %)
Figure 38 Market Size, By Social Measurement, By Region, 2013 � 2018 (Y-O-Y %)
Figure 39 Social CRM Market Size, By Verticals, 2013 � 2018 (Y-O-Y %)
Figure 40 Market Revenue By Academia And Government, By Deployment, 2013 � 2018 (Y-O-Y %)
Figure 41 Market Size, By Automotive, Transportation And Logistics, By Deployment, 2013 � 2018 (Y-O-Y %)
Figure 42 Market Revenue By BFSI, By Deployment,2013 � 2018 (Y-O-Y %)
Figure 43 Market Size, By Consumer Goods And Retail, By Deployment, 2013 � 2018 (Y-O-Y %)
Figure 44 Customer Relationship Management Market Size, By Energy, Power And Utilities, By Deployment, 2013 � 2018 (Y-O-Y %)
Figure 45 Market Size, By Healthcare, By Deployment,2013 � 2018 (Y-O-Y %)
Figure 46 Market Size, By Oil And Gas, By Deployment,2013 � 2018 (Y-O-Y %)
Figure 47 Market Size, By Telecom And IT, By Deployment, 2013 � 2018 (Y-O-Y %)
Figure 48 Social CRM Market Size, By Company Size, 2013 � 2018 (Y-O-Y %)
Figure 49 Market Size, By SMB, By Region,2013 � 2018 (Y-O-Y %)
Figure 50 Customer Relationship Management Market Size, By Enterprise, By Region,2013 � 2018 (Y-O-Y %)
Figure 51 Parfait Charts Of Social CRM Market Size, By Region,2013 � 2018 ($Billion)
Figure 52 Social CRM Market Size, By Regions, 2013 � 2018 (Y-O-Y %)
Figure 53 Market Size, By North America, By Solutions,2013 � 2018 (Y-O-Y %)
Figure 54 Market Size, By Europe, By Solutions,2013 � 2018 (Y-O-Y %)
Figure 55 Market Size, By APAC, By Solutions,2013 � 2018 (Y-O-Y %)
Figure 56 Market Size, By MEA, By Solutions,2013 � 2018 (Y-O-Y %)
Figure 57 Market Size, By Latin America, By Solutions,2013 � 2018 (Y-O-Y %)
Figure 58 Evolution Of CRM Solutions
Figure 59 Customer Relationship Management Market Disruption
Figure 60 Social CRM Market Chasm Plot
Figure 61 Go To Market Strategy
Figure 62 Adoption Roadmaps
Figure 63 Portfolio Comparison
Figure 64 Social Trends


Growth opportunities and latent adjacency in Customer Relationship Management (CRM) Market
Analyse the market trends of Telecom parts/ components.
Need insights into Social CRM Market Size and trends for Emerging markets in Asia Pacific,ASEAN,Latin America,Middle East & africa regions.
Gather insights into CRM Based solutions, Sales Pipeline management, stock management and asset management using RFID etc.
Gather insights into Cloud applications, Social Media Monitoring, Big Data management and Analytics and Mobile applications.