Contrast Enhanced Ultrasound Market by Product (Equipment, Nanoparticle & Molecule-targeted Microbubbles, Software], Application (Diagnostic, Therapeutic, CVDs, Liver, Kidney, Oncology), End User (Hospital, Clinics, ASCs) & Region - Global Forecast to 2028
Updated on : September 24, 2024
Overview of the Contrast Enhanced Ultrasound Market
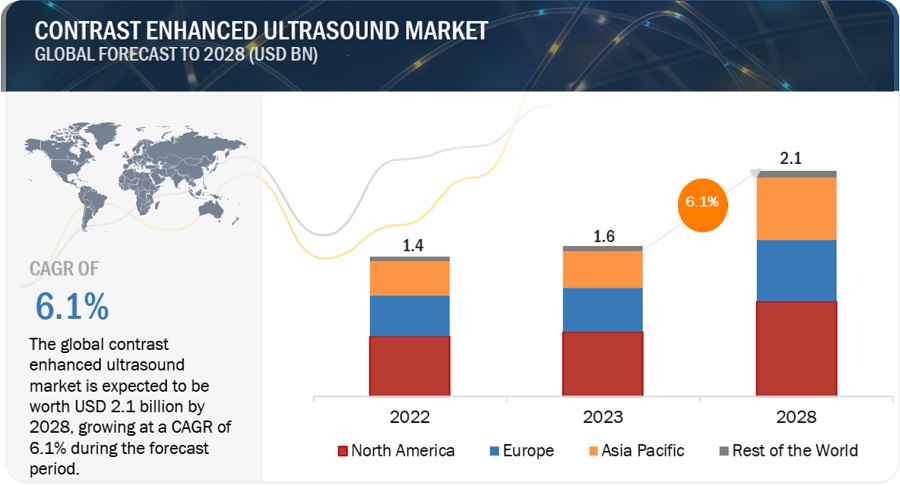
The global contrast enhanced ultrasound market, valued at US$1.4 billion in 2022, stood at US$1.6 billion in 2023 and is projected to advance at a resilient CAGR of 6.1% from 2023 to 2028, culminating in a forecasted valuation of US$2.1 billion by the end of the period. The rising use of contrast agents, increasing partnerships and collaborations, and the introduction of novel technologies are expected to drive the market during the forecast period. The technologically advanced systems come with improved features and higher sensitivity. The novel technology helps to gain accurate results and increases diagnostic confidence.
Global Contrast Enhanced Ultrasound Market
To know about the assumptions considered for the study, Request for Free Sample Report
e- Estimated; p- Projected
Contrast Enhanced Ultrasound Market Dynamics
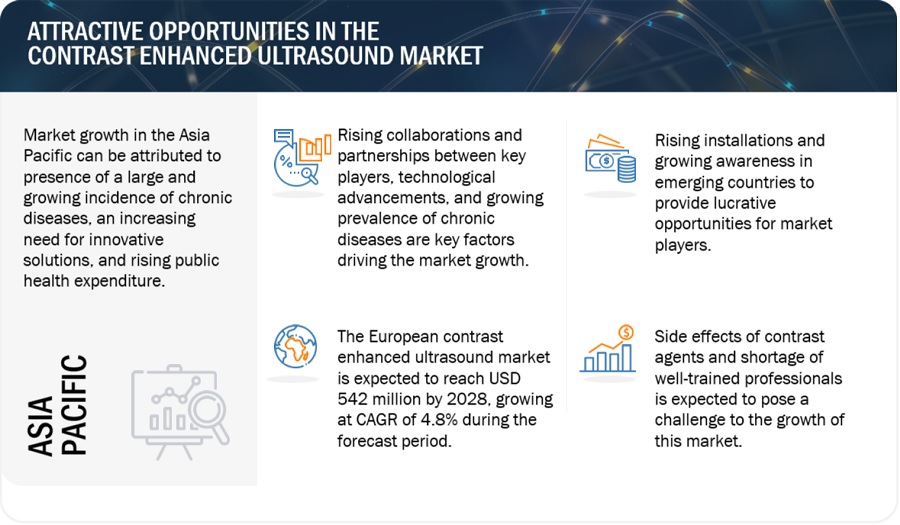
Driver: Rising prevalence of chronic diseases
The global burden of chronic diseases is consistently increasing. For example, the burden of cancer was expected to increase from 14.1 million new cases in 2012 to 19.3 million new cases in 2020 (Source: GLOBOCAN, 2020). According to the American Cancer Society, breast cancer is the second-leading cause of cancer-related deaths in women across the globe. In Canada, as many as 28,300 women were diagnosed with breast cancer in 2022, representing 25% of new cancer cases (Source: Canadian Cancer Society (Source: Canadian Cancer Society). It is projected that nearly 60% of individuals aged 65 and above in the US will be living with more than one chronic condition by 2030 (Source: American Medical Association). As contrast-enhanced ultrasound procedures are cost-effective, safer, and offer earlier diagnosis and treatment of target diseases, their demand in disease management is expected to increase during the forecast period.
Restraint: Side effects of contrast agents
Ultrasound contrast agents consist of microbubbles enclosed with gas and an exterior covered with a lipid shell. The enclosed gas is usually sulfur hexafluoride or perfluorinated, having density and low solubility. The use of contrast agents is restricted if the patient is hypersensitive to perfluoro. The use of contrast agents carries a risk for the occurrence of serious cardiopulmonary reactions. It may also lead to headache, nausea, vomiting, and dizziness during or shortly after the administration. Hence, accurate laboratory tests are required to be performed before the administration of contrast agents to the patient. Few of the contrast agents available are not advised to be used for pregnant women. The clinical reports for the occurrence of these conditions after injecting the contrast agent restrict its use and are anticipated to affect the growth of the market.
Opportunity: Growth opportunities in emerging countries
Developing economies offer high growth opportunities for key players operating in the contrast-enhanced ultrasound market. Countries such as India, China, Brazil, South Korea, Turkey, Russia, and South Africa offer a sustainable market for diagnostic imaging devices. Due to a consistent rise in the population, the demand for diagnostic imaging has significantly increased in emerging economies. This is further attributed to the rising prevalence of target diseases and increasing healthcare expenditure. The Indian government has launched the Ayushman Bharat program to provide an insurance scheme. Furthermore, the growth in emerging economies is accompanied by favorable government and private policies to enhance access to diagnostic imaging, including the provision of reimbursement.
Challenge: Shortage of skilled sonographers
Physicians largely depend on sonographers for the effective & accurate evaluation of ultrasound examinations. Technical skill and on-hand experience are critical to ensuring the optimal use of ultrasound devices for effective and accurate disease diagnosis. Poorly captured images may lead to incorrect interpretation or the unnecessary repetition of ultrasound examinations. Moreover, a well-trained sonographer is able to interpret the scanned image in order to document the presence of any medical abnormalities as mandated by relevant professional organizations. However, major healthcare markets (such as the US, the UK, Canada, and Australia) are witnessing a severe shortage of well-trained sonographers. According to the US Bureau of Labor Statistics, the demand for diagnostic medical sonographers is projected to grow 10% from 2021 to 2031, which is faster than the average for all other occupations.
Contrast Enhanced Ultrasound Market Ecosystem
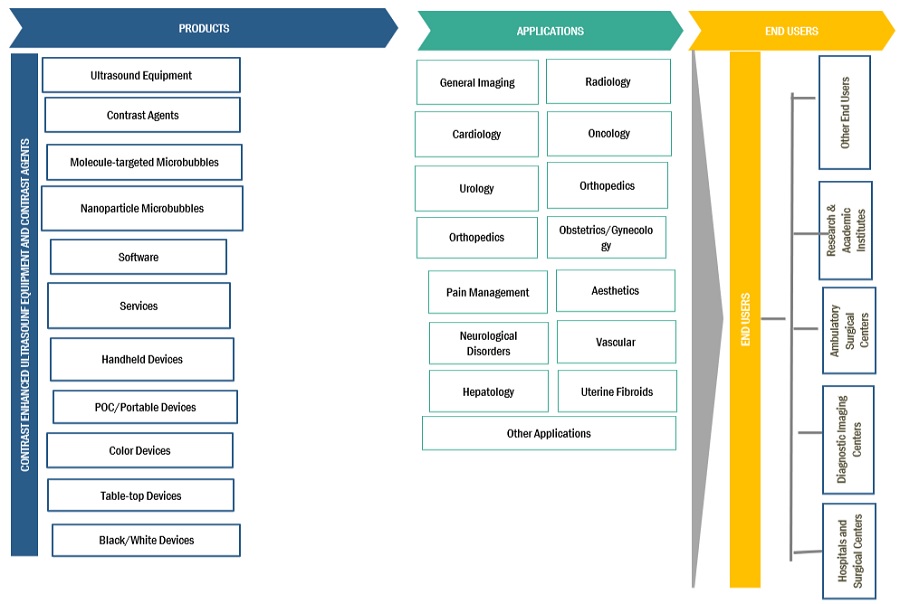
By product, the contrast-enhanced ultrasound equipment segment accounted for the largest share of the contrast enhanced ultrasound industry in 2022.
Based on product, the global contrast enhanced ultrasound market is segmented into equipment, contrast agents, and software and services. In 2022, the equipment segment accounted for the largest market share. The rising use of advanced instruments supporting accurate diagnosis and the need for better sensitivity is driving segment growth.
By application, the therapeutic applications segment of the contrast enhanced ultrasound industry to register significant growth in the near future.
Based on application, the global contrast enhanced ultrasound market is segmented into diagnostic applications and therapeutic applications. The therapeutic applications segment registered the highest growth rate during the forecast period. The major factors responsible for the highest growth rate of this segment are the rising use of novel equipment that allows precise targeting of internal organs supporting real-time imaging.
By end user, the hospitals and surgical centers segment accounted for the largest share of the contrast enhanced ultrasound industry in 2022.
Based on end users, the global contrast enhanced ultrasound market is segmented into hospitals and surgical centers, diagnostic imaging clinics, ambulatory surgical centers, and other end users. In 2022, the hospitals and surgical centers segment accounted for the largest market share. The highest share of this segment is attributed to the rising utilization of contrast-enhanced ultrasound equipment for disease diagnosis and increasing awareness for early diagnosis. This is primarily attributed to the digitization of radiology patient workflow, the increasing number of contrast-enhanced ultrasound procedures performed in hospitals, and the rising adoption of advanced systems with improved features in hospitals to improve the quality of patient care.
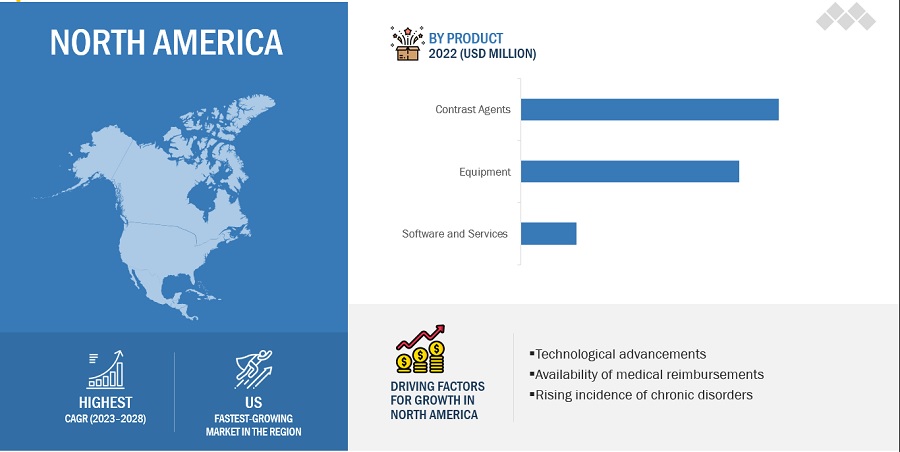
By region, North America is expected to be the largest region of the contrast enhanced ultrasound industry during the forecast period.
North America, comprising the US and Canada, accounted for the largest share of the contrast enhanced ultrasound market in 2022. Factors such as increasing applications in the healthcare sector, favorable reimbursement policies for contrast-enhanced ultrasound procedures, and the presence of major players in the region are fueling the growth in North America. Rapid growth in the old age population in the region and significant utilization of contrast agents is supporting the growth of the market.
To know about the assumptions considered for the study, download the pdf brochure
As of 2022, prominent players in the market are GE Healthcare (US), Lantheus Holdings, Inc. (US), Bracco Imaging SpA (Italy), and Koninklijke Philips N.V. (Netherlands).
Scope of the Contrast Enhanced Ultrasound Industry
|
Report Metric |
Details |
|
Market Revenue in 2023 |
$1.6 billion |
|
Projected Revenue by 2028 |
$2.1 billion |
|
Revenue Rate |
Poised to Grow at a CAGR of 6.1% |
|
Market Driver |
Rising prevalence of chronic diseases |
|
Market Opportunity |
Growth opportunities in emerging countries |
This report has segmented the global contrast enhanced ultrasound market to forecast revenue and analyze trends in each of the following submarkets:
By Product
- Equipment
- Contrast Agents
- Molecule-targeted Microbubbles
- Nanoparticle Microbubbles
- Software and Services
By Application
- Diagnostic Applications
- Cardiology
- Hepatic/Liver
- Nephrology/Kidney
- Other Diagnostic Applications
- Therapeutic Applications
- Cardiology
- Vascular
- Oncology
- Other Therapeutic Applications
By End User
- Hospitals and Surgical Centers
- Diagnostic Imaging Clinics
- Ambulatory Surgical Centers
- Other End Users
By Region
-
North America
- US
- Canada
-
Europe
- Germany
- France
- UK
- Rest of Europe
-
Asia Pacific
- Japan
- China
- India
- Rest of Asia Pacific
- Rest of the World
Recent Developments of Contrast Enhanced Ultrasound Industry
- In 2023, Esaote SpA launched a new premium ultrasound system, MyLab X90. This system has high contrast resolution and supports higher accuracy. It is equipped with augmented insight and can be utilized to contrast-enhanced ultrasound procedures. It simplifies the workflow and delivers exceptional image quality.
- In 2021, Mindary launched the general imaging diagnostic ultrasound system. Resona I9 is equipped with the latest technologies and delivers improved efficiency. It supports precise analysis and provides accurate results. It can be efficiently used to perform contrast-enhanced ultrasound procedures and can be easily transported for mobile service.
- In 2021, Esaote SpA launched the MyLab X75 ultrasound system. This system can be effectively used for liver quantification. This system offers improved contrast resolution. It can be efficiently used to perform liver assessment.
Frequently Asked Questions (FAQ):
What is the projected market revenue value of the global contrast enhanced ultrasound market?
The global contrast enhanced ultrasound market boasts a total revenue value of $2.1 billion by 2028.
What is the estimated growth rate (CAGR) of the global contrast enhanced ultrasound market?
The global contrast enhanced ultrasound market has an estimated compound annual growth rate (CAGR) of 6.1% and a revenue size in the region of $1.6 billion in 2023.
To speak to our analyst for a discussion on the above findings, click Speak to Analyst


- 5.1 INTRODUCTION
-
5.2 MARKET DYNAMICSDRIVERS- Increasing incidence of chronic diseases- Rising technological advancements in contrast- enhanced ultrasound systems- Increasing initiatives for commercialization of diagnostic imaging equipmentRESTRAINTS- Risks associated with contrast agentsOPPORTUNITIES- Growth opportunities in emerging economies- Increasing establishment of hospitals and diagnostic imaging centersCHALLENGES- Shortage of skilled sonographers- Presence of alternative techniques
-
5.3 PORTER’S FIVE FORCES ANALYSISTHREAT OF NEW ENTRANTSTHREAT OF SUBSTITUTESBARGAINING POWER OF SUPPLIERSBARGAINING POWER OF BUYERSINTENSITY OF COMPETITIVE RIVALRY
- 5.4 TRADE ANALYSIS
-
5.5 PATENT ANALYSIS
-
5.6 ECOSYSTEM COVERAGE OF PARENT MARKET
-
5.7 VALUE CHAIN ANALYSISRESEARCH & DEVELOPMENTMANUFACTURING & ASSEMBLYDISTRIBUTION, MARKETING & SALES, AND POST-SALES SERVICES
-
5.8 SUPPLY CHAIN ANALYSISPROMINENT COMPANIESSMALL & MEDIUM-SIZED ENTERPRISESEND USERS
- 5.9 PRICING TREND ANALYSIS
- 5.10 TECHNOLOGY ANALYSIS
-
5.11 REGULATORY LANDSCAPENORTH AMERICA- US- CanadaEUROPEASIA PACIFIC- Japan- China- India
- 5.12 REIMBURSEMENT SCENARIO
-
5.13 CASE STUDIESTECHNICAL CHALLENGES WITH ULTRASOUND SYSTEMS
- 5.14 KEY CONFERENCES AND EVENTS
- 6.1 INTRODUCTION
-
6.2 EQUIPMENTINNOVATIVE PRODUCT LAUNCHES WITH IMPROVED DIAGNOSIS AND REAL-TIME MONITORING ABILITIES TO DRIVE MARKET
-
6.3 CONTRAST AGENTSMOLECULE-TARGETED MICROBUBBLES- Rising use in targeted therapies to drive marketNANOPARTICLE MICROBUBBLES- Utilization in thermal therapies to fuel market
-
6.4 SOFTWARE AND SERVICESRISING UTILIZATION OF SOFTWARE FOR OPTIMAL IMAGE VISUALIZATION TO DRIVE MARKET
- 7.1 INTRODUCTION
-
7.2 DIAGNOSTIC APPLICATIONSCARDIOLOGY- Increasing incidence of CVD to drive marketHEPATIC- Utilization of CEUS technology in characterization of focal liver lesions to drive marketNEPHROLOGY- Ability to identify renal complications to propel marketOTHER DIAGNOSTIC APPLICATIONS
-
7.3 THERAPEUTIC APPLICATIONSCARDIOLOGY- Growing applications in targeted drug delivery to propel marketVASCULAR- Growing use of contrast agents in blood flow dynamics to fuel marketONCOLOGY- Rising utilization in targeted therapy to drive marketOTHER THERAPEUTIC APPLICATIONS
- 8.1 INTRODUCTION
-
8.2 HOSPITALS AND SURGICAL CENTERSRISING NUMBER OF CEUS-BASED MEDICAL PROCEDURES TO DRIVE MARKET
-
8.3 DIAGNOSTIC IMAGING CENTERSRISING ESTABLISHMENT OF PRIVATE IMAGING CENTERS TO SUPPORT MARKET GROWTH
-
8.4 AMBULATORY SURGERY CENTERSRISING VOLUME OF EMERGENCY SURGERIES TO PROPEL MARKET
- 8.5 OTHER END USERS
- 9.1 INTRODUCTION
-
9.2 NORTH AMERICANORTH AMERICA: RECESSION IMPACTUS- High adoption rate of innovative medical technologies to drive marketCANADA- Increasing incidence of heart & kidney diseases to drive market
-
9.3 EUROPEEUROPE: RECESSION IMPACTGERMANY- High healthcare expenditure to propel marketFRANCE- Rising target patient population and government-funded investments for advanced medical equipment to fuel uptakeUK- Increasing investments in diagnostic imaging to drive marketREST OF EUROPE
-
9.4 ASIA PACIFICASIA PACIFIC: RECESSION IMPACTJAPAN- Presence of universal healthcare reimbursement system to support market growthCHINA- Rising government initiatives for improvements in healthcare infrastructure to drive marketINDIA- Growing public-private investments in novel medical technologies to drive marketREST OF ASIA PACIFIC
-
9.5 REST OF THE WORLDREST OF THE WORLD: RECESSION IMPACT

- 10.1 OVERVIEW
- 10.2 STRATEGIES ADOPTED BY KEY PLAYERS
- 10.3 REVENUE SHARE ANALYSIS
- 10.4 MARKET SHARE ANALYSIS
-
10.5 COMPANY EVALUATION MATRIX (2022)STARSPERVASIVE PLAYERSEMERGING LEADERSPARTICIPANTS
- 10.6 COMPETITIVE BENCHMARKING
-
10.7 COMPETITIVE SCENARIO AND TRENDSPRODUCT LAUNCHESDEALSOTHER DEVELOPMENTS
-
11.1 KEY PLAYERSGE HEALTHCARE- Business overview- Products offered- Recent developments- MnM viewLANTHEUS- Business overview- Products offered- Recent developments- MnM viewBRACCO IMAGING S.P.A.- Business overview- Products offered- Recent developments- MnM viewKONINKLIJKE PHILIPS N.V.- Business overview- Products offered- Recent developmentsSIEMENS HEALTHINEERS- Business overview- Products offered- Recent developmentsSHENZHEN MINDRAY BIO-MEDICAL ELECTRONICS CO., LTD.- Business overview- Products offered- Recent developmentsCANON INC.- Business overview- Products offered- Recent developmentsESAOTE S.P.A- Business overview- Products offered- Recent developmentsSAMSUNG ELECTRONICS CO., LTD.- Business overview- Products offered- Recent developmentsGUERBET- Business overview- Products offered- Recent developments
-
11.2 OTHER PLAYERSNANOPET PHARMA GMBHBAYER AGREVVITYSOLSTICE PHARMACEUTICALS B.V.TRIVITRON HEALTHCARELERIVAJB PHARMA
- 12.1 DISCUSSION GUIDE
- 12.2 KNOWLEDGESTORE: MARKETSANDMARKETS’ SUBSCRIPTION PORTAL
- 12.3 CUSTOMIZATION OPTIONS
- 12.4 RELATED REPORTS
- 12.5 AUTHOR DETAILS
- TABLE 1 CONTRAST-ENHANCED ULTRASOUND MARKET: PORTER’S FIVE FORCES ANALYSIS
- TABLE 2 IMPORT DATA FOR ULTRASOUND SYSTEMS, BY COUNTRY, 2018–2022 (USD THOUSAND)
- TABLE 3 EXPORT DATA FOR ULTRASOUND SYSTEMS, BY COUNTRY, 2018–2022 (USD THOUSAND)
- TABLE 4 IMPORT DATA FOR CONTRAST AGENTS, BY COUNTRY, 2018–2022 (USD THOUSAND)
- TABLE 5 EXPORT DATA FOR CONTRAST AGENTS, BY COUNTRY, 2018–2022 (USD THOUSAND)
- TABLE 6 AVERAGE SELLING PRICE FOR MAJOR CONTRAST-ENHANCED ULTRASOUND EQUIPMENT
- TABLE 7 US FDA: MEDICAL DEVICE CLASSIFICATION
- TABLE 8 US: MEDICAL DEVICE REGULATORY APPROVAL PROCESS
- TABLE 9 CANADA: MEDICAL DEVICE REGULATORY APPROVAL PROCESS
- TABLE 10 JAPAN: MEDICAL DEVICE CLASSIFICATION UNDER PMDA
- TABLE 11 CHINA: CLASSIFICATION OF MEDICAL DEVICES
- TABLE 12 MEDICAL REIMBURSEMENT CODES FOR CONTRAST- ENHANCED ULTRASOUND PROCEDURES
- TABLE 13 CASE STUDY 1: IMPROVED SENSITIVITY AND BETTER VISIBILITY OF BLOOD FLOW
- TABLE 14 CONTRAST-ENHANCED ULTRASOUND MARKET: LIST OF MAJOR CONFERENCES AND EVENTS (2023–2024)
- TABLE 15 CONTRAST-ENHANCED ULTRASOUND MARKET, BY PRODUCT & SERVICE, 2021–2028 (USD MILLION)
- TABLE 16 CONTRAST-ENHANCED ULTRASOUND MARKET FOR EQUIPMENT, BY REGION, 2021–2028 (USD MILLION)
- TABLE 17 CONTRAST-ENHANCED ULTRASOUND MARKET FOR CONTRAST AGENTS, BY TYPE, 2021–2028 (USD MILLION)
- TABLE 18 CONTRAST-ENHANCED ULTRASOUND MARKET FOR CONTRAST AGENTS, BY REGION, 2021–2028 (USD MILLION)
- TABLE 19 CONTRAST-ENHANCED ULTRASOUND MARKET FOR MOLECULE-TARGETED MICROBUBBLES, BY REGION, 2021–2028 (USD MILLION)
- TABLE 20 CONTRAST-ENHANCED ULTRASOUND MARKET FOR NANOPARTICLE MICROBUBBLES, BY REGION, 2021–2028 (USD MILLION)
- TABLE 21 CONTRAST-ENHANCED ULTRASOUND MARKET FOR SOFTWARE AND SERVICES, BY REGION, 2021–2028 (USD MILLION)
- TABLE 22 CONTRAST-ENHANCED ULTRASOUND MARKET, BY APPLICATION, 2021–2028 (USD MILLION)
- TABLE 23 CONTRAST-ENHANCED ULTRASOUND MARKET FOR DIAGNOSTIC APPLICATIONS, BY TYPE, 2021–2028 (USD MILLION)
- TABLE 24 CONTRAST-ENHANCED ULTRASOUND MARKET FOR DIAGNOSTIC CARDIOLOGY APPLICATIONS, BY REGION, 2021–2028 (USD MILLION)
- TABLE 25 CONTRAST-ENHANCED ULTRASOUND MARKET FOR DIAGNOSTIC HEPATIC APPLICATIONS, BY REGION, 2021–2028 (USD MILLION)
- TABLE 26 CONTRAST-ENHANCED ULTRASOUND MARKET FOR DIAGNOSTIC NEPHROLOGY APPLICATIONS, BY REGION, 2021–2028 (USD MILLION)
- TABLE 27 CONTRAST-ENHANCED ULTRASOUND MARKET FOR OTHER DIAGNOSTIC APPLICATIONS, BY REGION, 2021–2028 (USD MILLION)
- TABLE 28 CONTRAST-ENHANCED ULTRASOUND MARKET FOR THERAPEUTIC APPLICATIONS, BY TYPE, 2021–2028 (USD MILLION)
- TABLE 29 CONTRAST-ENHANCED ULTRASOUND MARKET FOR THERAPEUTIC CARDIOLOGY APPLICATIONS, BY REGION, 2021–2028 (USD MILLION)
- TABLE 30 CONTRAST-ENHANCED ULTRASOUND MARKET FOR THERAPEUTIC VASCULAR APPLICATIONS, BY REGION, 2021–2028 (USD MILLION)
- TABLE 31 CONTRAST-ENHANCED ULTRASOUND MARKET FOR THERAPEUTIC ONCOLOGY APPLICATIONS, BY REGION, 2021–2028 (USD MILLION)
- TABLE 32 CONTRAST-ENHANCED ULTRASOUND MARKET FOR OTHER THERAPEUTIC APPLICATIONS, BY REGION, 2021–2028 (USD MILLION)
- TABLE 33 CONTRAST-ENHANCED ULTRASOUND MARKET, BY END USER, 2021–2028 (USD MILLION)
- TABLE 34 CONTRAST-ENHANCED ULTRASOUND MARKET FOR HOSPITALS AND SURGICAL CENTERS, BY REGION, 2021–2028 (USD MILLION)
- TABLE 35 CONTRAST-ENHANCED ULTRASOUND MARKET FOR DIAGNOSTIC IMAGING CENTERS, BY REGION, 2021–2028 (USD MILLION)
- TABLE 36 CONTRAST-ENHANCED ULTRASOUND MARKET FOR AMBULATORY SURGERY CENTERS, BY REGION, 2021–2028 (USD MILLION)
- TABLE 37 CONTRAST-ENHANCED ULTRASOUND MARKET FOR OTHER END USERS, BY REGION, 2021–2028 (USD MILLION)
- TABLE 38 CONTRAST-ENHANCED ULTRASOUND MARKET, BY REGION, 2021–2028 (USD MILLION)
- TABLE 39 NORTH AMERICA: CONTRAST-ENHANCED ULTRASOUND MARKET, BY COUNTRY, 2021–2028 (USD MILLION)
- TABLE 40 NORTH AMERICA: CONTRAST-ENHANCED ULTRASOUND MARKET, BY PRODUCT & SERVICE, 2021–2028 (USD MILLION)
- TABLE 41 NORTH AMERICA: CONTRAST-ENHANCED ULTRASOUND MARKET FOR CONTRAST AGENTS, BY TYPE, 2021–2028 (USD MILLION)
- TABLE 42 NORTH AMERICA: CONTRAST-ENHANCED ULTRASOUND MARKET, BY APPLICATION, 2021–2028 (USD MILLION)
- TABLE 43 NORTH AMERICA: CONTRAST-ENHANCED ULTRASOUND MARKET FOR DIAGNOSTIC APPLICATIONS, BY TYPE, 2021–2028 (USD MILLION)
- TABLE 44 NORTH AMERICA: CONTRAST-ENHANCED ULTRASOUND MARKET FOR THERAPEUTIC APPLICATIONS, BY TYPE, 2021–2028 (USD MILLION)
- TABLE 45 NORTH AMERICA: CONTRAST-ENHANCED ULTRASOUND MARKET, BY END USER, 2021–2028 (USD MILLION)
- TABLE 46 US: CONTRAST-ENHANCED ULTRASOUND MARKET, BY PRODUCT, 2021–2028 (USD MILLION)
- TABLE 47 US: CONTRAST-ENHANCED ULTRASOUND MARKET FOR CONTRAST AGENTS, BY TYPE, 2021–2028 (USD MILLION)
- TABLE 48 CANADA: CONTRAST-ENHANCED ULTRASOUND MARKET, BY PRODUCT & SERVICE, 2021–2028 (USD MILLION)
- TABLE 49 CANADA: CONTRAST-ENHANCED ULTRASOUND MARKET FOR CONTRAST AGENTS, BY TYPE, 2021–2028 (USD MILLION)
- TABLE 50 EUROPE: CONTRAST-ENHANCED ULTRASOUND MARKET, BY COUNTRY, 2021–2028 (USD MILLION)
- TABLE 51 EUROPE: CONTRAST-ENHANCED ULTRASOUND MARKET, BY PRODUCT & SERVICE, 2021–2028 (USD MILLION)
- TABLE 52 EUROPE: CONTRAST-ENHANCED ULTRASOUND MARKET FOR CONTRAST AGENTS, BY TYPE, 2021–2028 (USD MILLION)
- TABLE 53 EUROPE: CONTRAST-ENHANCED ULTRASOUND MARKET, BY APPLICATION, 2021–2028 (USD MILLION)
- TABLE 54 EUROPE: CONTRAST-ENHANCED ULTRASOUND MARKET FOR DIAGNOSTIC APPLICATIONS, BY TYPE, 2021–2028 (USD MILLION)
- TABLE 55 EUROPE: CONTRAST-ENHANCED ULTRASOUND MARKET FOR THERAPEUTIC APPLICATIONS, BY TYPE, 2021–2028 (USD MILLION)
- TABLE 56 EUROPE: CONTRAST-ENHANCED ULTRASOUND MARKET, BY END USER, 2021–2028 (USD MILLION)
- TABLE 57 GERMANY: CONTRAST-ENHANCED ULTRASOUND MARKET, BY PRODUCT & SERVICE, 2021–2028 (USD MILLION)
- TABLE 58 GERMANY: CONTRAST-ENHANCED ULTRASOUND MARKET FOR CONTRAST AGENTS, BY TYPE, 2021–2028 (USD MILLION)
- TABLE 59 FRANCE: CONTRAST-ENHANCED ULTRASOUND MARKET, BY PRODUCT & SERVICE, 2021–2028 (USD MILLION)
- TABLE 60 FRANCE: CONTRAST-ENHANCED ULTRASOUND MARKET FOR CONTRAST AGENTS, BY TYPE, 2021–2028 (USD MILLION)
- TABLE 61 UK: CONTRAST-ENHANCED ULTRASOUND MARKET, BY PRODUCT & SERVICE, 2021–2028 (USD MILLION)
- TABLE 62 UK: CONTRAST-ENHANCED ULTRASOUND FOR CONTRAST AGENTS, BY TYPE, 2021–2028 (USD MILLION)
- TABLE 63 REST OF EUROPE: CONTRAST-ENHANCED ULTRASOUND MARKET, BY PRODUCT & SERVICE, 2021–2028 (USD MILLION)
- TABLE 64 REST OF EUROPE: CONTRAST-ENHANCED ULTRASOUND MARKET FOR CONTRAST AGENTS, BY TYPE, 2021–2028 (USD MILLION)
- TABLE 65 ASIA PACIFIC: CONTRAST-ENHANCED ULTRASOUND MARKET, BY COUNTRY, 2021–2028 (USD MILLION)
- TABLE 66 ASIA PACIFIC: CONTRAST-ENHANCED ULTRASOUND MARKET, BY PRODUCT & SERVICE, 2021–2028 (USD MILLION)
- TABLE 67 ASIA PACIFIC: CONTRAST-ENHANCED ULTRASOUND MARKET FOR CONTRAST AGENTS, BY TYPE, 2021–2028 (USD MILLION)
- TABLE 68 ASIA PACIFIC: CONTRAST-ENHANCED ULTRASOUND MARKET, BY APPLICATION, 2021–2028 (USD MILLION)
- TABLE 69 ASIA PACIFIC: CONTRAST-ENHANCED ULTRASOUND MARKET FOR DIAGNOSTIC APPLICATIONS, BY TYPE, 2021–2028 (USD MILLION)
- TABLE 70 ASIA PACIFIC: CONTRAST-ENHANCED ULTRASOUND MARKET FOR THERAPEUTIC APPLICATIONS, BY TYPE, 2021–2028 (USD MILLION)
- TABLE 71 ASIA PACIFIC: CONTRAST-ENHANCED ULTRASOUND MARKET, BY END USER, 2021–2028 (USD MILLION)
- TABLE 72 JAPAN: CONTRAST-ENHANCED ULTRASOUND MARKET, BY PRODUCT & SERVICE, 2021–2028 (USD MILLION)
- TABLE 73 JAPAN: CONTRAST-ENHANCED ULTRASOUND MARKET FOR CONTRAST AGENTS, BY TYPE, 2021–2028 (USD MILLION)
- TABLE 74 CHINA: CONTRAST-ENHANCED ULTRASOUND MARKET, BY PRODUCT & SERVICE, 2021–2028 (USD MILLION)
- TABLE 75 CHINA: CONTRAST-ENHANCED ULTRASOUND MARKET FOR CONTRAST AGENTS, BY TYPE, 2021–2028 (USD MILLION)
- TABLE 76 INDIA: CONTRAST-ENHANCED ULTRASOUND MARKET, BY PRODUCT & SERVICE, 2021–2028 (USD MILLION)
- TABLE 77 INDIA: CONTRAST-ENHANCED ULTRASOUND MARKET FOR CONTRAST AGENTS, BY TYPE, 2021–2028 (USD MILLION)
- TABLE 78 REST OF ASIA PACIFIC: CONTRAST-ENHANCED ULTRASOUND MARKET, BY PRODUCT & SERVICE, 2021–2028 (USD MILLION)
- TABLE 79 REST OF ASIA PACIFIC: CONTRAST-ENHANCED ULTRASOUND MARKET FOR CONTRAST AGENTS, BY TYPE, 2021–2028 (USD MILLION)
- TABLE 80 REST OF THE WORLD: CONTRAST-ENHANCED ULTRASOUND MARKET, BY PRODUCT & SERVICE, 2021–2028 (USD MILLION)
- TABLE 81 REST OF THE WORLD: CONTRAST-ENHANCED ULTRASOUND MARKET FOR CONTRAST AGENTS, BY TYPE, 2021–2028 (USD MILLION)
- TABLE 82 REST OF THE WORLD: CONTRAST-ENHANCED ULTRASOUND MARKET, BY APPLICATION, 2021–2028 (USD MILLION)
- TABLE 83 REST OF THE WORLD: CONTRAST-ENHANCED ULTRASOUND MARKET FOR DIAGNOSTIC APPLICATIONS, BY TYPE, 2021–2028 (USD MILLION)
- TABLE 84 REST OF THE WORLD: CONTRAST-ENHANCED ULTRASOUND MARKET FOR THERAPEUTIC APPLICATIONS, BY TYPE, 2021–2028 (USD MILLION)
- TABLE 85 REST OF THE WORLD: CONTRAST-ENHANCED ULTRASOUND MARKET, BY END USER, 2021–2028 (USD MILLION)
- TABLE 86 CONTRAST-ENHANCED ULTRASOUND MARKET: INTENSITY OF COMPETITIVE RIVALRY
- TABLE 87 CONTRAST-ENHANCED ULTRASOUND MARKET: PRODUCT & REGIONAL FOOTPRINT ANALYSIS
- TABLE 88 CONTRAST-ENHANCED ULTRASOUND MARKET: PRODUCT LAUNCHES (JANUARY 2020–JULY 2023)
- TABLE 89 CONTRAST-ENHANCED ULTRASOUND MARKET: DEALS (JANUARY 2020–JULY 2023)
- TABLE 90 CONTRAST-ENHANCED ULTRASOUND MARKET: OTHER DEVELOPMENTS (JANUARY 2020−JULY 2023)
- TABLE 91 GE HEALTHCARE: COMPANY OVERVIEW
- TABLE 92 LANTHEUS: COMPANY OVERVIEW
- TABLE 93 BRACC0 IMAGING S.P.A.: COMPANY OVERVIEW
- TABLE 94 KONINKLIJKE PHILIPS N.V.: COMPANY OVERVIEW
- TABLE 95 SIEMENS HEALTHINEERS: COMPANY OVERVIEW
- TABLE 96 SHENZHEN MINDRAY BIO-MEDICAL ELECTRONICS CO., LTD.: COMPANY OVERVIEW
- TABLE 97 CANON INC.: COMPANY OVERVIEW
- TABLE 98 ESAOTE S.P.A: COMPANY OVERVIEW
- TABLE 99 SAMSUNG ELECTRONICS CO., LTD.: COMPANY OVERVIEW
- TABLE 100 GUERBET: COMPANY OVERVIEW
- FIGURE 1 CONTRAST-ENHANCED ULTRASOUND MARKET: RESEARCH DESIGN METHODOLOGY
- FIGURE 2 BREAKDOWN OF PRIMARY INTERVIEWS: SUPPLY-SIDE AND DEMAND-SIDE PARTICIPANTS
- FIGURE 3 BREAKDOWN OF PRIMARY INTERVIEWS: BY COMPANY TYPE, DESIGNATION, AND REGION
- FIGURE 4 RESEARCH METHODOLOGY: HYPOTHESIS BUILDING
- FIGURE 5 MARKET SIZE ESTIMATION FOR CONTRAST-ENHANCED ULTRASOUND MARKET: APPROACH 1 (COMPANY REVENUE ESTIMATION)
- FIGURE 6 REVENUE SHARE ANALYSIS: ILLUSTRATIVE EXAMPLE OF GE HEALTHCARE
- FIGURE 7 BOTTOM-UP APPROACH FOR MARKET SIZE ESTIMATION
- FIGURE 8 CAGR PROJECTIONS: SUPPLY-SIDE ANALYSIS
- FIGURE 9 DATA TRIANGULATION METHODOLOGY
- FIGURE 10 CONTRAST-ENHANCED ULTRASOUND MARKET, BY PRODUCT & SERVICE, 2023 VS. 2028 (USD MILLION)
- FIGURE 11 CONTRAST-ENHANCED ULTRASOUND MARKET, BY APPLICATION, 2023 VS. 2028 (USD MILLION)
- FIGURE 12 CONTRAST-ENHANCED ULTRASOUND MARKET, BY END USER, 2023 VS. 2028 (USD MILLION)
- FIGURE 13 CONTRAST-ENHANCED ULTRASOUND MARKET: GEOGRAPHIC SNAPSHOT
- FIGURE 14 RISING PREVALENCE OF CHRONIC DISEASES TO DRIVE MARKET
- FIGURE 15 CONTRAST AGENTS SEGMENT TO REGISTER HIGHEST CAGR DURING FORECAST PERIOD
- FIGURE 16 THERAPEUTIC APPLICATIONS SEGMENT TO DOMINATE MARKET DURING FORECAST PERIOD
- FIGURE 17 HOSPITALS AND SURGICAL CENTERS SEGMENT TO DOMINATE MARKET DURING FORECAST PERIOD
- FIGURE 18 CHINA TO WITNESS HIGHEST GROWTH RATE DURING FORECAST PERIOD
- FIGURE 19 CONTRAST-ENHANCED ULTRASOUND MARKET: DRIVERS, RESTRAINTS, OPPORTUNITIES, AND CHALLENGES
- FIGURE 20 TOP 10 PATENT APPLICANTS (JANUARY 2012–DECEMBER 2022)
- FIGURE 21 VALUE CHAIN ANALYSIS
- FIGURE 22 SUPPLY CHAIN ANALYSIS
- FIGURE 23 NORTH AMERICA: CONTRAST-ENHANCED ULTRASOUND MARKET SNAPSHOT
- FIGURE 24 ASIA PACIFIC: CONTRAST-ENHANCED ULTRASOUND MARKET SNAPSHOT
- FIGURE 25 CONTRAST-ENHANCED ULTRASOUND MARKET: KEY PLAYER STRATEGIES
- FIGURE 26 CONTRAST-ENHANCED ULTRASOUND MARKET: REVENUE SHARE ANALYSIS OF LEADING PLAYERS (2022)
- FIGURE 27 CONTRAST-ENHANCED ULTRASOUND MARKET: MARKET SHARE ANALYSIS OF LEADING PLAYERS (2022)
- FIGURE 28 CONTRAST-ENHANCED ULTRASOUND MARKET: COMPANY EVALUATION MATRIX (2022)
- FIGURE 29 GE HEALTHCARE: COMPANY SNAPSHOT (2022)
- FIGURE 30 LANTHEUS: COMPANY SNAPSHOT (2022)
- FIGURE 31 KONINKLIJKE PHILIPS N.V.: COMPANY SNAPSHOT (2022)
- FIGURE 32 SIEMENS HEALTHINEERS: COMPANY SNAPSHOT (2022)
- FIGURE 33 SHENZHEN MINDRAY BIO-MEDICAL ELECTRONICS CO., LTD.: COMPANY SNAPSHOT (2022)
- FIGURE 34 CANON INC.: COMPANY SNAPSHOT (2022)
- FIGURE 35 SAMSUNG ELECTRONICS CO., LTD.: COMPANY SNAPSHOT (2022)
- FIGURE 36 GUERBET: COMPANY SNAPSHOT (2022)
The study involved four major activities in estimating the current size of the contrast-enhanced ultrasound market. Exhaustive secondary research was done to collect information on the market, peer, and parent markets. The next step was to validate these findings, assumptions, and sizing with industry experts across the value chain through primary research. Both top-down and bottom-up approaches were employed to estimate the complete market size. After that, market breakdown and data triangulation were used to estimate the market size of segments and subsegments.
Secondary Research
The secondary research process involves the widespread use of secondary sources, directories, databases (such as Bloomberg Businessweek, Factiva, and D&B Hoovers), white papers, annual reports, company house documents, investor presentations, and SEC filings of companies. Secondary research was used to identify and collect information useful for the extensive, technical, market-oriented, and commercial contrast-enhanced ultrasound market study. It was also used to obtain important information about the key players and market classification & segmentation according to industry trends to the bottom-most level and key developments related to market and technology perspectives. A database of the key industry leaders was also prepared using secondary research.
Primary Research
In the primary research process, various supply and demand sources were interviewed to obtain qualitative and quantitative information for this report. The primary sources from the supply side include industry experts such as CEOs, vice presidents, marketing and sales directors, technology & innovation directors, and related key executives from various key companies and organizations in the contrast-enhanced ultrasound market. The primary sources from the demand side include medical OEMs, CDMOs, and service providers. Primary research was conducted to validate the market segmentation, identify key players, and gather insights on key industry trends & key market dynamics.
A breakdown of the primary respondents is provided below:
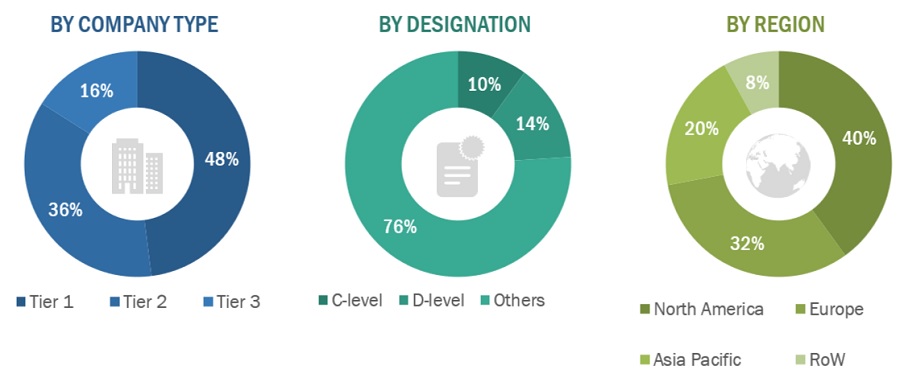
*Others include sales managers, marketing managers, business development managers, product managers, distributors, and suppliers.
Note: Companies are classified into tiers based on their total revenue. As of 2021, Tier 1 = >USD 1,000 million, Tier 2 = USD 500–1,000 million, and Tier 3 = <USD 500 million.
To know about the assumptions considered for the study, download the pdf brochure
Market Estimation Methodology
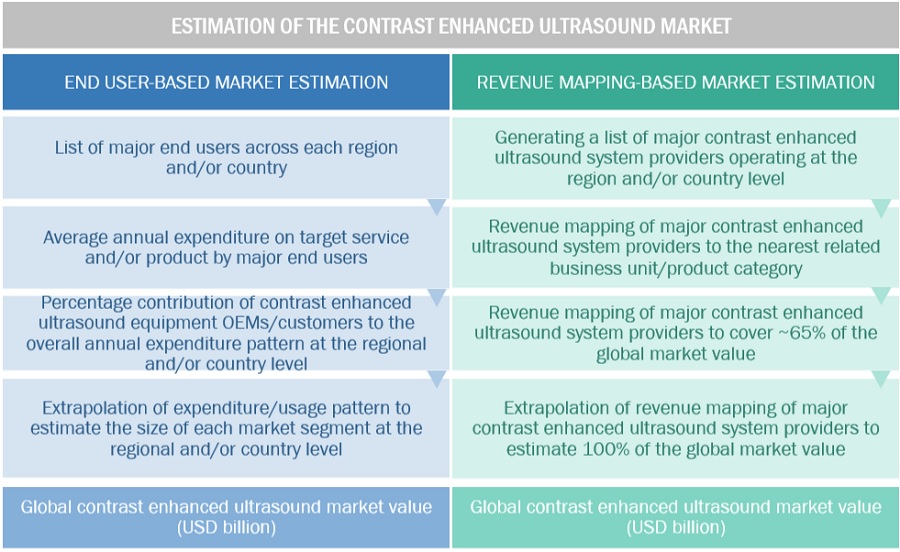
In this report, the contrast-enhanced ultrasound market’s size was determined using the revenue share analysis of leading players. For this purpose, key players in the market were identified, and their revenues from the market business were determined through various insights gathered during the primary and secondary research phases. Secondary research included the study of the annual and financial reports of the top market players. In contrast, primary research included extensive interviews with key opinion leaders, such as CEOs, directors, and key marketing executives.
Segmental revenues were calculated based on the revenue mapping of major solution/service providers to calculate the global market value. This process involved the following steps:
- Generating a list of major global players operating in the contrast-enhanced ultrasound market.
- Mapping annual revenues generated by major global players from the product segment (or nearest reported business unit/product category)
- Revenue mapping of major players to cover a major share of the global market share as of 2021
- Extrapolating the global value of the contrast-enhanced ultrasound aging market industry
To know about the assumptions considered for the study, Request for Free Sample Report
Data Triangulation
After arriving at the overall market size from the market size estimation process explained above, the global contrast-enhanced ultrasound market was split into segments and subsegments. Data triangulation and market breakdown procedures were employed to complete the overall market engineering process and arrive at the exact statistics for all segments and subsegments. The data was triangulated by studying various factors and trends from both the demand and supply sides. Additionally, the contrast-enhanced ultrasound market was validated using top-down and bottom-up approaches.
Market Definition
Contrast-enhanced ultrasound involves the use of contrast agents to achieve clear images of internal structures. Contrast agents such as microbubbles are injected into the veins through an intravenous (IV) tube. These microbubbles vibrate due to sound waves coming from the ultrasound. The reflection of these sound waves from the contrast bubbles creates an area in the image. Contrast-enhanced ultrasound equipment is primarily used in hospitals and surgical centers, diagnostic imaging clinics, and ambulatory surgical centers.
Key Stakeholders
- Senior Management
- End Users
- R&D Department
- Finance/Procurement Department
Objectives of the Study
- To define, describe, and forecast the size of the contrast-enhanced ultrasound market based on product, application, end-user, and region
- To provide detailed information regarding the major factors influencing the growth potential of the global contrast-enhanced ultrasound market (drivers, restraints, opportunities, challenges, and trends)
- To analyze the micro markets with respect to individual growth trends, prospects, and contributions to the global contrast-enhanced ultrasound market.
- To analyze key growth opportunities in the global contrast-enhanced ultrasound market for key stakeholders and provide details of the competitive landscape for market leaders
- To forecast the size of market segments and/or subsegments with respect to three major regions, namely, North America (US and Canada), Europe (Germany, France, the UK, and the RoE), Asia Pacific (Japan, China, India, and the RoAPAC).
- To profile the key players in the contrast-enhanced ultrasound market and comprehensively analyze their market shares and core competencies
- To track and analyze the competitive developments undertaken in the global contrast-enhanced ultrasound market, such as product launches; agreements; expansions; and mergers & acquisitions.
Available Customizations
With the given market data, MarketsandMarkets offers customizations per the company’s specific needs. The following customization options are available for the present global contrast-enhanced ultrasound market report:
Product Analysis
- Product matrix, which gives a detailed comparison of the product portfolios of the top five companies
Company Information
- Detailed analysis and profiling of additional market players (up to five)
Geographic Analysis
- Further breakdown of the Rest of Europe's contrast-enhanced ultrasound market into Italy, Spain, Russia, Belgium, the Netherlands, Switzerland, Austria, Finland, Sweden, Poland, and Portugal, among others.
- Further breakdown of the Rest of Asia Pacific contrast-enhanced ultrasound market into Australia, New Zealand, Singapore, Taiwan, New Zealand, Philippines, Malaysia, and other APAC countries.


Growth opportunities and latent adjacency in Contrast Enhanced Ultrasound Market