Concrete Surface Retarders Market by Raw Material (Organic Agents and Inorganic Agents), Type (Water-based and Solvent-based), Application (Residential and Commercial), and Region (North America, Europe, Asia Pacific) - Global Forecast to 2023


[121 Pages Report] Concrete surface retarders are chemicals used to delay or retard the setting of the top surface of the freshly poured concrete. These retarders offer various benefits to the concrete surface, including slip resistance, structural integrity, and aesthetic appeal. Concrete surface retarders are used on a wide range of horizontal and vertical concrete surfaces, such as precast concrete elements, floors, patios, paving, and concrete segment joints.
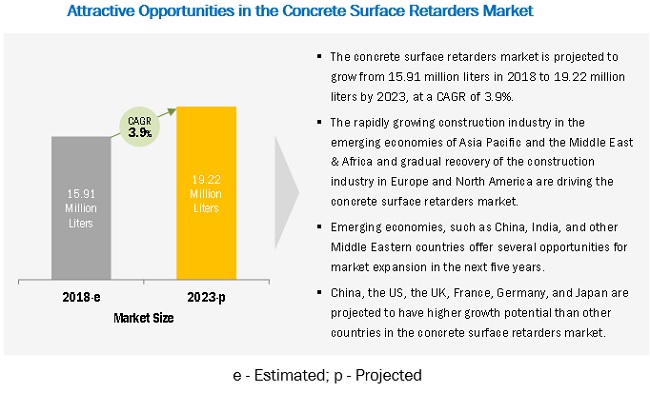
Concrete surface retarders are widely used in the residential, commercial, education, healthcare, and industrial sectors. The global concrete surface retarders market is projected to reach USD 89.40 million liters by 2023, at a CAGR of 4.23% from 2018 to 2023.
Organic agents to be the larger raw material segment throughout the forecast period.
Lower cost and broader application areas in architectural concrete, precast concrete, and on slip-resistance surfaces, among others, have contributed to the extensive use of organic agents in concrete surface retarders.
By type, water-based segment estimated to dominate the concrete surface retarders market.
The growth of this segment is attributed to the eco-friendly, non-hazardous, and odorless properties of water-based retarders. The usage of these retarders is also supported by their lower VOC content as compared to the solvent-based retarders. Water-based retarders are used in cast-in-situ and precast concrete applications.
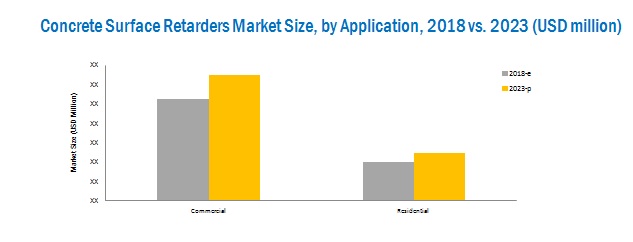
Commercial application segment estimated to lead the concrete surface retarder market in the forecast period.
The growth of this application segment is attributed to the increasing use of concrete surface retarders in bridge decks, sidewalks, curbs, ramps, facade cladding, and concrete segment joints, among others. The dominance of the commercial segment over the residential segment is also supported by rising public and private investments for infrastructural development in the emerging economies of Asia Pacific, the Middle East, and South America.
North America to be the second-fastest-growing region in the concrete surface retarders market during the forecast period
The growth of the concrete surface retarders in North America is expected to be driven by the increasing demand for high-quality green buildings, time-cost efficiency, reduced environmental impact, and government regulations.
Market Dynamics
Driver: Increasing demand for green buildings
The concrete surface retarders market is poised to grow, owing to an increasing acceptance of sustainable and green building construction concepts. A green building incorporates design, construction, and operation practices that use sustainable materials in construction, for an excellent surface finish and an improved aesthetic appeal, among other measurable targets. Besides being eco-friendly, water-based retarders enhance the architectural beauty of buildings by providing a decorative finish. They also offer slip-resistance to the concrete surfaces.
There is a rise in demand for green buildings, especially in the European and North American regions, owing to various regulations that necessitate the use of sustainable concrete in both commercial and residential buildings. Water-based concrete surface retarders are environment-friendly, solventless, and have less odor, owing to which they are preferred in green buildings for various horizontal and vertical concrete surface applications, such as vertical construction joints, sidewalks, driveways, construction joints, floors, and paving slabs.
Opportunity: Rise in construction activities
The industrial boom, post the economic slowdown of 2008, has given rise to new constructions, both commercial and non-commercial. In Middle Eastern countries, such as Saudi Arabia, the UAE, and Qatar, the construction industry has been growing. The Asia Pacific region is projected to witness the highest number of new constructions between 2015 and 2020. The �Make in India� program introduced by the Government of India promotes new construction projects in the country. The sub-prime crisis in the US (between 2007 and 2010) caused a recession in the construction industry. However, the industry has recovered and is growing at a moderate pace. The global construction industry contributes around one-tenth of the global GDP and is expected to reach about USD 8 trillion by 2030, as per Oxford Economics.
Challenge : Lack of awareness about concrete surface retarders
The concrete surface retarders market has a positive outlook due to high growth in the construction industry. However, in some of the developing countries in Asia Pacific, Africa, and South America, people are less aware of these retarders or the benefits offered by them. Currently, many countries in the abovementioned regions use cheaper alternatives. For instance, in flatwork, the methods used include just spreading sugar-water mixture on the newly poured concrete surfaces or spreading and rolling pea gravel. End users, such as customers from the precast concrete industry, concrete cast stone industry, concrete products industry, or ready-mix concrete industry, prefer these substitutes to provide a decorative finish. Therefore, for the growth of this sector, it is essential to educate the consumers regarding the positive features and benefits of using concrete surface retarders in vertical and horizontal concrete surfaces. Advertisements, trade shows, and exhibitions can help create awareness and promote the use of concrete surface retarders in developing countries.
Scope of the Report
|
Report Metric |
Details |
|
Market size available for years |
2016�2023 |
|
Base year considered |
2017 |
|
Forecast period |
2018�2023 |
|
Forecast units |
USD million and million liters |
|
Segments covered |
Raw Material, Type, Application, and Region |
|
Geographies covered |
North America, Europe, Asia Pacific (APAC), Middle East and Africa (MEA) and South America |
|
Companies covered |
Sika (Switzerland), BASF (Germany), MAPEI (Italy), GCP Applied Technologies (US), CEMEX (Mexico), W. R. Meadows (US), The Euclid Chemical Company (US), RussTech (US), Fosroc (UAE), and Parchem Construction Supplies (Australia) Chryso Group (UK) |
The research report segments the concrete surface retarders market into the following submarkets:
Concrete Surface Retarders Market, By Raw Material
- Organic Agents
- Inorganic Agents
Concrete Surface Retarder Market, By Type
- Water-Based
- Solvent-Based
Concrete Surface Retarders Market, By Application
- Commercial
- Residential
Concrete Surface Retarders Market, By Region
- Europe
- North America
- Asia Pacific
- Middle East & Africa
- South America
Key Market Players
Sika (Switzerland), BASF (Germany), MAPEI (Italy), GCP Applied Technologies (US), CEMEX (Mexico),
Recent Developments
- In June 2018, Sika opened a production plant in Saudi Arabia for concrete admixtures to strengthen its foothold in the Middle East region. This expansion is expected to help the company increase its production capacity and optimize logistics by reducing the transportation costs incurred in serving the adjacent markets around the Persian Gulf.
- In May 2018, BASF inaugurated its first production plant in Yangon, Myanmar. This expansion is expected to serve the increasing demand for high quality, tailor-made concrete admixtures from the growing residential, industrial, and infrastructure construction sectors in Myanmar.
- In April 2018, Sika expanded its presence in Senegal, Africa, by opening a concrete admixture factory. This expansion is expected to help the company increase its presence in the growing economy of Senegal and serve customers in West Africa.
- In June 2017, One of CEMEX�s subsidiaries divested its Pacific Northwest materials business to Cadman Materials, Inc. (US). The transaction consists of the sale of its aggregate, asphalt, and ready-mix concrete operations in Oregon and Washington. The deal was closed at approximately USD 150 million.
Critical questions the report answers:
- Where will all these developments take the concrete surface retarders market in the long term?
- What are the upcoming trends for the concrete surface retarder market?
- Which segment in the concrete surface retarders market provides the most opportunity for growth?
- Who are the leading vendors operating in the market?
- What are the opportunities for new market entrants in the concrete surface retarder market?
To speak to our analyst for a discussion on the above findings, click Speak to Analyst
 Exclusive indicates content/data unique to MarketsandMarkets and not available with any competitors.
Table of Contents
1 Introduction (Page No. - 14)
1.1 Objectives of the Study
1.2 Market Definition
1.3 Study Scope
1.4 Regional Scope
1.4.1 Periodization Considered
1.5 Currency Considered
1.6 Unit Considered
2 Research Methodology (Page No. - 18)
2.1 Research Data
2.1.1 Secondary Data
2.1.1.1 Key Data From Secondary Sources
2.1.2 Primary Data
2.1.2.1 Key Data From Primary Sources
2.1.2.2 Breakdown of Primaries
2.2 Market Size Estimation
2.3 Data Triangulation
2.4 Research Assumptions & Limitations
2.4.1 Assumptions
2.4.2 Limitations
3 Executive Summary (Page No. - 27)
4 Premium Insights (Page No. - 31)
4.1 Emerging Economies to Shift Focus Toward Concrete Surface Retarders
4.2 Global Market, By Raw Material
4.3 Market, By Type
4.4 Market, By Application
4.5 Europe Concrete Surface Retarders Market, By Application & Country
5 Market Overview (Page No. - 34)
5.1 Introduction
5.2 Market Dynamics
5.2.1 Drivers
5.2.1.1 Increasing Demand for Green Buildings
5.2.1.2 Growth in Infrastructure Investment and Industrialization
5.2.1.3 Increasing Urban Population
5.2.2 Opportunities
5.2.2.1 Rise in Construction Activities
5.2.3 Challenges
5.2.3.1 Varying Governmental Regulations Across Regions
5.2.3.2 Lack of Awareness About Concrete Surface Retarders
5.3 Macroeconomic Indicators
5.3.1 Rise in Population
5.3.2 Increase in Middle-Class Population, 2009�2030
5.3.3 Developing Economies: GDP (PPP) Growth, 2015
5.3.4 GDP & Contribution to the Construction Industry, By Country
6 Concrete Surface Retarders Market, By Raw Material (Page No. - 42)
6.1 Introduction
6.2 Organic Agents
6.3 Inorganic Agents
7 Concrete Surface Retarders Market, By Type (Page No. - 45)
7.1 Introduction
7.2 Water-Based
7.3 Solvent-Based
8 Concrete Surface Retarders Market, By Application (Page No. - 48)
8.1 Introduction
8.2 Commercial
8.3 Residential
9 Concrete Surface Retarders Market, By Region (Page No. - 52)
9.1 Introduction
9.2 Europe
9.2.1 Germany
9.2.2 UK
9.2.3 Italy
9.2.4 France
9.2.5 Russia
9.2.6 Rest of Europe
9.3 North America
9.3.1 US
9.3.2 Canada
9.3.3 Mexico
9.4 Asia Pacific
9.4.1 China
9.4.2 Japan
9.4.3 Australia
9.4.4 India
9.4.5 Rest of Asia Pacific
9.5 Middle East & Africa
9.5.1 Saudi Arabia
9.5.2 UAE
9.5.3 Turkey
9.5.4 South Africa
9.5.5 Rest of the Middle East & Africa
9.6 South America
9.6.1 Brazil
9.6.2 Argentina
9.6.3 Rest of South America
10 Competitive Landscape (Page No. - 89)
10.1 Overview
10.2 Market Ranking
11 Company Profiles (Page No. - 91)
(Overview, Financial*, Products & Services, Strategy, and Developments)
11.1 Sika
11.2 BASF
11.3 Cemex
11.4 GCP Applied Technologies
11.5 Fosroc
11.6 Mapei
11.7 The Euclid Chemical Company
11.8 W. R. Meadows
11.9 Parchem Construction Supplies
11.10 Russtech
11.11 Other Players
11.11.1 Reckli
11.11.2 TK Products
11.11.3 Chryso Group
11.11.4 Fabrino Produktionsgesellschaft Mbh & Co. Kg
11.11.5 Thermax
11.11.6 Chemmasters
11.11.7 Dayton Superior
11.11.8 Adomast Manufacturing
11.11.9 Larsen Building Products
11.11.10 Norsekem
11.11.11 Prime Exposure
11.11.12 Twin City Concrete Products
11.11.13 Interstar Materials
11.11.14 Fritz-Pak
11.11.15 Kingdom Products
11.11.16 Premiere Concrete Admixtures
*Details Might Not Be Captured in Case of Unlisted Companies
12 Appendix (Page No. - 115)
12.1 Discussion Guide
12.2 Knowledge Store: Marketsandmarkets Subscription Portal
12.3 Available Customizations
12.4 Related Reports
12.5 Author Details
List of Tables (83 Tables)
Table 1 Asia Pacific Urbanization Prospects
Table 2 North America: GDP, By Country, 2015�2022 (USD Billion)
Table 3 North America: Contribution of the Construction Industry to the GDP, By Country, 2014�2021 (USD Billion)
Table 4 Europe: GDP, By Country, 2015�2022 (USD Billion)
Table 5 Europe: Contribution of the Construction Industry to the GDP, By Country, 2014�2021 (USD Billion)
Table 6 Asia Pacific: GDP, By Country, 2015�2022 (USD Billion)
Table 7 Asia Pacific: Contribution of the Construction Industry to the GDP, By Country, 2014�2021 (USD Billion)
Table 8 Middle East & Africa: GDP, By Country, 2015�2022 (USD Billion)
Table 9 Middle East & Africa: Contribution of the Construction Industry to the GDP, By Country, 2014�2021 (USD Billion)
Table 10 South America: GDP, By Country, 2015�2022 (USD Billion)
Table 11 South America: Contribution of the Construction Industry to the GDP, By Country, 2014�2021 (USD Billion)
Table 12 Concrete Surface Retarders Market Size, By Raw Material, 2016�2023 (USD Million)
Table 13 Market By Size, By Raw Material, 2016�2023 (Million Liters)
Table 14 Market By Size, By Type, 2016�2023 (USD Million)
Table 15 Market By Size, By Type, 2016�2023 (Million Liters)
Table 16 Market By Size, By Application, 2016�2023 (USD Million)
Table 17 Market By Size, By Application, 2016�2023 (Million Liters)
Table 18 Market By Size, By Region, 2016�2023 (USD Million)
Table 19 Market By Size, By Region, 2016�2023 (Million Liters)
Table 20 Europe: Concrete Surface Retarders Market Size, By Country, 2016�2023 (USD Million)
Table 21 Europe: Market By Size, By Country, 2016�2023 (Million Liters)
Table 22 Europe: Market By Size, By Application, 2016�2023 (USD Million)
Table 23 Europe: Market By Size, By Application, 2016�2023 (Million Liters)
Table 24 Germany: Concrete Surface Retarder Market Size, By Application, 2016�2023 (USD Million)
Table 25 Germany: Market By Size, By Application, 2016�2023 (Million Liters)
Table 26 UK: Concrete Surface Retarders Market Size, By Application, 2016�2023 (USD Million)
Table 27 UK: Market By Size, By Application, 2016�2023 (Million Liters)
Table 28 Italy: Concrete Surface Retarders Market Size, By Application, 2016�2023 (USD Million)
Table 29 Italy: Market By Size, By Application, 2016�2023 (Million Liters)
Table 30 France: Concrete Surface Retarders Market Size, By Application, 2016�2023 (USD Million)
Table 31 France: Market By Size, By Application, 2016�2023 (Million Liters)
Table 32 Russia: Concrete Surface Retarders Market Size, By Application, 2016�2023 (USD Million)
Table 33 Russia: Market By Size, By Application, 2016�2023 (Million Liters)
Table 34 Rest of Europe: Concrete Surface Retarder Market Size, By Application, 2016�2023 (USD Million)
Table 35 Rest of Europe: Market By Size, By Application, 2016�2023 (Million Liters)
Table 36 North America: Market By Size, By Country, 2016�2023 (USD Million)
Table 37 North America: Market By Size, By Country, 2016�2023 (Million Liters)
Table 38 North America: Market By Size, By Application, 2016�2023 (USD Million)
Table 39 North America: Market By Size, By Application, 2016�2023 (Million Liters)
Table 40 US: Concrete Surface Retarders Market Size, By Application, 2016�2023 (USD Million)
Table 41 US: Market By Size, By Application, 2016�2023 (Million Liters)
Table 42 Canada: Concrete Surface Retarders Market Size, By Application, 2016�2023 (USD Million)
Table 43 Canada:Market By Size, By Application, 2016�2023 (Million Liters)
Table 44 Mexico: Concrete Surface Retarders Market Size, By Application, 2016�2023 (USD Million)
Table 45 Mexico: Market By Size, By Application, 2016�2023 (Million Liters)
Table 46 Asia Pacific: Concrete Surface Retarders Market Size, By Country, 2016�2023 (USD Million)
Table 47 Asia Pacific: Market By Size, By Country, 2016�2023 (Million Liters)
Table 48 Asia Pacific: Market By Size, By Application, 2016�2023 (USD Million)
Table 49 Asia Pacific: Market By Size, By Application, 2016�2023 (Million Liters)
Table 50 China: Concrete Surface Retarder Market Size, By Application, 2016�2023 (USD Million)
Table 51 China: Market By Size, By Application, 2016�2023 (Million Liters)
Table 52 Japan: Market By Size, By Application, 2016�2023 (USD Million)
Table 53 Japan: Market By Size, By Application, 2016�2023 (Million Liters)
Table 54 Australia: Concrete Surface Retarders Market Size, By Application, 2016�2023 (USD Million)
Table 55 Australia: Market By Size, By Application, 2016�2023 (Million Liters)
Table 56 India: Market By Market Size, By Application, 2016�2023 (USD Million)
Table 57 India: Market By Size, By Application, 2016�2023 (Million Liters)
Table 58 Rest of Asia Pacific: Concrete Surface Retarders Market Size, By Application, 2016�2023 (USD Million)
Table 59 Rest of Asia Pacific: Market By Size, By Application, 2016�2023 (Million Liters)
Table 60 Middle East & Africa: Market By Size, By Country, 2016�2023 (USD Million)
Table 61 Middle East & Africa: Market By Size, By Country, 2016�2023 (Million Liters)
Table 62 Middle East & Africa: Market By Size, By Application, 2016�2023 (USD Million)
Table 63 Middle East & Africa: Market By Size, By Application, 2016�2023 (Million Liters)
Table 64 Saudi Arabia: Concrete Surface Retarders Market Size, By Application, 2016�2023 (USD Million)
Table 65 Saudi Arabia: Market By Size, By Application, 2016�2023 (Million Liters)
Table 66 UAE: Market By Size, By Application, 2016�2023 (USD Million)
Table 67 UAE: Market By Size, By Application, 2016�2023 (Million Liters)
Table 68 Turkey: Market By Size, By Application, 2016�2023 (USD Million)
Table 69 Turkey: Market By Size, By Application, 2016�2023 (Million Liters)
Table 70 South Africa: Concrete Surface Retarder Market Size, By Application, 2016�2023 (USD Million)
Table 71 South Africa: Market By Size, By Application, 2016�2023 (Million Liters)
Table 72 Rest of the Middle East & Africa: Concrete Surface Retarders Market Size, By Application, 2016�2023 (USD Million)
Table 73 Rest of the Middle East & Africa: Market By Size, By Application, 2016�2023 (Million Liters)
Table 74 South America: Concrete Surface Retarders Market Size, By Country, 2016�2023 (USD Million)
Table 75 South America: Market By Size, By Country, 2016�2023 (Million Liters)
Table 76 South America: Market By Size, By Application, 2016�2023 (USD Million)
Table 77 South America: Market By Size, By Application, 2016�2023 (Million Liters)
Table 78 Brazil: Concrete Surface Retarders Market Size, By Application, 2016�2023 (USD Million)
Table 79 Brazil: Market By Size, By Application, 2016�2023 (Million Liters)
Table 80 Argentina: Market By Size, By Application, 2016�2023 (USD Million)
Table 81 Argentina: Market By Size, By Application, 2016�2023 (Million Liters)
Table 82 Rest of South America: Market By Size, By Application, 2016�2023 (USD Million)
Table 83 Rest of South America: Market By Size, By Application, 2016�2023 (Million Liters)
List of Figures (31 Figures)
Figure 1 Market Segmentation
Figure 2 Global Market: Research Design
Figure 3 Market Size Estimation Methodology: Bottom-Up Approach
Figure 4 Market Size Estimation Methodology: Top-Down Approach
Figure 5 Market: Data Triangulation
Figure 6 Organic Agents to Be the Larger Raw Material Segment Throughout the Forecast Period
Figure 7 By Type, Water-Based Segment Estimated to Dominate Market in 2018
Figure 8 Commercial Application Segment Estimated to Lead the Market in 2018
Figure 9 Europe Dominated the Concrete Surface Retarders Market in 2017
Figure 10 Market Growth Attributed to Growth of the Construction Industry in Developing as Well as Developed Regions
Figure 11 Organic Agents Segment to Dominate the Concrete Surface Retarders Market Through 2023
Figure 12 Solvent-Based Segment to Grow at A Higher CAGR During the Forecast Period
Figure 13 Commercial Application to Lead the Demand for Concrete Surface Retarders Through 2023
Figure 14 UK Market to Grow at the Highest CAGR During the Forecast Period
Figure 15 Growing Construction Industry Results in Increased Demand for Concrete Surface Retarders
Figure 16 Projected Per Capita GDP, By Country (USD Million)
Figure 17 By Market Size, By Raw Material, 2018 vs 2023 (USD Million)
Figure 18 Water-Based Segment Dominated the Concrete Surface Retarders Market in 2017, in Terms of Value
Figure 19 By Market Size, By Application, 2018 vs 2023 (USD Million)
Figure 20 Regional Snapshot: China Projected to Be the Fastest-Growing Country-Level Market From 2018 to 2023, in Terms of Value
Figure 21 Europe: Market Snapshot
Figure 22 North America: Market Snapshot
Figure 23 Market Ranking of Key Players, 2017
Figure 24 Sika: Company Snapshot
Figure 25 Sika: SWOT Analysis
Figure 26 BASF: Company Snapshot
Figure 27 BASF: SWOT Analysis
Figure 28 Cemex: Company Snapshot
Figure 29 Cemex: SWOT Analysis
Figure 30 GCP Applied Technologies: Company Snapshot
Figure 31 Mapei: Company Snapshot


Growth opportunities and latent adjacency in Concrete Surface Retarders Market