Compound Management Market by Product & Outsourcing Services (Instruments (Automated Storage, Decapper), Software), Sample (Chemical Compounds, Biological Samples), End User (Biopharma Companies, Biobank, Pharma Companies, CRO) - Global Forecasts to 2023


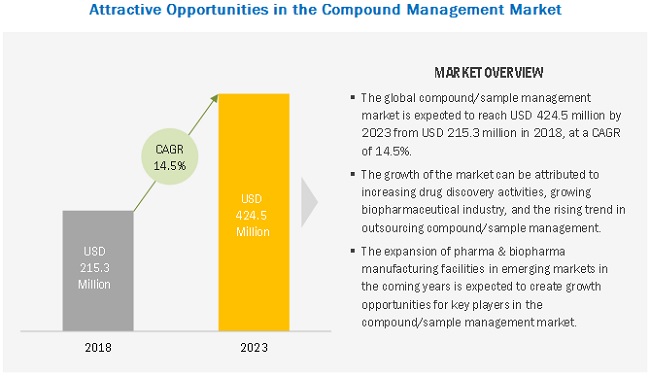
The global compound management market is projected to reach USD 424.5 million in 2023, at CAGR of 14.5%. The growth of the market can be attributed to increasing drug discovery activities, the growing biopharmaceutical industry, and the rising trend in outsourcing compound/sample management.
Compound management is the storage and management of chemical libraries and biosamples used for drug discovery research and clinical purposes. This process comprises multiple steps, including sample acquisition, storage, reformatting, assay plate preparation, and retrieval of a compound/sample.
“By sample type, the chemical compounds segment to account for the largest share during the forecast period.”
The rising drug discovery activity is leading to an increased demand for compounds, which is positively affecting market growth.
“By product & service, the outsourcing services segment is expected to register the highest CAGR during the forecast period.”
The outsourcing services segment is projected to register the highest CAGR during the forecast period. This high growth is due to the shift in trend towards outsourcing compound management to third-party service providers. These companies are experts in compound management and provide various services to pharmaceuticals, biopharmaceuticals, and CROs with regard to their compound storage needs, and are reasonably priced.
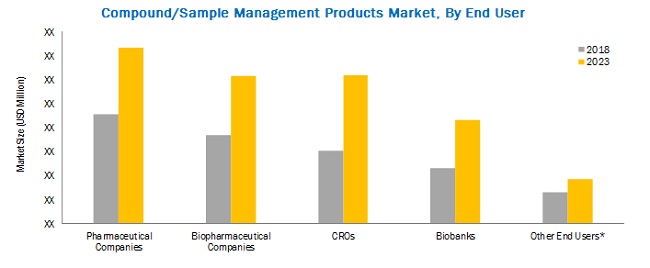
“By end-user, the pharmaceutical companies segment to account for the largest share in the compound/sample management products market.”
The rising drug discovery activity, coupled with increasing pharmaceutical companies, is the major factor driving the growth of the segment.
“North America to account for the largest share of the compound management market during the forecast period.”
The large share of North America is attributed to the presence of the large pharmaceutical and biopharma industry. As a result, several companies in North America are engaged in drug discovery activities, which require the maintenance of substantial chemical libraries. Moreover, to maintain the productivity of such innovative drugs and biologics, most of the leading pharma and biopharma companies have started building compound management facilities or contracting external service providers.
Market Dynamics
Driver: Growth of the biopharmaceutical industry
Biopharmaceuticals form the fastest-growing segment of the pharmaceutical industry. The growth of this sector will also support that of the sample management market, as increased biologic production will spur the demand for sample management. The growth of the biopharmaceuticals market is attributed to the increasing demand for biologics, the emergence of biosimilars, and increasing R&D expenditure in biopharmaceutical companies, as well as the increasing prevalence of chronic diseases. In addition, a focus on outsourcing functions to CROs and CMOs has allowed most biotech and biopharma companies to focus on core functions.
Restraint: Large capital investments required to establish compound management facilities
High capital investments are required to build a compound/sample management facility, including investment in both hardware and software, such as the installation of new automated liquid compound storage systems linked to a robust inventory database. The average cost of a large automated storage system, for example, ranges between USD 1 million and USD 10 million. The high capital requirements for setting up such facilities may put them out of reach for small or medium-size pharmaceutical companies. Research institutes with limited budgets also find it difficult to afford such instruments. As a result, the use of manual storage systems is still preferred among these end-users.
Opportunity: Expansion of pharma & biopharma manufacturing in emerging markets
Emerging markets such as India and China are expected to emerge as key hubs for pharma and biotech manufacturing. This can mainly be attributed to their low labor and raw material costs, rising life science research, government support, and technological integration and advancements. Governments of various Asian countries have been allocating large budgets to encourage research in the life sciences industry.
For instance, in 2014, the Indian government announced investments of up to USD 5 billion each year over the next five years to boost the biotechnology sector in the country. The Department of Biotechnology (DBT) and government-funded institutions like the National Biotechnology Board (NBTB) are working together to transform India into a global hub for biotechnology research.
Compound Management Market Scope
|
Report Metric |
Details |
|
Market size available for years |
2016–2023 |
|
Base year considered |
2017 |
|
Forecast period |
2018–2023 |
|
Forecast units |
USD million |
|
Segments covered |
Product & Service, Sample Type, End User and Region |
|
Geographies covered |
North America, Europe, APAC, and Rest of the World (RoW) |
|
Companies covered |
Brooks Automation (US), Hamilton Company (US), TTP Group (US), Labcyte (US), Biosero (US), and Tecan (Switzerland) Evotec (Germany), Wuxi AppTec (China), Icagen (US), TCG Lifescience (India), and Frontier Scientific (US) |
The research report categorizes the global compound management market into the following segments and sub segments:
By Product & Service
-
Products
- Instruments
- Software
- Outsourcing Services
By Sample Type
- Chemical Compounds
- Biosamples
By End User
- Products
- Services
By Region
- North America
- Europe
- Asia Pacific
- Rest of the World (RoW)
Compound Management Market Key Players
Brooks Automation (US), Hamilton Company (US), TTP Group (US), Labcyte (US), Biosero (US)
Recent Developments
- In 2018, Brooks Automation partnered with the Cleveland Clinic to open a new biobanking facility for Cleveland Clinic by utilizing Brooks' sample storage solutions.
- In 2018, Brooks Automation acquired BioSpeciMan Corporation to expand its consumer base, sample management services offering, and geographic footprint.
- In 2018, Tecan collaborated with DiaSorin to deploy its Tecan's Fluent Laboratory Automation Solution into its nucleic acid extraction platform.
- In 2017, Biosero completed the expansion of its new facility and relocated headquarters, its corporate office, R&D center, and production facilities in San Diego, CA.
- In 2016, Evotec signed a multi-year compound management agreement with Pierre Fabre Laboratories. Under the terms of the agreement, Evotec gained exclusive rights to manage Pierre Fabre's compound collection and compound management facility based at Toulouse, France.
Critical questions the report answers:
- Where will all these developments take the compound management market in the long term?
- What are the upcoming trends for the compound management market?
- Which segment in the compound management market provides the most opportunity for growth?
- Who are the leading vendors operating in the market?
- What are the opportunities for new market entrants in the compound management market?
Frequently Asked Questions (FAQ):
How big is the Compound Management Market ?
Compound Management Market worth $424.5 million in 2023.
What is the growth rate of Compound Management Market ?
Compound Management Market grows at a CAGR of 14.5% during the forecast period. .
To speak to our analyst for a discussion on the above findings, click Speak to Analyst
 Exclusive indicates content/data unique to MarketsandMarkets and not available with any competitors.
Table of Contents
1 Introduction (Page No. - 13)
1.1 Objectives of the Study
1.2 Market Definition
1.3 Market Scope
1.3.1 Years Covered for the Study
1.4 Currency
1.5 Limitations
1.6 Stakeholders
2 Research Methodology (Page No. - 16)
2.1 Research Data
2.1.1 Market Share Estimation
2.1.2 Primary Data
2.1.3 Key Industry Insights
2.1.4 Secondary Data
2.1.4.1 Secondary Sources
2.2 Market Size Estimation
2.3 Market Breakdown and Data Triangulation
3 Executive Summary (Page No. - 24)
4 Premium Insights (Page No. - 28)
4.1 Compound/Sample Management Market Overview
4.2 Europe: Compound/Sample Management Market, By Product & Service and Sample Type (2018)
4.3 Compound/Sample Management Services Market, By End User, 2016 vs 2023 (USD Million)
4.4 Geographical Snapshot of the Compound/Sample Management Market
5 Market Overview (Page No. - 32)
5.1 Introduction
5.2 Market Dynamics
5.2.1 Drivers
5.2.1.1 Increasing Drug Discovery Activity
5.2.1.2 Growth of the Biopharmaceutical Industry
5.2.1.3 Rising Outsourcing of Compound/Sample Management
5.2.1.4 Growth of the Biobanking Sector
5.2.2 Restraints
5.2.2.1 Large Capital Investments Required to Establish Compound Management Facilities
5.2.3 Opportunities
5.2.3.1 Expansion of Pharma & Biopharma Manufacturing in Emerging Markets
6 Compound/Sample Management Market, By Product & Service (Page No. - 36)
6.1 Introduction
6.2 Compound/Sample Management Products
6.2.1 Instruments
6.2.1.1 Automated Compound/Sample Storage Systems
6.2.1.2 Automated Liquid Handling Systems
6.2.1.3 Other Compound/Sample Management Systems
6.2.2 Software
6.3 Outsourcing Services
7 Compound/Sample Management Market, By Sample Type (Page No. - 43)
7.1 Introduction
7.2 Chemical Compounds
7.3 Biosamples
8 Compound/Sample Management Market, By End User (Page No. - 47)
8.1 Introduction
8.2 Compound/Sample Management Products Market, By End User
8.2.1 Pharmaceutical Companies
8.2.2 Biopharmaceutical Companies
8.2.3 Contract Research Organizations
8.2.4 Biobanks
8.2.5 Other End Users
8.3 Compound/Sample Management Outsourcing Services Market, By End User
8.3.1 Pharmaceutical Companies
8.3.2 Biopharmaceutical Companies
8.3.3 Other End Users
9 Compound/Sample Management Market, By Region (Page No. - 61)
9.1 Introduction
9.2 North America
9.2.1 US
9.2.2 Canada
9.3 Europe
9.3.1 Germany
9.3.2 UK
9.3.3 Rest of Europe
9.4 Asia Pacific
9.5 Rest of the World
10 Competitive Landscape (Page No. - 87)
10.1 Market Overview
10.2 Market Ranking Analysis, 2017
10.3 Competitive Situation and Trends
10.3.1 Acquisitions
10.3.2 Product Launches & Approvals
10.3.3 Collaborations, Agreements, & Partnerships
10.3.4 Expansions
11 Company Profiles (Page No. - 91)
(Business Overview, Products Offered, Recent Developments, MnM View)*
11.1 Brooks Automation
11.2 Tecan
11.3 Hamilton Company
11.4 TTP Group
11.5 Labcyte
11.6 Biosero
11.7 Evotec
11.8 Icagen
11.9 Wuxi Apptec
11.10 TCG Lifesciences
11.11 Frontier Scientific
*Business Overview, Products Offered, Recent Developments, MnM View Might Not Be Captured in Case of Unlisted Companies.
12 Appendix (Page No. - 111)
12.1 Insights of Industry Experts
12.2 Discussion Guide
12.3 Knowledge Store: Marketsandmarkets’ Subscription Portal
12.4 Available Customizations
12.5 Related Reports
12.6 Author Details
List of Tables (95 Tables)
Table 1 By Product & Service, 2016–2023 (USD Million)
Table 2 Compound/Sample Management Products Market, By Type, 2016–2023 (USD Million)
Table 3 Compound/Sample Management Products Market, By Region, 2016–2023 (USD Million)
Table 4 North America: Compound/Sample Management Products Market, By Country, 2016–2023 (USD Million)
Table 5 Europe: Compound/Sample Management Products Market, By Country, 2016–2023 (USD Million)
Table 6 Compound/Sample Management Instruments Market, By Type, 2016–2023 (USD Million)
Table 7 Compound/Sample Management Outsourcing Services Market, By Region, 2016–2023 (USD Million)
Table 8 North America: Compound/Sample Management Outsourcing Services Market, By Country, 2016–2023 (USD Million)
Table 9 Europe: Compound/Sample Management Outsourcing Services Market, By Country, 2016–2023 (USD Million)
Table 10 Compound/Sample Management Market, By Sample Type, 2016–2023 (USD Million)
Table 11 Compound/Sample Management Market for Chemical Compounds, By Region, 2016–2023 (USD Million)
Table 12 North America: Compound/Sample Management Market for Chemical Compounds, By Country, 2016–2023 (USD Million)
Table 13 Europe: Compound/Sample Management Market for Chemical Compounds, By Country, 2016–2023 (USD Million)
Table 14 Compound/Sample Management Market for Biosamples, By Region, 2016–2023 (USD Million)
Table 15 North America: Compound/Sample Management Market for Biosamples, By Country, 2016–2023 (USD Million)
Table 16 Europe: Compound/Sample Management Market for Biosamples, By Country, 2016–2023 (USD Million)
Table 17 Compound/Sample Management Products Market, By End User, 2016–2023 (USD Million)
Table 18 Compound/Sample Management Products Market for Pharmaceutical Companies, By Region, 2016–2023 (USD Million)
Table 19 North America: Compound/Sample Management Products Market for Pharmaceutical Companies, By Country, 2016–2023 (USD Million)
Table 20 Europe: Compound/Sample Management Products Market for Pharmaceutical Companies, By Country, 2016–2023 (USD Million)
Table 21 Compound/Sample Management Products Market for Biopharmaceutical Companies, By Region, 2016–2023 (USD Million)
Table 22 North America: Compound/Sample Management Products Market for Biopharmaceutical Companies, By Country, 2016–2023 (USD Million)
Table 23 Europe: Compound/Sample Management Products Market for Biopharmaceutical Companies, By Country, 2016–2023 (USD Million)
Table 24 Compound/Sample Management Products Market for Contract Research Organizations, By Region, 2016–2023 (USD Million)
Table 25 North America: Compound/Sample Management Products Market for Contract Research Organizations, By Country, 2016–2023 (USD Million)
Table 26 Europe: Compound/Sample Management Products Market for Contract Research Organizations, By Country, 2016–2023 (USD Million)
Table 27 Compound/Sample Management Products Market for Biobanks, By Region, 2016–2023 (USD Million)
Table 28 North America: Compound/Sample Management Products Market for Biobanks, By Country, 2016–2023 (USD Million)
Table 29 Europe: Compound/Sample Management Products Market for Biobanks, By Country, 2016–2023 (USD Million)
Table 30 Compound/Sample Management Products Market for Other End Users, By Region, 2016–2023 (USD Million)
Table 31 North America: Compound/Sample Management Products Market for Other End Users, By Country, 2016–2023 (USD Million)
Table 32 Europe: Compound/Sample Management Products Market for Other End Users, By Country, 2016–2023 (USD Million)
Table 33 Compound/Sample Management Outsourcing Services Market, By End User, 2016–2023 (USD Million)
Table 34 Compound/Sample Management Outsourcing Services Market for Pharmaceutical Companies, By Region, 2016–2023 (USD Million)
Table 35 North America: Compound/Sample Management Outsourcing Services Market for Pharmaceutical Companies, By Country, 2016–2023 (USD Million)
Table 36 Europe: Compound/Sample Management Outsourcing Services Market for Pharmaceutical Companies, By Country, 2016–2023 (USD Million)
Table 37 Compound/Sample Management Outsourcing Services Market for Biopharmaceutical Companies, By Region, 2016–2023 (USD Million)
Table 38 North America: Compound/Sample Management Outsourcing Services Market for Biopharmaceutical Companies, By Country, 2016–2023 (USD Million)
Table 39 Europe: Compound/Sample Management Outsourcing Services Market for Biopharmaceutical Companies, By Country, 2016–2023 (USD Million)
Table 40 Compound/Sample Management Outsourcing Services Market for Other End Users, By Region, 2016–2023 (USD Million)
Table 41 North America: Compound/Sample Management Outsourcing Services Market for Other End Users, By Country, 2016–2023 (USD Million)
Table 42 Europe: Compound/Sample Management Outsourcing Services Market for Other End Users, By Country, 2016–2023 (USD Million)
Table 43 Compound/Sample Management Market, By Region, 2016–2023 (USD Million)
Table 44 North America: Compound/Sample Management Market, By Country, 2016–2023 (USD Million)
Table 45 North America: Compound/Sample Management Market, By Product & Service, 2016–2023 (USD Million)
Table 46 North America: Compound/Sample Management Products Market, By Type, 2016–2023 (USD Million)
Table 47 North America: Compound/Sample Management Market, By Sample Type, 2016–2023 (USD Million)
Table 48 North America: Compound/Sample Management Products Market, By End User, 2016–2023 (USD Million)
Table 49 North America: Compound/Sample Management Outsourcing Services Market, By End User, 2016–2023 (USD Million)
Table 50 US: Compound/Sample Management Market, By Product & Service, 2016–2023 (USD Million)
Table 51 US: Compound/Sample Management Products Market, By Type, 2016–2023 (USD Million)
Table 52 US: Compound/Sample Management Market, By Sample Type, 2016–2023 (USD Million)
Table 53 US: Compound/Sample Management Products Market, By End User, 2016–2023 (USD Million)
Table 54 US: Compound/Sample Management Outsourcing Services Market, By End User, 2016–2023 (USD Million)
Table 55 Canada: Compound/Sample Management Market, By Product & Service, 2016–2023 (USD Million)
Table 56 Canada: Compound/Sample Management Products Market, By Type, 2016–2023 (USD Million)
Table 57 Canada: Compound/Sample Management Market, By Sample Type, 2016–2023 (USD Million)
Table 58 Canada: Compound/Sample Management Products Market, By End User, 2016–2023 (USD Million)
Table 59 Canada: Compound/Sample Management Outsourcing Services Market, By End User, 2016–2023 (USD Million)
Table 60 Europe: Compound/Sample Management Market, By Country, 2016–2023 (USD Million)
Table 61 Europe: Compound/Sample Management Market, By Product & Service, 2016–2023 (USD Million)
Table 62 Europe: Compound/Sample Management Products Market, By Type, 2016–2023 (USD Million)
Table 63 Europe: Compound/Sample Management Market, By Sample Type, 2016–2023 (USD Million)
Table 64 Europe: Compound/Sample Management Products Market, By End User, 2016–2023 (USD Million)
Table 65 Europe: Compound/Sample Management Outsourcing Services Market, By End User, 2016–2023 (USD Million)
Table 66 Germany: Compound/Sample Management Market, By Product & Service, 2016–2023 (USD Million)
Table 67 Germany: Compound/Sample Management Products Market, By Type, 2016–2023 (USD Million)
Table 68 Germany: Compound/Sample Management Market, By Sample Type, 2016–2023 (USD Million)
Table 69 Germany: Compound/Sample Management Products Market, By End User, 2016–2023 (USD Million)
Table 70 Germany: Compound/Sample Management Outsourcing Services Market, By End User, 2016–2023 (USD Million)
Table 71 UK: Compound/Sample Management Market, By Product & Service, 2016–2023 (USD Million)
Table 72 UK: Compound/Sample Management Products Market, By Type, 2016–2023 (USD Million)
Table 73 UK: Compound/Sample Management Market, By Sample Type, 2016–2023 (USD Million)
Table 74 UK: Compound/Sample Management Products Market, By End User, 2016–2023 (USD Million)
Table 75 UK: Compound/Sample Management Outsourcing Services Market, By End User, 2016–2023 (USD Million)
Table 76 RoE: Compound/Sample Management Market, By Product & Service, 2016–2023 (USD Million)
Table 77 RoE: Compound/Sample Management Products Market, By Type, 2016–2023 (USD Million)
Table 78 RoE: Compound/Sample Management Market, By Sample Type, 2016–2023 (USD Million)
Table 79 RoE: Compound/Sample Management Products Market, By End User, 2016–2023 (USD Million)
Table 80 RoE: Compound/Sample Management Outsourcing Services Market, By End User, 2016–2023 (USD Million)
Table 81 APAC: Compound/Sample Management Market, By Product & Service, 2016–2023 (USD Million)
Table 82 APAC: Compound/Sample Management Products Market, By Type, 2016–2023 (USD Million)
Table 83 APAC: Compound/Sample Management Market, By Sample Type, 2016–2023 (USD Million)
Table 84 APAC: Compound/Sample Management Products Market, By End User, 2016–2023 (USD Million)
Table 85 APAC: Compound/Sample Management Outsourcing Services Market, By End User, 2016–2023 (USD Million)
Table 86 RoW: Compound/Sample Management Market, By Product & Service, 2016–2023 (USD Million)
Table 87 RoW: Compound/Sample Management Products Market, By Type, 2016–2023 (USD Million)
Table 88 RoW: Compound/Sample Management Market, By Sample Type, 2016–2023 (USD Million)
Table 89 RoW: Compound/Sample Management Products Market, By End User, 2016–2023 (USD Million)
Table 90 RoW: Compound/Sample Management Outsourcing Services Market, By End User, 2016–2023 (USD Million)
Table 91 Rank of Companies in the Global Compound/Sample Management Market, 2017
Table 92 Acquisitions, 2015–2017
Table 93 Product Launches & Approvals, 2015–2017
Table 94 Collaborations, Agreements, & Partnerships, 2015 & 2017
Table 95 Expansions, 2015 to 2017
List of Figures (24 Figures)
Figure 1 Research Design
Figure 2 Breakdown of Primary Interviews: By Company Type, Designation, and Region
Figure 3 Bottom-Up Approach
Figure 4 Top-Down Approach
Figure 5 Data Triangulation
Figure 6 Compound/Sample Management Market, By Product & Service, 2018 vs 2023 (USD Million)
Figure 7 Compound/Sample Management Market, By Sample Type, 2018 vs 2023 (USD Million)
Figure 8 Compound/Sample Management Products Market, By End User, 2018 vs 2023 (USD Million)
Figure 9 Compound/Sample Management Services Market, By End User, 2018 vs 2023 (USD Million)
Figure 10 Geographical Snapshot of the Compound/Sample Management Market
Figure 11 Increasing Drug Discovery Activities to Drive Market Growth
Figure 12 Compound/Sample Management Products to Hold the Larger Share of the Market in 2018
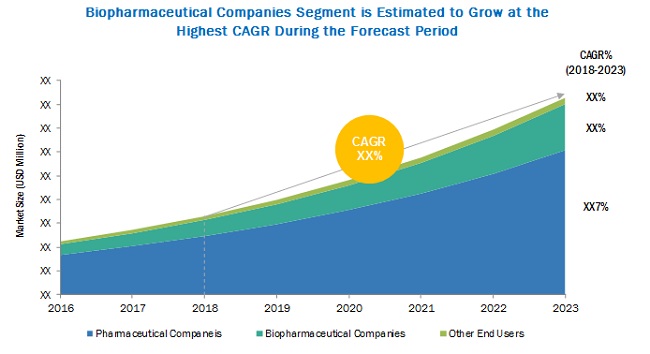
Figure 13 Biopharmaceutical Companies Segment is Estimated to Growth at the Highest CAGR During the Forecast Period
Figure 14 APAC is Expected to Be the Fastest Growing Market From 2018 to 2023
Figure 15 Compound/Sample Management Market: Drivers, Restraints, Opportunities, and Challenges
Figure 16 R&D Spending Patterns, 2005–2015
Figure 17 Compound/Sample Management Market: Geographic Snapshot (2018)
Figure 18 North America: Compound/Sample Management Market Snapshot
Figure 19 Asia Pacific: Compound/Sample Management Market Snapshot
Figure 20 Key Developments Registered By Leading Players in the Compound/Sample Management Market, 2015–2018
Figure 21 Brooks Automation: Company Snapshot (2017)
Figure 22 Tecan: Company Snapshot (2017)
Figure 23 Evotec: Company Snapshot (2017)
Figure 24 Icagen: Company Snapshot (2017)

 Generating Response ...


Growth opportunities and latent adjacency in Compound Management Market