Color Concentrates Market by Form (Solid and Liquid), End-Use Industry (Packaging, Consumer Goods, Building & Construction, Automotive), Region (Asia-Pacific, Europe, Middle East & Africa, North America, South America) - Global Forecast to 2021


[143 Pages Report] The Color Concentrates Market was valued at USD 4.24 Billion in 2016 and is projected to reach USD 5.80 Billion by 2021, at a CAGR of 6.5% from 2016 to 2021. The high demand for color concentrates in plastics and packaging industries is driving the growth of the color concentrates market across the globe.
Objectives of the Study
- To define, describe, and forecast the color concentrates market on the basis of form and end-use industry
- To analyze and forecast the size of the color concentrates market, in terms of volume and value
- To provide detailed information about the key factors, such as drivers, restraints, opportunities, and challenges influencing the growth of the color concentrates market
- To strategically analyze the micromarkets with respect to individual growth trends, growth prospects, and their contribution to the color concentrates market
- To forecast the size of the color concentrates market with respect to five main regions, namely, North America, Europe, Asia-Pacific, the Middle East & Africa, and South America
- To analyze competitive developments, such as joint ventures, mergers & acquisitions, new product launches, regional expansions, and R&D activities in the color concentrates market
- To analyze the opportunities in the color concentrates market for stakeholders and provide a competitive landscape for the market leaders
- To strategically profile the key players in the color concentrates market and comprehensively analyze their market shares and core competencies
Years considered for this report
2015 � Base Year
2016 � Estimated Year
2021 � Projected Year
Research Methodology
This study estimates the size of the color concentrates market for 2016 and projects its growth by 2021. It provides a detailed qualitative and quantitative analysis of the color concentrates market. Secondary sources, such as Hoovers, Bloomberg BusinessWeek, and Factiva, among others have been used to identify and collect information useful for this extensive, commercial study of the color concentrates market. Primary sources such as experts from related industries and suppliers of color concentrates have been interviewed to obtain and verify critical information and assess future prospects of the color concentrates market.
To know about the assumptions considered for the study, download the pdf brochure
The key manufacturers of color concentrates are Clariant (Switzerland), PolyOne Corporation (U.S.), A. Schulman, Inc. (U.S.), Ampacet Corporation (U.S.), Ferro Corporation (U.S.), Breen Color Concentrates (U.S.), Hudson Color Concentrates (U.S.), Penn Color, Inc. (U.S.), Colortech Inc. (U.S.), and Plasticoncentrates, Inc. (U.S.), among others.
Target Audience:
- Manufacturers of Color Concentrates
- Chemical Suppliers
- Traders, Distributors, and Suppliers of Color Concentrates
- Raw Material Suppliers
- Government and Research Organizations
- Industry Associations
�This study answers several questions for stakeholders, primarily which market segments they should focus upon during the next two to five years to prioritize their efforts and investments. It also provides a competitive landscape of the color concentrates market�.
Scope of the Report:
The color concentrates market has been segmented as follows:
Color Concentrates Market, by Form:
- Solid
- Liquid
Color Concentrates Market, by End-Use Industry:
- Packaging
- Consumer Goods
- Building & Construction
- Automotive
- Others
Color Concentrates Market, by Region:
- Asia-Pacific
- Europe
- North America
- Middle East & Africa
- South America
The market has further been analyzed for the key countries in each of these regions.
Available Customizations
Along with the market data, MarketsandMarkets offers customizations as per specific needs of the companies. The following customization options are available for this report:
Product Analysis
- A product matrix that provides a detailed comparison of the product portfolio of each company
Regional Analysis
- Further breakdown of the rest of Asia-Pacific color concentrates market into Australia and New Zealand
The color concentrates market is projected to reach USD 5.80 Billion by 2021, at a CAGR of 6.5% from 2016 to 2021. The color concentrates market has witnessed high growth in the recent years, and this growth is projected to continue in the near future, owing to increase in demand for color concentrates in various end-use industries, such as packaging, consumer goods, building & construction, and automotive, among others. The growing demand for plastics in various industries is also a driver for the growth of the color concentrates market.
On the basis of form, the color concentrates market has been classified into solid and liquid. The solid segment is leading the color concentrates market. The growth of this segment of the market can be attributed to various properties offered by solid color concentrates, which include low price, less let down ratio, inexpensive investments, dry nature, ease of transportation and storage, excellent color control, and reduced waste, among others. The liquid segment of the color concentrates market is projected to grow at the highest CAGR during the forecast period. Rapid color development, reduced energy consumption in their manufacturing, low material costs, enhanced color dispersion, accuracy in metering, and high color consistency are the properties offered by liquid color concentrates that have led to the growth of the liquid segment of the color concentrates market.
On the basis of end-use industry, the color concentrates market has been classified into packaging, consumer goods, building & construction, automotive, and others. The packaging end-use industry is leading the color concentrates market and is projected to grow at the highest CAGR during the forecast period. The growth of the packaging end-use industry of the color concentrates market is due to increased demand for color concentrates for coloring plastics used for lightweight packaging.
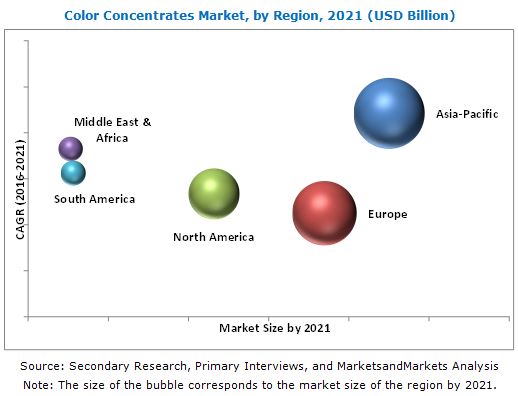
Based on region, the color concentrates market has been segmented into Asia-Pacific, North America, Europe, the Middle East & Africa, and South America. The Asia-Pacific color concentrates market is projected to grow at the highest CAGR during the forecast period, owing to the increasing demand for color concentrates in the medical, pharmaceuticals, cosmetics, and food & beverages packaging.
The key restraining factors for the color concentrates market is the high cost involved in the color matching process and increasing demand for pre-colored compounds. This is expected to trigger innovations in the color concentrates market as manufacturers of color concentrates would take initiatives to manufacture color concentrates that are cost-effective. Moreover, companies such as, Clariant (Switzerland), PolyOne Corporation (U.S.), A. Schulman, Inc. (U.S.), Ampacet Corporation (U.S.), Ferro Corporation (U.S.), Breen Color Concentrates (U.S.), Hudson Color Concentrates (U.S.), Penn Color, Inc. (U.S.), Colortech Inc. (U.S.), and Plasticoncentrates, Inc. (U.S.), among others are investing in R&D activities to launch new products and strengthen their positions in the color concentrates market.
To speak to our analyst for a discussion on the above findings, click Speak to Analyst
 Exclusive indicates content/data unique to MarketsandMarkets and not available with any competitors.
Table of Contents
1 Introduction (Page No. - 15)
1.1 Objectives of the Study
1.2 Market Definition
1.3 Market Scope
1.3.1 Markets Covered
1.3.2 Years Considered for the Study
1.4 Currency
1.4.1 Package Size
1.5 Research Limitations
1.6 Stakeholders
2 Research Methodology (Page No. - 19)
2.1 Research Data
2.1.1 Secondary Data
2.1.1.1 Key Data From Secondary Sources
2.1.2 Primary Data
2.1.2.1 Key Data From Primary Sources
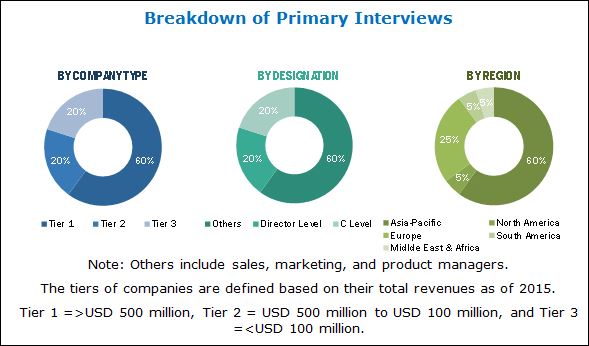
2.1.2.2 Breakdown of Primary Interviews
2.2 Market Size Estimation
2.2.1 Bottom-Up Approach
2.2.2 Top-Down Approach
2.3 Data Triangulation
2.4 Research Assumptions
3 Executive Summary (Page No. - 27)
4 Premium Insights (Page No. - 32)
4.1 Significant Opportunities in the Color Concentrates Market
4.2 Color Concentrates Market, By End-Use Industry
4.3 Color Concentrates Market, By Form and Region
4.4 Color Concentrates Market, By Region
4.5 Color Concentrates Market, By Form
5 Market Overview (Page No. - 37)
5.1 Introduction
5.2 Impact Analysis
5.3 Market Dynamics
5.3.1 Drivers
5.3.1.1 Increasing Demand for Plastics
5.3.1.2 Growing Importance of Aesthetics in Packaging
5.3.1.3 Industrialization in Emerging Economies
5.3.2 Restraints
5.3.2.1 Increased Costs Due to Color Matching
5.3.2.2 Competition From Pre-Colored Compounds
5.3.3 Opportunities
5.3.3.1 Introduction of Universal Carrier Resins
5.3.4 Challenges
5.3.4.1 Recycling of Plastics
5.4 Value Chain Analysis
5.4.1 R&D
5.4.2 Manufacturing
5.4.3 Distribution, Marketing & Sales
5.4.4 End-Use Industries
5.5 Porter�s Five Forces Analysis
5.5.1 Threat of New Entrants
5.5.2 Threat of Substitutes
5.5.3 Bargaining Power of Buyers
5.5.4 Bargaining Power of Suppliers
5.5.5 Intensity of Competitive Rivalry
6 Macroeconomic Indicators (Page No. - 47)
6.1 Introduction
6.2 GDP Growth Rate Forecast of Major Economies
6.3 Textile Industry
6.4 Automotive Production, By Region/Country, 2011�2015 (Million Unit)
6.5 Trends and Forecast of Construction Industry
6.5.1 Trends and Forecast of Construction Industry in North America
6.5.2 Trends and Forecast of Construction Industry in Europe
6.5.3 Trends and Forecast of Construction Industry in Asia-Pacific
7 Various Resin Types Used to Manufacture Color Concentrates Introduction (Page No. - 52)
7.1 Polyethylene
7.1.1 Lldpe
7.1.2 Ldpe
7.1.3 Hdpe
7.2 Polypropylene
7.3 Polystyrene
7.4 Others
8 Color Concentrates Market, By Form (Page No. - 54)
8.1 Introduction
8.2 Solid Color Concentrates
8.3 Liquid Color Concentrates
9 Color Concentrates Market, By End-Use Industry (Page No. - 58)
9.1 Introduction
9.2 Packaging
9.2.1 Food & Beverage Packaging
9.2.2 Healthcare & Pharmaceutical Packaging
9.2.3 Consumer Goods Packaging
9.2.4 Other Packaging
9.3 Building & Construction
9.3.1 Exterior
9.3.2 Interior
9.3.3 Others (Agriculture Structure Construction, Pipes, and Tunnels)
9.4 Consumer Goods
9.4.1 Sports & Leisure
9.4.2 Furniture
9.4.3 Electronic Goods
9.4.4 Others
9.5 Automotive
9.5.1 Interior
9.5.2 Exterior
9.6 Others
9.6.1 Healthcare
9.6.2 Electronics
9.6.3 Textiles
10 Color Concentrates Market, By Region (Page No. - 64)
10.1 Introduction
10.2 Asia-Pacific
10.2.1 China
10.2.2 India
10.2.3 Japan
10.2.4 Australia
10.2.5 South Korea
10.2.6 Taiwan
10.2.7 Rest of Asia-Pacific
10.3 North America
10.3.1 U.S.
10.3.2 Canada
10.3.3 Mexico
10.4 Europe
10.4.1 Germany
10.4.2 U.K.
10.4.3 Italy
10.4.4 France
10.4.5 Spain
10.4.6 Benelux
10.4.7 Poland
10.4.8 Others
10.5 Middle-East & Africa
10.5.1 Saudi Arabia
10.5.2 UAE
10.6 South America
10.6.1 Brazil
10.6.2 Argentina
11 Competitive Landscape (Page No. - 105)
11.1 Overview
11.2 Overview
11.2.1 Dynamic
11.2.2 Innovators
11.2.3 Vanguards
11.2.4 Emerging
11.3 Product Offerings
11.4 Business Strategy
11.5 Competitive Benchmarking
11.5.1 Geographical Presence
11.5.2 Product Portfolio
11.5.3 Recent Developments
11.5.4 Revenue
11.5.5 Patents
11.5.6 Specialization
11.5.7 Presence in Emerging Economies
11.5.8 Number of Employees
11.5.9 Legacy
11.5.10 Core Competency
12 Company Profile (Page No. - 112)
(Overview, Financial*, Products & Services, Strategy, and Developments)
12.1 Clariant
12.2 Polyone Corporation
12.3 A. Schulman, Inc.
12.4 Ampacet Corporation
12.5 Ferro Corporation
12.6 Breen Color Concentrates
12.7 Colortech Inc.
12.8 Hudson Color Concentrates
12.9 Penn Color, Inc.
12.10 Plasticoncentrates, Inc.
*Details Might Not Be Captured in Case of Unlisted Companies.
13 Appendix (Page No. - 136)
13.1 Insights From Industry Experts
13.2 Discussion Guide
13.3 Knowledge Store: Marketsandmarkets Subscription Portal
13.4 Introducing RT: Real-Time Market Intelligence
13.5 Available Customizations
13.6 Related Reports
13.7 Author Details
List of Tables (81 Tables)
Table 1 Trends and Forecast of GDP Growth Rates From 2016 to 2021
Table 2 Contribution of Construction Industry to GDP in North America, 2014�2021 (USD Million)
Table 3 Contribution of Construction Industry to GDP in Europe, 2014�2021 (USD Million)
Table 4 Contribution of Construction Industry to GDP in Asia-Pacific, 2014�2021 (USD Million)
Table 5 Color Concentrates Market Size, By Form, 2014�2021 (Kiloton)
Table 6 Color Concentrates Market Size, By Form, 2014�2021 (USD Million)
Table 7 Color Concentrates Market Size, By End-Use Industry, 2014�2021 (Kiloton)
Table 8 Color Concentrates Market Size, By End-Use Industry, 2014�2021 (USD Million)
Table 9 Global Color Concentrates Market Size, By Region, 2014�2021 (Kiloton)
Table 10 Global Color Concentrates Market Size, By Region, 2014�2021 (USD Million)
Table 11 Asia-Pacific: Color Concentrates Market Size, By Country, 2014�2021 (Kiloton)
Table 12 Asia-Pacific: Color Concentrates Market Size, By Country, 2014�2021 (USD Million)
Table 13 Asia-Pacific: Color Concentrates Market Size, By Form, 2014�2021 (Kiloton)
Table 14 Asia-Pacific: Color Concentrates Market Size, By Form, 2014�2021 (USD Million)
Table 15 Asia-Pacific: Color Concentrates Market Size, By End-Use Industry, 2014�2021 (Kiloton)
Table 16 Asia-Pacific: Color Concentrates Market Size, By End-Use Industry, 2014�2021 (USD Million)
Table 17 China: Color Concentrates Market Size, By End-Use Industry, 2014�2021 (Kiloton)
Table 18 China: Color Concentrates Market Size, By End-Use Industry, 2014�2021 (USD Million)
Table 19 India: Color Concentrates Market Size, By End-Use Industry, 2014�2021 (Kiloton)
Table 20 India: Color Concentrates Market Size, By End-Use Industry, 2014�2021 (USD Million)
Table 21 Japan: Color Concentrates Market Size, By End-Use Industry, 2014�2021 (Kiloton)
Table 22 Japan: Color Concentrates Market Size, By End-Use Industry, 2014�2021 (USD Million)
Table 23 Australia: Color Concentrates Market Size, By End-Use Industry, 2014�2021 (Kiloton)
Table 24 Australia: Color Concentrates Market Size, By End-Use Industry, 2014�2021 (USD Million)
Table 25 South Korea: Color Concentrates Market Size, By End-Use Industry, 2014�2021 (Kiloton)
Table 26 South Korea: Color Concentrates Market Size, By End-Use Industry, 2014�2021 (USD Million)
Table 27 Taiwan: Color Concentrates Market Size, By End-Use Industry, 2014�2021 (Kiloton)
Table 28 Taiwan: Color Concentrates Market Size, By End-Use Industry, 2014�2021 (USD Million)
Table 29 North America: Color Concentrates Market Size, By Country, 2014�2021 (Kiloton)
Table 30 North America: Color Concentrates Market Size, By Country, 2014�2021 (USD Million)
Table 31 North America: Color Concentrates Market Size, By Form, 2014�2021 (Kiloton)
Table 32 North America: Color Concentrates Market Size, By Form, 2014�2021 (USD Million)
Table 33 North America: Color Concentrates Market Size, By End-Use Industry, 2014�2021 (Kiloton)
Table 34 North America: Color Concentrates Market Size, By End-Use Industry, 2014�2021 (USD Million)
Table 35 U.S.: Color Concentrates Market Size, By End-Use Industry, 2014�2021 (Kiloton)
Table 36 U.S.: Color Concentrates Market Size, By End-Use Industry, 2014�2021 (USD Million)
Table 37 Canada: Color Concentrates Market Size, By End-Use Industry, 2014�2021 (Kiloton)
Table 38 Canada: Color Concentrates Market Size, By End-Use Industry, 2014�2021 (USD Million)
Table 39 Mexico: Color Concentrates Market Size, By End-Use Industry, 2014�2021 (Kiloton)
Table 40 Mexico: Color Concentrates Market Size, By End-Use Industry, 2014�2021 (USD Million)
Table 41 Europe: Color Concentrates Market Size, By Country, 2014�2021 (Kiloton)
Table 42 Europe: Color Concentrates Market Size, By Country, 2014�2021 (USD Million)
Table 43 Europe: Color Concentrates Market Size, By Form, 2014�2021 (Kiloton)
Table 44 Europe: Color Concentrates Market Size, By Form, 2014�2021 (USD Million)
Table 45 Europe: Color Concentrates Market Size, By End-Use Industry, 2014�2021 (Kiloton)
Table 46 Europe: Color Concentrates Market Size, By End-Use Industry, 2014�2021 (USD Million)
Table 47 Germany: Color Concentrates Market Size, By End-Use Industry, 2014�2021 (Kiloton)
Table 48 Germany: Color Concentrates Market Size, By End-Use Industry, 2014�2021 (USD Million)
Table 49 U.K.: Color Concentrates Market Size, By End-Use Industry, 2014�2021 (Kiloton)
Table 50 U.K.: Color Concentrates Market Size, By End-Use Industry, 2014�2021 (USD Million)
Table 51 Italy: Color Concentrates Market Size, By End-Use Industry, 2014�2021 (Kiloton)
Table 52 Italy: Color Concentrates Market Size, By End-Use Industry, 2014�2021 (USD Million)
Table 53 France: Color Concentrates Market Size, By End-Use Industry, 2014�2021 (Kiloton)
Table 54 France: Color Concentrates Market Size, By End-Use Industry, 2014�2021 (USD Million)
Table 55 Spain: Color Concentrates Market Size, By End-Use Industry, 2014�2021 (Kiloton)
Table 56 Spain: Color Concentrates Market Size, By End-Use Industry, 2014�2021 (USD Million)
Table 57 Benelux: Color Concentrates Market Size, By End-Use Industry, 2014�2021 (Kiloton)
Table 58 Benelux: Color Concentrates Market Size, By End-Use Industry, 2014�2021 (USD Million)
Table 59 Poland: Color Concentrates Market Size, By End-Use Industry, 2014�2021 (Kiloton)
Table 60 Poland: Color Concentrates Market Size, By End-Use Industry, 2014�2021 (USD Million)
Table 61 Middle East & Africa: Color Concentrates Market Size, By Country, 2014�2021 (Kiloton)
Table 62 Middle East & Africa: Color Concentrates Market Size, By Country, 2014�2021 (USD Million)
Table 63 Middle East & Africa: Color Concentrates Market Size, By Form, 2014�2021 (Kiloton)
Table 64 Middle East & Africa: Color Concentrates Market Size, By Form, 2014�2021 (USD Million)
Table 65 Middle East & Africa: Color Concentrates Market Size, By End-Use Industry, 2014�2021 (Kiloton)
Table 66 Middle East & Africa: Color Concentrates Market Size, By End-Use Industry, 2014�2021 (USD Million)
Table 67 Saudi Arabia: Color Concentrates Market Size, By End-Use Industry, 2014�2021 (Kiloton)
Table 68 Saudi Arabia: Color Concentrates Market Size, By End-Use Industry, 2014�2021 (USD Million)
Table 69 UAE.: Color Concentrates Market Size, By End-Use Industry, 2014�2021 (Kiloton)
Table 70 UAE.: Color Concentrates Market Size, By End-Use Industry, 2014�2021 (USD Million)
Table 71 South America: Color Concentrates Market Size, By Country, 2014�2021 (Kiloton)
Table 72 South America: Color Concentrates Market Size, By Country, 2014�2021 (USD Million)
Table 73 South America: Color Concentrates Market Size, By Form, 2014�2021 (Kiloton)
Table 74 South America: Color Concentrates Market Size, By Form, 2014�2021 (USD Million)
Table 75 South America: Color Concentrates Market Size, By End-Use Industry, 2014�2021 (Kiloton)
Table 76 South America: Color Concentrates Market Size, By End-Use Industry, 2014�2021 (USD Million)
Table 77 Brazil: Color Concentrates Market Size, By End-Use Industry, 2014�2021 (Kiloton)
Table 78 Brazil: Color Concentrates Market Size, By End-Use Industry, 2014�2021 (USD Million)
Table 79 Argentina: Color Concentrates Market Size, By End-Use Industry, 2014�2021 (Kiloton)
Table 80 Argentina: Color Concentrates Market Size, By End-Use Industry, 2014�2021 (USD Million)
Table 81 Product Offering
List of Figures (58 Figures)
Figure 1 Color Concentrates Market: Market Segmentation
Figure 2 Limitations
Figure 3 Color Concentrates Market: Research Methodology
Figure 4 Breakdown of Primary Interviews
Figure 5 Market Size Estimation: Bottom-Up Approach
Figure 6 Market Size Estimation: Top-Down Approach
Figure 7 Color Concentrates: Data Triangulation
Figure 8 Research Assumptions
Figure 9 Solid Form to Dominate the Overall Color Concentrates Market in 2015
Figure 10 Color Concentrates Market to Witness Highest Growth in Packaging End-Use Industry Between 2016 and 2021
Figure 11 Asia-Pacific Accounted for the Largest Market Share in 2015
Figure 12 U.S. to Lead Color Concentrates Market, in Terms of Value
Figure 13 Emerging Economies to Offer Lucrative Growth Potential for Market Players Between 2016 and 2021
Figure 14 Packaging to Be the Fastest-Growing End-Use Industry for Color Concentrates Market, 2016�2021
Figure 15 Europe Was the Largest Color Concentrates Market in Terms of Value in 2015
Figure 16 Asia-Pacific Accounted for Largest Share of the Color Concentrates Market in Terms of Volume
Figure 17 Solid Form to Account for Largest Market Share, in Terms of Value
Figure 18 Short Term, Mid-Term, and Long Term Drivers and Restraints
Figure 19 Factors Governing the Color Concentrates Market
Figure 20 Value Chain Analysis
Figure 21 Porter�s Five Forces Analysis: Color Concentrates Market
Figure 22 World Textile Trade Data, 2005�2014
Figure 23 Solid Color Concentrates Dominates the Color Concentrates Market, 2016�2021
Figure 24 Solid Color Concentrates: Manufacturing Process
Figure 25 Liquid Color Concentrates: Manufacturing Process
Figure 26 Packaging End-Use Industry to Dominate the Color Concentrates Market, 2016�2021
Figure 27 China and India to Register High Growth in Color Concentrates Market
Figure 28 Asia-Pacific to Be the Largest Market for Color Concentrates
Figure 29 China Dominates Asia-Pacific Color Concentrates Market
Figure 30 Presence of Key Color Concentrates Producers Such as Ampacet Corporation (U.S.), A. Schulman Inc. (U.S.), and Polyone Corporation (U.S.), Driving the Market
Figure 31 Germany Dominated Color Concentrates Market in Europe, 2015
Figure 32 Plastic Industry Driving the Color Concentrates Market in Middle East & Africa
Figure 33 Dive Chart
Figure 34 Competitive Bench Marking for 25 Key Market Players
Figure 35 Clariant: Company Snapshot
Figure 36 Scorecard for Product Offering
Figure 37 Scorecard for Business Strategy
Figure 38 Polyone Corporation: Company Snapshot
Figure 39 Scorecard for Product Offering
Figure 40 Scorecard for Business Strategy
Figure 41 A. Schulman, Inc.: Company Snapshot
Figure 42 Scorecard for Product Offering
Figure 43 Scorecard for Business Strategy
Figure 44 Scorecard for Product Offering
Figure 45 Scorecard for Business Strategy
Figure 46 Ferro Corporation: Company Snapshot
Figure 47 Scorecard for Product Offering
Figure 48 Scorecard for Business Strategy
Figure 49 Scorecard for Product Offering
Figure 50 Scorecard for Business Strategy
Figure 51 Scorecard for Product Offering
Figure 52 Scorecard for Business Strategy
Figure 53 Scorecard for Product Offering
Figure 54 Scorecard for Business Strategy
Figure 55 Scorecard for Product Offering
Figure 56 Scorecard for Business Strategy
Figure 57 Scorecard for Product Offering
Figure 58 Scorecard for Business Strategy


Growth opportunities and latent adjacency in Color Concentrates Market