CNG Dispenser Market by Type (Fast Fill and Time Fill), Flow Rate (Up to 15, Up to 50, and Up to 100 Kg/Min), Distribution (Company Owned & Company Run, Company Owned & Dealer Run, and Dealer Owned & Dealer Run), and Region - Global Forecast to 2023


[108 Pages Report] The global CNG dispenser market was valued at USD 146.1 million in 2017 and is expected to grow at a CAGR of 7.76% in 2018 to reach USD 255.5 million by 2023. Stringent emission policies in prominent countries and rise in demand for natural gas vehicles are the major drivers that would trigger growth in the CNG dispenser market.
Objectives of the Study
- To define, describe, and forecast the global CNG dispenser market by type, distribution, flow rate, and region
- To provide detailed information on major factors influencing the growth of the market (drivers, restraints, opportunities, and industry-specific challenges)
- To strategically analyze the market with respect to individual growth trends, future prospects, and contribution of each segment to the market
- To analyze market opportunities for stakeholders and details of a competitive landscape for market leaders
- To strategically profile key players and comprehensively analyze their market rankings and core competencies
- To track and analyze competitive developments, such as contracts & agreements, new product development, mergers & acquisitions, and contracts & agreements in the CNG dispenser market
Research Methodology
This research study involved the use of extensive secondary sources, directories, and databases, such as Hoover�s, Bloomberg BusinessWeek, Factiva, and OneSource, to identify and collect information useful for a technical, market-oriented, and commercial study of the global cryogenic Valves market. Primary sources are mainly industry experts from core and related industries, OEMs, vendors, suppliers, technology developers, alliances, and organizations related to all the segments of this industry�s value chain. The points given below explain the research methodology.
- Study of the annual revenue and market developments of the major players providing CNG dispensers
- Analysis of demand for CNG dispensers by type
- Assessment of future trends and growth of type in the market
- Assessment of the market with respect to type by various type
- Study of market trends in various regions and countries, by type, of the market
- Study of contracts and developments related to the market by key players across different regions
- Finalization of overall market sizes by triangulating the supply-side data, which includes product developments and annual revenues of companies supplying CNG dispensers across the globe
After arriving at the overall CNG dispenser market size, the total market has been split into several segments and subsegments. The figure given below illustrates the breakdown of primaries conducted during the research study on the basis of company type, designation, and region.
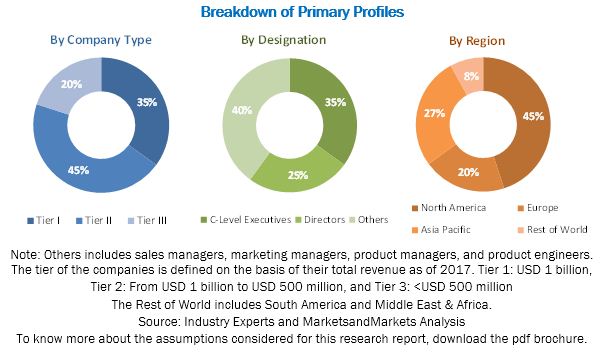
To know about the assumptions considered for the study, download the pdf brochure
Market Ecosystem:
The CNG dispenser market ecosystem comprises equipment manufacturers such as Bennett (US), Censtar (China), Compac (New Zealand), FTI (Canada), Kraus (Canada), Lanfeng (China), Sanki (China), Scheidt & Bachmann (Germany), Tulsa (India), Tatsuno (Japan), Dover (US), Parker (US), and Fortive (US).Target Audience:
The target audience of this report includes:- Automotive & transportation sector
- CNG dispenser manufacturers
- CNG fuel distributors
- CNG kit manufacturers
- Manufacturers and suppliers
- Shipyards
Scope of the Report:
By Type
- Fast fill
- Time fill
By Distribution
- Company owned & company run
- Company owned & dealer run
- Dealer owned & dealer run
By Flow rate
- Up to 15 kg/min
- Up to 50 kg/min
- Up to 100 kg/min
By Region
- Asia Pacific
- Europe
- North America
- South America
- Middle East & Africa
Available Customizations:
With the given market data, MarketsandMarkets offers customizations as per the client�s specific needs. The following customization options are available for this report:
Regional Analysis
- Further breakdown of region or country-specific analysis
Company Information
- Detailed analysis and profiling of additional market players (up to five)
The global CNG dispenser market is estimated to be USD 155.2 million in 2018 and is projected to reach USD 225.5 million by 2023, at a CAGR of 7.76% from 2018 to 2023. This growth can be attributed to the rising demand for natural gas vehicles, with growing refueling infrastructure across the countries.
The CNG dispenser market has been segmented, by type, into fast fill and time fill. The fast fill segment is expected to dominate the market from 2018 to 2023. Growth in natural gas fueled vehicles is one of the key reasons behind the growth of the fast fill market.
The CNG dispenser market has been segmented, by distribution, into company owned & company run, company owned & dealer run, and dealer owned & dealer run. Reduction in cost and complexity in line due to operational improvement program is likely to propel the demand in the market.
The CNG dispenser market has been segmented, by flow rate, into up to 15 kg/min, up to 50 kg/min, and up to 100 kg/min. The up to 100 kg/min segment held the largest share in the market in 2017 and is expected to grow at the fastest CAGR from 2018 to 2023. Light-duty vehicles require quick filling. The flow rate of the dispenser is configured on the basis of station requirements and the type of vehicles serviced.
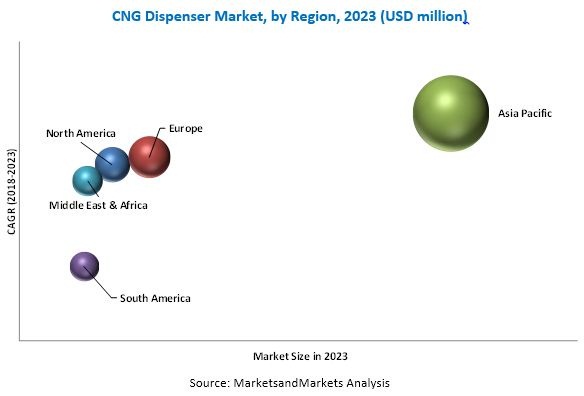
The CNG dispenser market has been analyzed with respect to 5 regions, namely, Asia Pacific, Europe, North America, South America, and the Middle East & Africa. Asia Pacific is estimated to be the largest market during the forecast period. Countries such as China and India have an increasing number of natural gas vehicles, with an increasing number of refueling stations. Moreover, countries such as Australia, Japan, and South Korea have a considerable number of natural gas vehicles, which are expected to drive the CNG dispenser market in the Asia Pacific region during the forecast period.
The major factor restraining the growth of the CNG dispenser market is easy transition to biofuels. Major players across the market are investing in biofuel manufacturing, which makes easier for the transition from liquid fuels to biofuels compared with natural gas, restraining the growth of natural gas vehicles.
Some of the leading players in the CNG dispenser market include as Bennett (US), Censtar (China), Compac (New Zealand), FTI (Canada), Kraus (Canada), Lanfeng (China), Sanki (China), Scheidt & Bachmann (Germany), Tulsa (India), Tatsuno (Japan), Dover (US), Parker (US), and Fortive (US). Contracts & agreements was the most commonly adopted strategy by top players in the market from 2015 to July 2018. It was followed by new product developments and mergers & acquisitions.
To speak to our analyst for a discussion on the above findings, click Speak to Analyst
 Exclusive indicates content/data unique to MarketsandMarkets and not available with any competitors.
Table of Contents
1 Introduction (Page No. - 13)
1.1 Objectives of The Study
1.2 Definition
1.3 Market Scope
1.3.1 Market Segmentation
1.4 Years Considered for The Study
1.5 Currency
1.6 Stakeholders
2 Research Methodology (Page No. - 16)
2.1 Research Data
2.1.1 Secondary Data
2.1.1.1 Secondary Sources
2.1.2 Primary Data
2.1.2.1 Key Data From Primary Sources
2.1.2.2 Breakdown of Primaries
2.2 Market Size Estimation
2.2.1 Bottom-Up Approach
2.2.2 Top-Down Approach
2.3 Market Breakdown & Data Triangulation
2.4 Research Assumptions
3 Executive Summary (Page No. - 24)
4 Premium Insights (Page No. - 28)
4.1 Attractive Opportunities in The CNG Dispenser Market
4.2 CNG Dispenser Market, Application
4.3 CNG Dispenser Market, Type
4.4 CNG Dispenser Market, Flow Rate
4.5 Top 5 Potential Markets
4.6 Top 5 Markets With The Largest Market Size
4.7 Pestle for The Key Markets
4.7.1 China
4.7.2 US
4.7.3 Germany
4.7.4 India
4.7.5 Brazil
5 CNG Dispenser Market Overview (Page No. - 37)
5.1 Introduction
5.2 Market Dynamics
5.2.1 Drivers
5.2.1.1 Stringent Emission Policies
5.2.1.2 Low Running Costs of Natural Gas Vehicles
5.2.2 Restraints
5.2.2.1 Easy Transition to Biofuels
5.2.3 Opportunities
5.2.3.1 Major Vehicle Manufacturers Bringing Natural Gas Vehicles to Market
5.2.3.2 Growing Refueling Infrastructure
5.2.4 Challenges
5.2.4.1 Increasing Production of Electric Vehicles
6 CNG Dispenser Market, By Type (Page No. - 42)
6.1 Introduction
6.2 Fast Filling
6.3 Time Filling
7 CNG Dispenser Market, By Distribution (Page No. - 45)
7.1 Introduction
7.2 Company Owned & Company Run
7.3 Company Owned & Dealer Run
7.4 Dealer Owned & Dealer Run
8 CNG Dispenser Market, By Flow Rate (Page No. - 48)
8.1 Introduction
8.2 Up to 15 Kg/Min
8.3 Up to 50 Kg/Min
8.4 Up to 100 Kg/Min
9 CNG Dispenser Market, By Region (Page No. - 52)
9.1 Introduction
9.2 North America
9.2.1 US
9.2.2 Canada
9.2.3 Mexico
9.3 Europe
9.3.1 Germany
9.3.2 Italy
9.3.3 France
9.3.4 Russia
9.3.5 UK
9.3.6 Rest of Europe
9.4 Asia Pacific
9.4.1 China
9.4.2 India
9.4.3 Japan
9.4.4 South Korea
9.4.5 Australia
9.4.6 Thailand
9.4.7 Malaysia
9.4.8 Rest of the Asia Pacific
9.5 Middle East & Africa
9.5.1 Iran
9.5.2 UAE
9.5.3 Qatar
9.5.4 South Africa
9.5.5 Rest of the Middle East & Africa
9.6 South America
9.6.1 Brazil
9.6.2 Argentina
9.6.3 Venezuela
9.6.4 Rest of South America
10 Competitive Landscape (Page No. - 77)
10.1 Introduction
10.2 Competitive Scenario
10.2.1 New Product Developments
10.2.2 Mergers & Acquisitions
10.2.3 Contracts & Agreements
11 Company Profiles (Page No. - 81)
Business Overview, Factory Locations, Products Offered, Recent Developments, MnM View
11.1 Bennett
11.2 Censtar
11.3 Compac
11.4 FTI International
11.5 Kraus
11.6 Lanfeng
11.7 Sanki
11.8 Scheidt & Bachmann
11.9 Tulsa Gas Technologies
11.10 Tatsuno
11.11 Dover
11.12 Parker
11.13 Fortive
*Details on Business Overview, Factory Locations, Products Offered, Recent Developments, MnM View
12 Appendix (Page No. - 102)
12.1 Insights of Industry Experts
12.2 Discussion Guide
12.3 Knowledge Store: Marketsandmarkets� Subscription Portal
12.4 Available Customizations
12.5 Related Reports
12.6 Author Details
List of Tables (62 Tables)
Table 1 Global CNG Dispenser Market Snapshot
Table 2 Top 5 Potential Markets, Cagr % (2018�2023)
Table 3 Top 5 Potential Markets in Terms of Market Size, 2016�2023 (USD Million)
Table 4 Environmental Protection Acts of A Few Major Countries
Table 5 Market Size, By Type, 2016�2023 (USD Million)
Table 6 Fast Fill: Market Size, By Region, 2016�2023 (USD Million)
Table 7 Time Fill: Market Size, By Region, 2016�2023 (USD Million)
Table 8 Market Size, By Distribution, 2016�2023 (USD Million)
Table 9 Company Owned & Company Run: Market Size, By Region, 2016�2023 (USD Million)
Table 10 Company Owned & Dealer Run: Market Size, By Region, 2016�2023 (USD Million)
Table 11 Dealer Owned & Dealer Run: Market Size, By Region, 2016�2023 (USD Million)
Table 12 Market Size, By Flow Rate, 2016�2023 (USD Million)
Table 13 Up to 15kg/Min: Market Size, By Region, 2016�2023 (USD Million)
Table 14 Up to 50kg/Min: Market Size, By Region, 2016�2023 (USD Million)
Table 15 Up to 100kg/Min: Market Size, By Region, 2016�2023 (USD Million)
Table 16 North America: CNG Dispenser Market Size, By Flow Rate, 2016�2023 (USD Million)
Table 17 North America: Market Size, By Distribution, 2016�2023 (USD Million)
Table 18 North America: Market Size, By Type, 2016�2023 (USD Million)
Table 19 North America: Market Size, By Country, 2016�2023 (USD Million)
Table 20 US: Market Size, By Type, 2016�2023 (USD Million)
Table 21 Canada: Market Size, By Type, 2016�2023 (USD Million)
Table 22 Mexico: Market Size, By Type, 2016�2023 (USD Million)
Table 23 Europe: Market Size, By Flow Rate, 2016�2023 (USD Million)
Table 24 Europe: Market Size, By Distribution, 2016�2023 (USD Million)
Table 25 Europe: Market Size, By Type, 2016�2023 (USD Million)
Table 26 Europe: Market Size, By Country, 2016�2023 (USD Million)
Table 27 Germany: CNG Dispenser Market Size, By Type, 2016�2023 (USD Million)
Table 28 Italy: Market Size, By Type, 2016�2023 (USD Million)
Table 29 France: Market Size, By Type, 2016�2023 (USD Million)
Table 30 Russia: Market Size, By Type, 2016�2023 (USD Million)
Table 31 UK: Market Size, By Type, 2016�2023 (USD Million)
Table 32 Rest of Europe: Market Size, By Type, 2016�2023 (USD Million)
Table 33 Asia Pacific: CNG Dispenser Market Size, By Flow Rate, 2016�2023 (USD Million)
Table 34 Asia Pacific: Market Size, By Distribution, 2016�2023 (USD Million)
Table 35 Asia Pacific: Market Size, By Type, 2016�2023 (USD Million)
Table 36 Asia Pacific: Market Size, By Country, 2016�2023 (USD Million)
Table 37 China: Market Size, By Type, 2016�2023 (USD Million)
Table 38 India: Market Size, By Type, 2016�2023 (USD Million)
Table 39 Japan: Market Size, By Type, 2016�2023 (USD Million)
Table 40 South Korea: CNG Dispenser Market Size, By Type, 2016�2023 (USD Million)
Table 41 Australia: Market Size, By Type, 2016�2023 (USD Million)
Table 42 Thailand: Market Size, By Type, 2016�2023 (USD Million)
Table 43 Malaysia: Market Size, By Type, 2016�2023 (USD Million)
Table 44 Rest of Asia Pacific: Market Size, By Type, 2016�2023 (USD Million)
Table 45 Middle East & Africa: Market Size, By Flow Rate, 2016�2023 (USD Million)
Table 46 Middle East & Africa: Market Size, By Distribution, 2016�2023 (USD Million)
Table 47 Middle East & Africa: Market Size, By Type, 2016�2023 (USD Million)
Table 48 Middle East & Africa: Market Size, By Country, 2016�2023 (USD Million)
Table 49 Iran: CNG Dispenser Market Size, By Type, 2016�2023 (USD Million)
Table 50 UAE: Market Size, By Type, 2016�2023 (USD Million)
Table 51 Qatar: Market Size, By Type, 2016�2023 (USD Million)
Table 52 South Africa: Market Size, By Type, 2016�2023 (USD Million)
Table 53 Rest of Middle East & Africa: Market Size, By Type, 2016�2023 (USD Million)
Table 54 South America: Market Size, By Flow Rate, 2016�2023 (USD Million)
Table 55 South America: Market Size, By Distribution, 2016�2023 (USD Million)
Table 56 South America: Market Size, By Type, 2016�2023 (USD Million)
Table 57 South America: Market Size, By Country, 2016�2023 (USD Million)
Table 58 Brazil: Market Size, By Type, 2016�2023 (USD Million)
Table 59 Argentina: Market Size, By Type, 2016�2023 (USD Million)
Table 60 Venezuela: Market Size, By Type, 2016�2023 (USD Million)
Table 61 Rest of South America: Market Size, By Type, 2016�2023 (USD Million)
Table 62 Kraus Was the Most Active Player in the Market Between 2015 and 2018
List of Figures (28 Figures)
Figure 1 Research Design
Figure 2 Breakdown of Primaries: By Company Type, Designation, & Region
Figure 3 Bottom-Up Approach
Figure 4 Top-Down Approach
Figure 5 Data Triangulation Methodology
Figure 6 Assumptions of the Research Study
Figure 7 Global CNG Market, By Distribution
Figure 8 Asia Pacific Held the Largest Share in the CNG Dispenser Market in 2017
Figure 9 Company Owned & Company Run is Expected to Grow at the Highest Cagr During the Forecast Period
Figure 10 Below Segmented is Expected to Dominate the Market During the Forecast Period
Figure 11 Up to 100 Kg/Min is Expected to Dominate the CNG Dispenser Market During the Forecast Period
Figure 12 Attractive Opportunities in the Market During the Forecast Period
Figure 13 Company Owned & Company Run to Lead the Market, 2018-2023
Figure 14 Fast Fill Led the CNG Dispenser Marker in 2017
Figure 15 Below Up to 100kg/Min Led the CNG Dispenser Marker in 2017
Figure 16 Asia Pacific Led the CNG Dispenser Marker in 2017
Figure 17 Drivers, Restraints, Opportunities, and Challenges
Figure 18 Greenhouse Gas Emissions
Figure 19 Number of Natural Gas Vehicles in Operation
Figure 20 Asia Pacific is Expected to Grow at the Highest Cagr During the Forecast Period
Figure 21 Asia Pacific Led the Market in 2017
Figure 22 Europe Market Snapshot
Figure 23 Asia Pacific: Market Snapshot
Figure 24 Top 5 Players to Watch in the Potential and Large Markets
Figure 25 Contracts & Agreements Was the Most Widely Adopted Strategy Between 2015 and 2018
Figure 26 Dover: Company Snapshot
Figure 27 Parker: Company Snapshot
Figure 28 Fortive: Company Snapshot


Growth opportunities and latent adjacency in CNG Dispenser Market