CHPTAC Market by End-Use Industry (paper, textile, water treatment, oil & gas, and others) and By Region (North America, Europe, Asia-Pacific, and Rest of World) - Industry Trends & Forecast to 2020


CHPTAC is required for the cationization of starch which is then utilized by the paper and textile industry. CHPTAC finds application in end-user industries which include paper, textile, water treatment, oil & gas, and others (personal care, dye, nutraceuticals, cosmetics and chemicals). The market depends majorly on the paper industry and the growth of the paper industry indirectly drives the growth of the CHPTAC market. The restraints of the market are identified as the increasing manufacturing and logistics costs. The report covers qualitative aspect of CHPTAC and detailed volume (tons) and value (USD million) forecasts of CHPTAC along with its end-use industries and region.
This study aims at estimating the global market of CHPTAC for 2015 and to project the expected demand of the same by 2020. This market research study provides a detailed qualitative and quantitative analysis of the market. It provides a comprehensive review of the key market drivers, restraints, opportunities, winning imperatives, challenges, and key issues in the market. The market is segmented and projected for important regions, such as Asia-Pacific, Europe, North America and Rest of World, which are further segmented for key countries in each region.
The market for CHPTAC is projected to register a CAGR of 4.7% between 2015 and 2020, to reach USD 218.9 Million by 2020. Asia-Pacific will be the growth driver during the period of study. Thailand has the largest market share and India is the fastest-growing market in Asia-Pacific.
Competitive scenarios of top players in the CHPTAC market have been discussed in detail. We have also profiled leading players of this industry which include, The Dow Chemical Company (U.S.), Sachem Inc, (U.S.), Samsung Fine Chemicals (Korea), SKW Quab Chemicals Inc. (U.S.), Yanzhou Tiancheng Chemicals Co. Ltd. (China), Dongying Guofeng Fine Chemicals Co., Ltd. (China), Dongying J&M Chemical Co., Ltd (China), Chemigate Oy (Finland), Shubham Starch Chem (P) Ltd. (India), and Weifang Greatland Paper and Chemicals Co., Ltd. (China).
Scope of the Report:
This research report categorizes the market for CHPTAC on the basis of end-use industry and region along with forecasting volume, value, and trends in each of the markets.
On the basis of end use industry:
The CHPTAC market is characterized on the basis of end-use industries that include paper, textile, water treatment, oil & gas, and others (personal care, dye, nutraceuticals, cosmetics and chemicals). These end-use industries are described in detail in this report.
On the basis of region
Regional level for CHPTAC includes North America, Asia-Pacific, Europe, and Rest of the World and further for key countries in each region that include U.S., China, Thailand, India, Germany, France, Turkey, and The Netherlands. South America and the Middle East & Africa are collectively considered in Rest of the World.
The CHPTAC market size is projected to witness a CAGR of 3.3% between 2015 and 2020 in terms of volume, and the market size is expected to reach 125.3 Kilotons by 2020. This report follows both top-down and bottom-up approaches to estimate and forecast the market size.
The report on ‘CHPTAC market’ considers study of CHPTAC by its end-use industries in the four regions which include North America, Europe, Asia-Pacific, and Rest of World which includes South America and the Middle East & Africa. CHPTAC is used in various end-use industries which include paper, textile, water treatment, oil & gas, and others (personal care, dye, nutraceuticals, cosmetics, and chemicals). The market is expected to increase significantly in Asia-Pacific due to the growing paper industry. The growing paper industry in emerging markets is projected to register decent CAGRs in terms of volume, during the forecast period (2015-2020).
The market for CHPTAC is growing with an average growth rate, with Asia-Pacific leading in terms of consumption. The growing key end-use industries and strong demand from the Asia-Pacific are the key drivers of the CHPTAC market. The U.S., Thailand, and China are the largest markets for CHPTAC. The key markets in developing countries include China, Thailand, and India whereas major markets in developed countries include U.S. and the Netherlands.
The key participants in this market are The Dow Chemical Company (U.S.), Sachem Inc. (U.S.), Samsung Fine Chemicals (South Korea), SKW Quab Chemicals Inc. (U.S.), Yanzhou Tiancheng Chemicals Co. Ltd. (China), Dongying Guofeng Fine Chemicals Co., Ltd. (China), Dongying J&M Chemical Co., Ltd (China), Chemigate Oy (Finland), Shubham Starch Chem. (P) Ltd. (India), and Weifang Greatland Paper and Chemicals Co., Ltd. (China).
Owing to the growth of the paper industry, Asia-Pacific remains an attractive market for CHPTAC. China is projected to be the largest paper industry which shall drive the growth of CHPTAC in the country. Asia-Pacific is the fastest-growing market across the world. With the aforementioned opportunities, the overall CHPTAC market remains attractive during the forecast period.
 Exclusive indicates content/data unique to MarketsandMarkets and not available with any competitors.
Table of Contents
1 Introduction (Page No. - 12)
1.1 Objectives of the Study
1.2 Market Definition
1.3 Market Scope
1.3.1 By Region
1.3.2 By End-Use Industry
1.3.3 Years Considered for the Study
1.4 Currency and Pricing
1.5 Package Size
1.6 Limitations
1.7 Stakeholders
2 Research Methodology (Page No. - 15)
2.1 Research Data
2.1.1 Secondary Data
2.1.1.1 Key Data From Secondary Sources
2.1.2 Primary Data
2.1.2.1 Key Data From Primary Sources
2.1.2.2 Key Industry Insights
2.1.2.3 Breakdown of Primaries
2.2 Market Size Estimation
2.2.1 Bottom-Up Approch
2.2.2 Top-Down Approach
2.3 Market Breakdown & Data Triangulation
2.4 Research Assumptions
3 Executive Summary (Page No. - 22)
4 Premium Insights (Page No. - 25)
4.1 Attractive Opportunities in the CHPTAC Market
4.2 Life Cycle Analysis, By Region
5 Market Overview (Page No. - 28)
5.1 Introduction
5.2 Market Segmentation
5.2.1 By End-Use Industry
5.2.2 By Region
5.3 Market Dynamics
5.3.1 Drivers
5.3.2 Restraints
5.3.2.1 Increasing Manufacturing and Shipping Costs
5.3.2.2 Environmental Impact
5.3.3 Opportunity
5.3.3.1 Increasing Demands From Paper and Textile Industry
5.3.3.2 Increasing GDP of Emerging Countries
5.3.4 Challenges
5.3.4.1 Price Sensitive Market
5.4 Burning Issues
5.4.1 Harmful to Aquatic Life
5.5 Winning Imperatives
6 Industry Trends (Page No. - 34)
6.1 Introduction
6.2 Value Chain Analysis
6.2.1 Raw Materials
6.2.2 Manufacturing
6.2.3 End-User Industries
6.3 Porter’s Five Forces Analysis
6.3.1 Threat 0f New Entrants
6.3.2 Bargaining Power of Suppliers
6.3.3 Threat of Substitutes
6.3.4 Bargaining Power of Buyers
6.3.5 Intensity of Rivalry
7 CHPTAC Market, By End-Use Industry (Page No. - 38)
7.1 Introduction
7.2 Paper
7.3 Textile
7.4 Water Treatment
7.5 Oil & Gas
7.6 Others
8 CHPTAC Market Size, By Region (Page No. - 47)
8.1 Introduction
8.2 North America
8.2.1 U.S.
8.2.2 Rest of North America
8.3 Europe
8.3.1 The Netherlands
8.3.2 France
8.3.3 Germany
8.3.4 Turkey
8.3.5 Rest of Europe
8.4 Asia-Pacific
8.4.1 Thailand
8.4.2 China
8.4.3 India
8.4.4 Rest of Asia-Pacific
8.5 RoW
8.5.1 South America
8.5.2 Middle East & Africa
9 Company Profiles (Page No. - 79)
9.1 The DOW Chemical Company
9.1.1 Business Overview
9.1.2 Products & Their End-Use Industry
9.1.3 SWOT Analysis
9.1.4 MnM View
9.2 Samsung Fine Chemicals Co. Ltd
9.2.1 Business Overview
9.2.2 Products & Their End-Use Industry
9.2.3 SWOT Analysis
9.2.4 MnM View
9.4 Sachem Inc
9.4.1 Business Overview
9.4.2 Products & Their End-Use Industry
9.4.3 MnM View
9.5 Skw Quab Chemicals Inc.
9.5.1 Business Overview
9.5.2 Products & Their End-Use Industry
9.6 Yanzhou Tiancheng Chemical Co., Ltd.
9.6.1 Business Overview
9.6.2 Products
9.7 Dongying Guofeng Fine Chemicals Co., Ltd.
9.7.1 Business Overview
9.7.2 Products & Their End-Use Industry
9.8 Dongying J&M Chemical Co., Ltd,
9.8.1 Business Overview
9.8.2 Products & Their End-Use Industry
9.9 Chemigate Oy
9.9.1 Business Overview
9.9.2 Products & Their End-Use Industry
9.10 Shubham Starch Chem (P) Ltd.
9.10.1 Business Overview
9.10.2 Products & Their End-Use Industry
9.11 Weifang Greatland Paper and Chemicals Co., Ltd.
9.11.1 Business Overview
9.11.2 Products & Their End-Use Industry
10 Appendix (Page No. - 91)
10.1 Insights of Industry Experts
10.2 Discussion Guide
10.3 Introducing RT: Real Time Market Intelligence
10.4 Available Customizations
10.5 Related Reports
List of Tables (61 Tables)
Table 1 Impact of Global CHPTAC Market Drivers (2015-2020)
Table 2 Impact of Global CHPTAC Market Restraints (2015-2020)
Table 3 Impact of Global CHPTAC Market Opportunity (2015-2020)
Table 4 Impact of Global CHPTAC Market Challenges (2015-2020)
Table 5 Impact of Global CHPTAC Market Burning Issues (2015-2020)
Table 6 Market Size, By End-Use Industry, 2013–2020 (Tons)
Table 7 Market Size, By End-Use Industry, 2015-2020 ($Million)
Table 8 Market Size in Paper Industry, By Region, 2015-2020 (Tons)
Table 9 Market Size in Paper Industry, By Region, 2015-2020 ($Million)
Table 10 CHPTAC Market Size in Textile, By Region, 2015-2020 (Tons)
Table 11 CHPTAC Market Size in Textiles, By Region, 2015-2020 ($Million)
Table 12 CHPTAC Market Size in Water Treatment, By Region, 2015-2020 (Tons)
Table 13 CHPTAC Market Size in Water Treatment, By Region, 2015-2020 ($Million)
Table 14 CHPTAC Market Size in Oil & Gas, By Region, 2015-2020 (Tons)
Table 15 Market Size in Oil & Gas, By Region, 2015-2020 ($Million)
Table 16 Market Size in Other End-Use Industries, By Region, 2015-2020 (Tons)
Table 17 Market Size in Other End-Use Industries, By Region, 2015-2020 ($Million)
Table 18 Market Size, By Region, 2013-2020 (Tons)
Table 19 Market Size, By Region, 2013-2020 ($Million)
Table 20 North America: CHPTAC Market Size, By Country, 2013-2020 (Tons)
Table 21 North America: Market Size, By Country, 2013-2020 ($Million)
Table 22 North America: CHPTAC Market Size, By End-Use Industry, 2013-2020 (Tons)
Table 23 North America: Market Size, By End-Use Industry, 2013-2020 ($Million)
Table 24 U.S.: CHPTAC Market Size, By End-Use Industry, 2013-2020 (Tons)
Table 25 U.S.: Market Size, By End-Use Industry, 2013-2020 ($Million)
Table 26 Rest of North America: CHPTAC Market Size, By End-Use Industry, 2013-2020 (Tons)
Table 27 Rest of North America: Market Size, By End-Use Industry, 2013-2020 ($Million)
Table 28 Europe: CHPTAC Market Size, By Country, 2013-2020 (Tons)
Table 29 Europe: Market Size, By Country, 2013-2020 ($Million)
Table 30 Europe: CHPTAC Market Size, By End-Use Industry, 2013-2020 (Tons)
Table 31 Europe: Market Size, By End-Use Industry, 2013-2020 ($Million)
Table 32 The Netherlands: CHPTAC Market Size, By End-Use Industry, 2013-2020 (Tons)
Table 33 The Netherlands: Market Size, By End-Use Industry, 2013-2020 ($Million)
Table 34 France: Market Size, By End-Use Industry, 2013-2020 (Tons)
Table 35 France: CHPTAC Market Size, By End-Use Industry, 2013-2020 ($Million)
Table 36 Germany: Market Size, By End-Use Industry, 2013-2020 (Tons)
Table 37 Germany: CHPTAC Market Size, By End-Use Industry, 2013-2020 ($Million)
Table 38 Turkey: Market Size, By End-Use Industry, 2013-2020 (Tons)
Table 39 Turkey: Market Size, By End-Use Industry, 2013-2020 ($Million)
Table 40 Rest of Europe: Market Size, By End-Use Industry, 2013-2020 (Tons)
Table 41 Rest of Europe: Market Size, By End-Use Industry, 2013-2020 ($Million)
Table 42 Asia-Pacific: CHPTAC Market Size, By Country, 2013-2020 (Tons)
Table 43 Asia-Pacific: Market Size, By Country, 2013-2020 ($Million)
Table 44 Asia-Pacific: Market Size, By End-Use Industry, 2013-2020 (Tons)
Table 45 Asia-Pacific: CHPTAC Market Size, By End-Use Industry, 2013-2020 ($Million)
Table 46 Thailand: Market Size, By End-Use Industry, 2013-2020 (Tons)
Table 47 Thailand: Market Size, By End-Use Industry, 2013-2020 ($Million)
Table 48 China: CHPTAC Market Size, By End-Use Industry, 2013-2020 (Tons)
Table 49 China: Market Size, By End-Use Industry, 2013-2020 ($Million)
Table 50 India: CHPTAC Market Size, By End-Use Industry, 2013-2020 (Tons)
Table 51 India: Market Size, By End-Use Industry, 2013-2020 ($Million)
Table 52 Rest of Asia-Pacific: Market Size, By End-Use Industry, 2013-2020 (Tons)
Table 53 Rest of Asia-Pacific: Market Size, By End-Use Industry, 2013-2020 ($Million)
Table 54 RoW: CHPTAC Market Size, By Country, 2013-2020 (Tons)
Table 55 RoW: Market Size, By Country, 2013-2020 ($Million)
Table 56 RoW: Market Size, By End-Use Industry, 2013-2020 (Tons)
Table 57 RoW: CHPTAC Market Size, By End-Use Industry, 2013-2020 ($Million)
Table 58 South America: CHPTAC Market Size, By End-Use Industry, 2013-2020 (Tons)
Table 59 South America: Market Size, By End-Use Industry, 2013-2020 ($Million)
Table 60 Middle East & Africa: Market Size, By End-Use Industry, 2013-2020 (Tons)
Table 61 Middle East & Africa: CHPTAC Market Size, By End-Use Industry, 2013-2020 ($Million)
List of Figures (36 Figures)
Figure 1 Research Design
Figure 2 Breakdown of Primary Interviews: By Company Type, Designation & Region
Figure 3 CHPTAC Market Size Estimation Methodology: Bottom-Up Approach
Figure 4 CHPTAC Market Size Estimation Methodology: Top-Down Approach
Figure 5 CHPTAC Market Data Triangulation
Figure 6 Water Treatment is Expected to Be the Fastest Growing CHPTAC End-Use Industry (Tons) During the Forecast Period
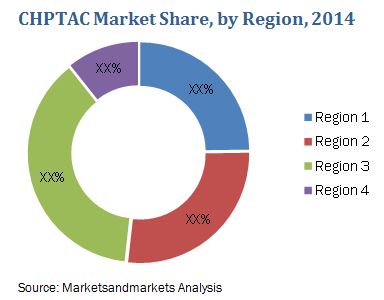
Figure 7 CHPTAC Market Share By Region, 2014 (Tons)
Figure 8 CHPTAC Market Size, 2015 vs. 2020 ($Million)
Figure 9 CHPTAC End-Use in Paper Industry Accounts for the Largest Share (Value) in Asia-Pacific, 2014
Figure 10 Paper is the Fastest-Growing End-Use Industry of CHPTAC in Asia-Pacific, 2015-2020
Figure 11 Asia-Pacific Countries to Be the Emerging Markets for CHPTAC in the Forecast Period, 2015-2020
Figure 12 Asia-Pacific Market in Exponential Growth Phase
Figure 13 Market: By End-Use Industry
Figure 14 Market Segmentation, By Region
Figure 15 Increasing Demand From Emerging Markets Drive the CHPTAC Market
Figure 16 Value Chain Analysis: Major Value is Added in End-User Industries
Figure 17 Porter’s Five Forces Analysis of the CHPTAC Market
Figure 18 Market Share (Volume), By End-Use Industry, 2014
Figure 19 India to Be the Fastest Growing Market for CHPTAC Between 2015–2020 (Tons)
Figure 20 Asia-Pacific Reigning the CHPTAC Market, 2014 (Tons)
Figure 21 Regional Snapshot – Rapid Growth Markets are Emerging as New Hotspots
Figure 22 Asia-Pacific is Projected to Account for More Than 65% of the Market Growth By Volume Between 2015 & 2020
Figure 23 The U.S. Accounted for the Major Market Share in North America in 2014
Figure 24 Paper Industries Dominates the Consumption of CHPTAC in the U.S.
Figure 25 Europe Snapshot: the Netherlands Dominates the Consumption of CHPTAC in Europe
Figure 26 European Market Snapshot: Country Wise Consumption of CHPTAC in Paper, Water Treatment, Textile and Oil & Gas
Figure 27 The Netherlands Accounts for the Major Share of CHPTAC in Europe
Figure 28 Paper Industry to Be the Largest End-Use Industry of CHPTAC in the Netherlands
Figure 29 Asia-Pacific Snapshot: Thailand Dominates the Consumption of CHPTAC in Asia-Pacific
Figure 30 Asia-Pacific Snapshot: Thailand Dominates the Consumption of CHPTAC in Asia-Pacific
Figure 31 Asia Pacific: Country Wise Consumption in Paper, Water Treatmnet, Textile and Oil & Gas
Figure 32 The South American Market Offers Major Opportunities for the CHPTAC Market in RoW
Figure 33 DOW: Company Snapshot
Figure 34 DOW: SWOT Analysis
Figure 35 Samsung Fine Chemicals: Company Snapshot
Figure 36 Samsung Fine Chemicals Co. Ltd: SWOT Analysis


Growth opportunities and latent adjacency in CHPTAC Market